


Scientists estimate that five times as much carbon might be stored in frozen Arctic soils—permafrost—as has been emitted by all human activities since 1850. This worries people who study global warming. While emissions from permafrost currently account for less than 1 percent of global methane emissions, some researchers think this could change in dramatic ways as the world warms and that carbon-rich frozen soil breaks down.
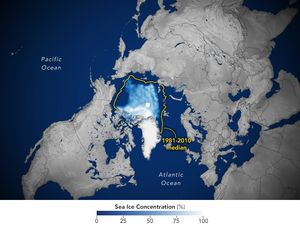
The map above, based on data provided by the National Snow and Ice Data Center, shows the extent of Arctic permafrost. Any rock or soil remaining at or below 0 degrees Celsius (32 degrees Fahrenheit) for two or more years is considered permafrost.
Continuous permafrost, which occurs in the coldest areas, refers to areas where frozen soil underlies more than 90 percent of the surface. Discontinuous permafrost occurs in slightly warmer areas, where frozen soils underlie 50 to 90 percent of the surface, while certain features such as rivers and south-facing slopes may be ice-free. In areas with sporadic permafrost, frozen soils underlie 10 to 50 percent of the surface. In areas with isolated permafrost, frozen soils underlie less than 10 percent of the surface, usually only occurring in depressions or north-facing slopes.
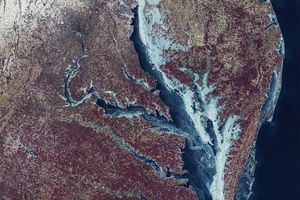
The photograph above, from the U.S. Geological Survey’s Alaska Science Center, shows collapsed permafrost along the Alaskan coast. When permafrost gets warm enough, the soil thaws and microbial activity increases. Thawing also opens up new pathways for older stores of “geologic” methane, long-trapped by glaciers and soil layers, to leak. Both processes release greenhouse gases, including methane and carbon dioxide, into the atmosphere.
Katey Walter Anthony, a hydrologist at the University of Alaska–Fairbanks, has mapped more than 150,000 methane seeps near the boundaries of thawing permafrost and receding glaciers. The seeps appear as holes in frozen lakes and rivers that, on close inspection, are bubbling with methane.
The methane seeps that Anthony found are not necessarily caused by global warming, and there is no way to know how the number today compares to the number that existed during earlier periods. But the simple existence of such seeps illustrates how methane could theoretically escape when underlying soils and waters emerge from beneath ice cover.
Read more about methane in our feature story Methane Matters.
References & Resources
- European Commission Permafrost. Accessed March 30, 2015.
- NASA (2013, June 10) Is a Sleeping Giant Stirring in the Arctic? Accessed March 30, 2015.
- NASA Landsat Program Alaska’s Thawing Permafrost Accessed March 30, 2015.
- National Geographic (2008, June 17) Permafrost. Accessed March 30, 2015.
- National Snow & Ice Data Center Permafrost and Frozen Ground. Accessed March 30, 2015.
NASA Earth Observatory map by Joshua Stevens, using data from the National Snow and Ice Data Center . Caption by Adam Voiland.