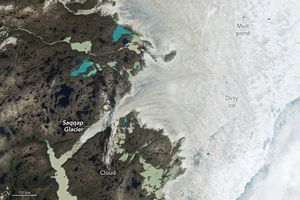


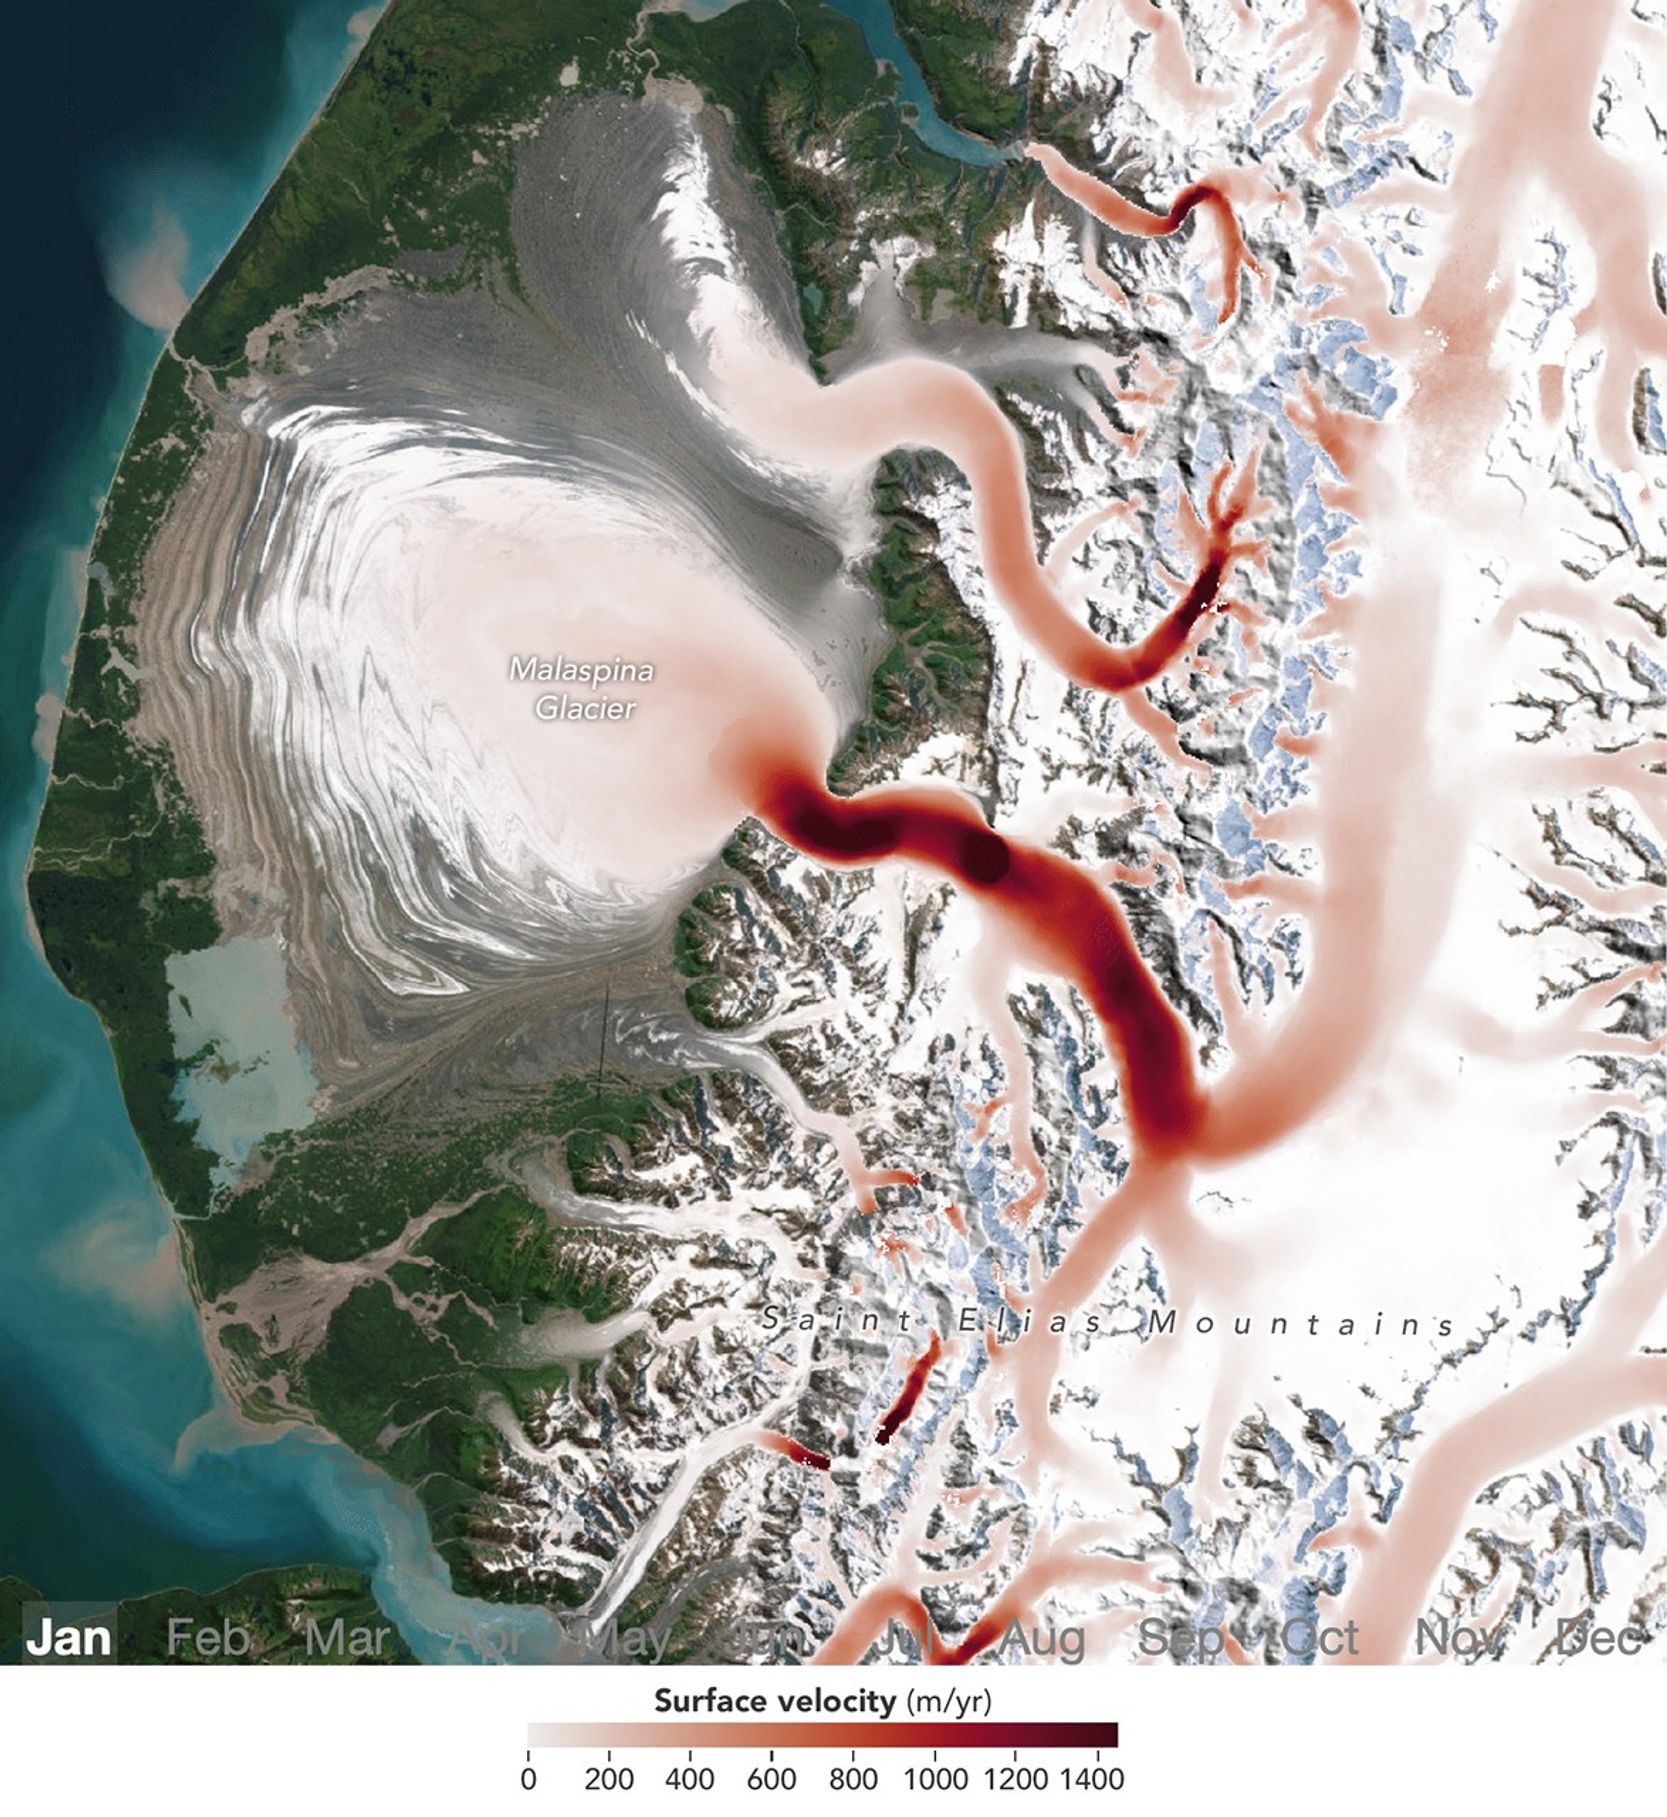
Malaspina Glacier in southeastern Alaska is the planet’s largest piedmont glacier, with ice that spills from the Saint Elias Mountains’ higher elevations and spreads out like pancake batter onto the coastal plain. Though it might appear static, the glacier is “alive” with movement throughout the year, typically speeding up in spring and slowing to a crawl by winter. A new analysis by NASA scientists shows that glaciers around the world display all kinds of patterns in seasonal movement—some similar to Malaspina and some vastly different.
For decades, researchers have documented seasonal speedups and slowdowns in glacier flow, typically focusing on individual glaciers or specific regions. By analyzing millions of optical and radar satellite images collected between 2014 and 2022, glaciologists Chad Greene and Alex Gardner at NASA’s Jet Propulsion Laboratory (JPL) have mapped this variability on a global scale. The new perspective reveals how glaciers in different regions respond to seasonal warming and may help identify which ones are most vulnerable to a warming climate. Their analysis was published in November 2025 in Science.
Glacier speed is measured by tracking the motion of deep cracks called crevasses and surface debris in sequences of satellite images collected over time. Crevasse fields and other surface patterns provide unique glacial "fingerprints" that scientists track using an algorithm developed at JPL as part of the ITS_LIVE project. The team used this technique to map glacier flow at high resolution globally, then analyzed subtle changes in glacier speed to understand how glaciers respond to warming that occurs between winter and summer.
“Earth has over 200,000 glaciers, and we’re watching all of them closely,” said Gardner, the study’s coauthor. “It’s no surprise that with this much data, a pattern started to emerge.”

The timing of glacier speedups is driven by the onset of the melt season and by processes at the glacier bed that reduce friction with the underlying ground. “Glaciers are like rivers of ice that flow down mountains toward the sea,” said Greene, the study's lead author. “When warm air melts the upper surface of a glacier, all that meltwater can make its way down to the base of the ice and act like a lubricant, causing the glacier to speed up.”
The researchers observed the strongest seasonal accelerations at high northern latitudes: in Alaska, glaciers moved fastest in spring, whereas in Arctic regions of Europe and Russia, they typically reached their top speeds in summer or early fall.
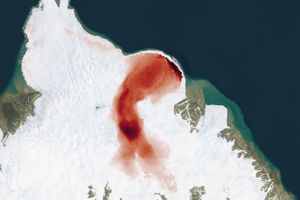
The animation above shows parts of Malaspina (also called Sit' Tlein) beginning to pick up speed in early spring, when the first meltwater starts draining through cracks in the ice and down to the glacier’s base. At this point, conduits that form in the base are still small, so the meltwater can build up pressure and reduce friction, allowing the glacier to slide more easily over uneven ground. Through late summer, as the seasonal surge of meltwater carves larger and deeper channels under the glacier, the pressure drops and friction increases, causing the glacier to slow down.


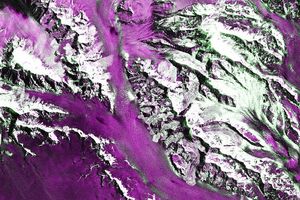
Other glaciers display different patterns. One example is the Barnes Ice Cap on Baffin Island in the Canadian Arctic—a remnant of the Laurentide Ice Sheet that once covered much of North America. This glacier is a classic example of summer acceleration, producing little meltwater for most of the year, then speeding up when meltwater finally arrives. In contrast, seasonal changes unfold more gradually at Baltoro Glacier in the Karakoram range of Pakistan. There, the speedup begins high on the glacier and slowly propagates downward as the melting season progresses.
Understanding glacier responses to seasonal warming allows researchers to better anticipate how glaciers will respond to climate change. The team found that glacier flow accelerates with every degree of warming and that seasonal flow patterns are linked to longer-term glacier change, meaning spring and summer speedups can serve as a vital sign that indicates a glacier’s resilience to prolonged warming.
“We wanted to check the health of Earth’s glaciers, so we measured their pulse,” Greene said. “Now we just need to keep an eye on their temperature.”
Maps courtesy of Chad Greene and Alex Gardner, NASA/JPL, using data from the NASA MEaSUREs project ITS_LIVE. Story by Kathryn Hansen.
References & Resources
- Greene, C. A. and Gardner, A. S. (2025) Seasonal dynamics of Earth’s glaciers and ice sheets. Science, 390, 6776.
- NASA Earth Observatory (2000, February 23) Karakoram Range, Pakistan. Accessed December 1, 2025.
- NASA Earth Observatory (2019, September 11) Malaspina on the Move. Accessed December 1, 2025.
- NASA Earth Observatory (2010, October 10) Barnes Ice Cap, Baffin Island, Canada. Accessed December 1, 2025.
- NASA’s Jet Propulsion Laboratory (2025) Inter-mission Time Series of Land Ice Velocity and Elevation (ITS_LIVE ). Accessed December 1, 2025.
- Ultee, L. (2025) How does glacier flow vary by season? Science, 390, 6776.