


Rotating Globe Animation (3.9 MB)
Cylindrical Projection Animation (3.9 MB)
Everything about life on Earth depends on life in the ocean. After all, this is a blueplanet, with about 70 percent of the total surface awash with one of the most commonmolecular compounds known: water.
The oceans regulate the planet’s biological wellbeing. But water alone is not enough.Life in its most common forms demands a ready supply of a particular element if it’s tothrive: carbon.
It’s the same stuff that composes lowly coal, and it’s the core of proud tree trunks.Carbon is the root of all life on Earth, and as its complex dance carries it through thebiosphere, the Earth’s state of health responds.
By monitoring the color of reflected light via satellite, scientists can determine howsuccessfully plant life is photosynthesizing. A measurement of photosynthesis isessentially a measurement of successful growth, and growth means successful use ofambient carbon.
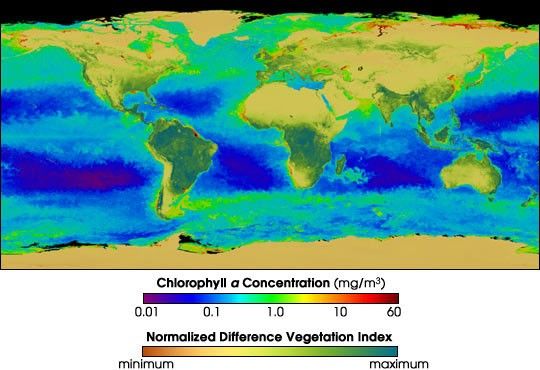
Until now, scientists have only had a continuous record of photosynthesis on land.But following three years of continual data collected by the Sea-viewing WideField-of-view Sensor (SeaWiFS) instrument,NASA has gathered the first record of photosynthetic productivity in the oceans. Theprocess begins with a measurement of surface chlorophyll concentration.
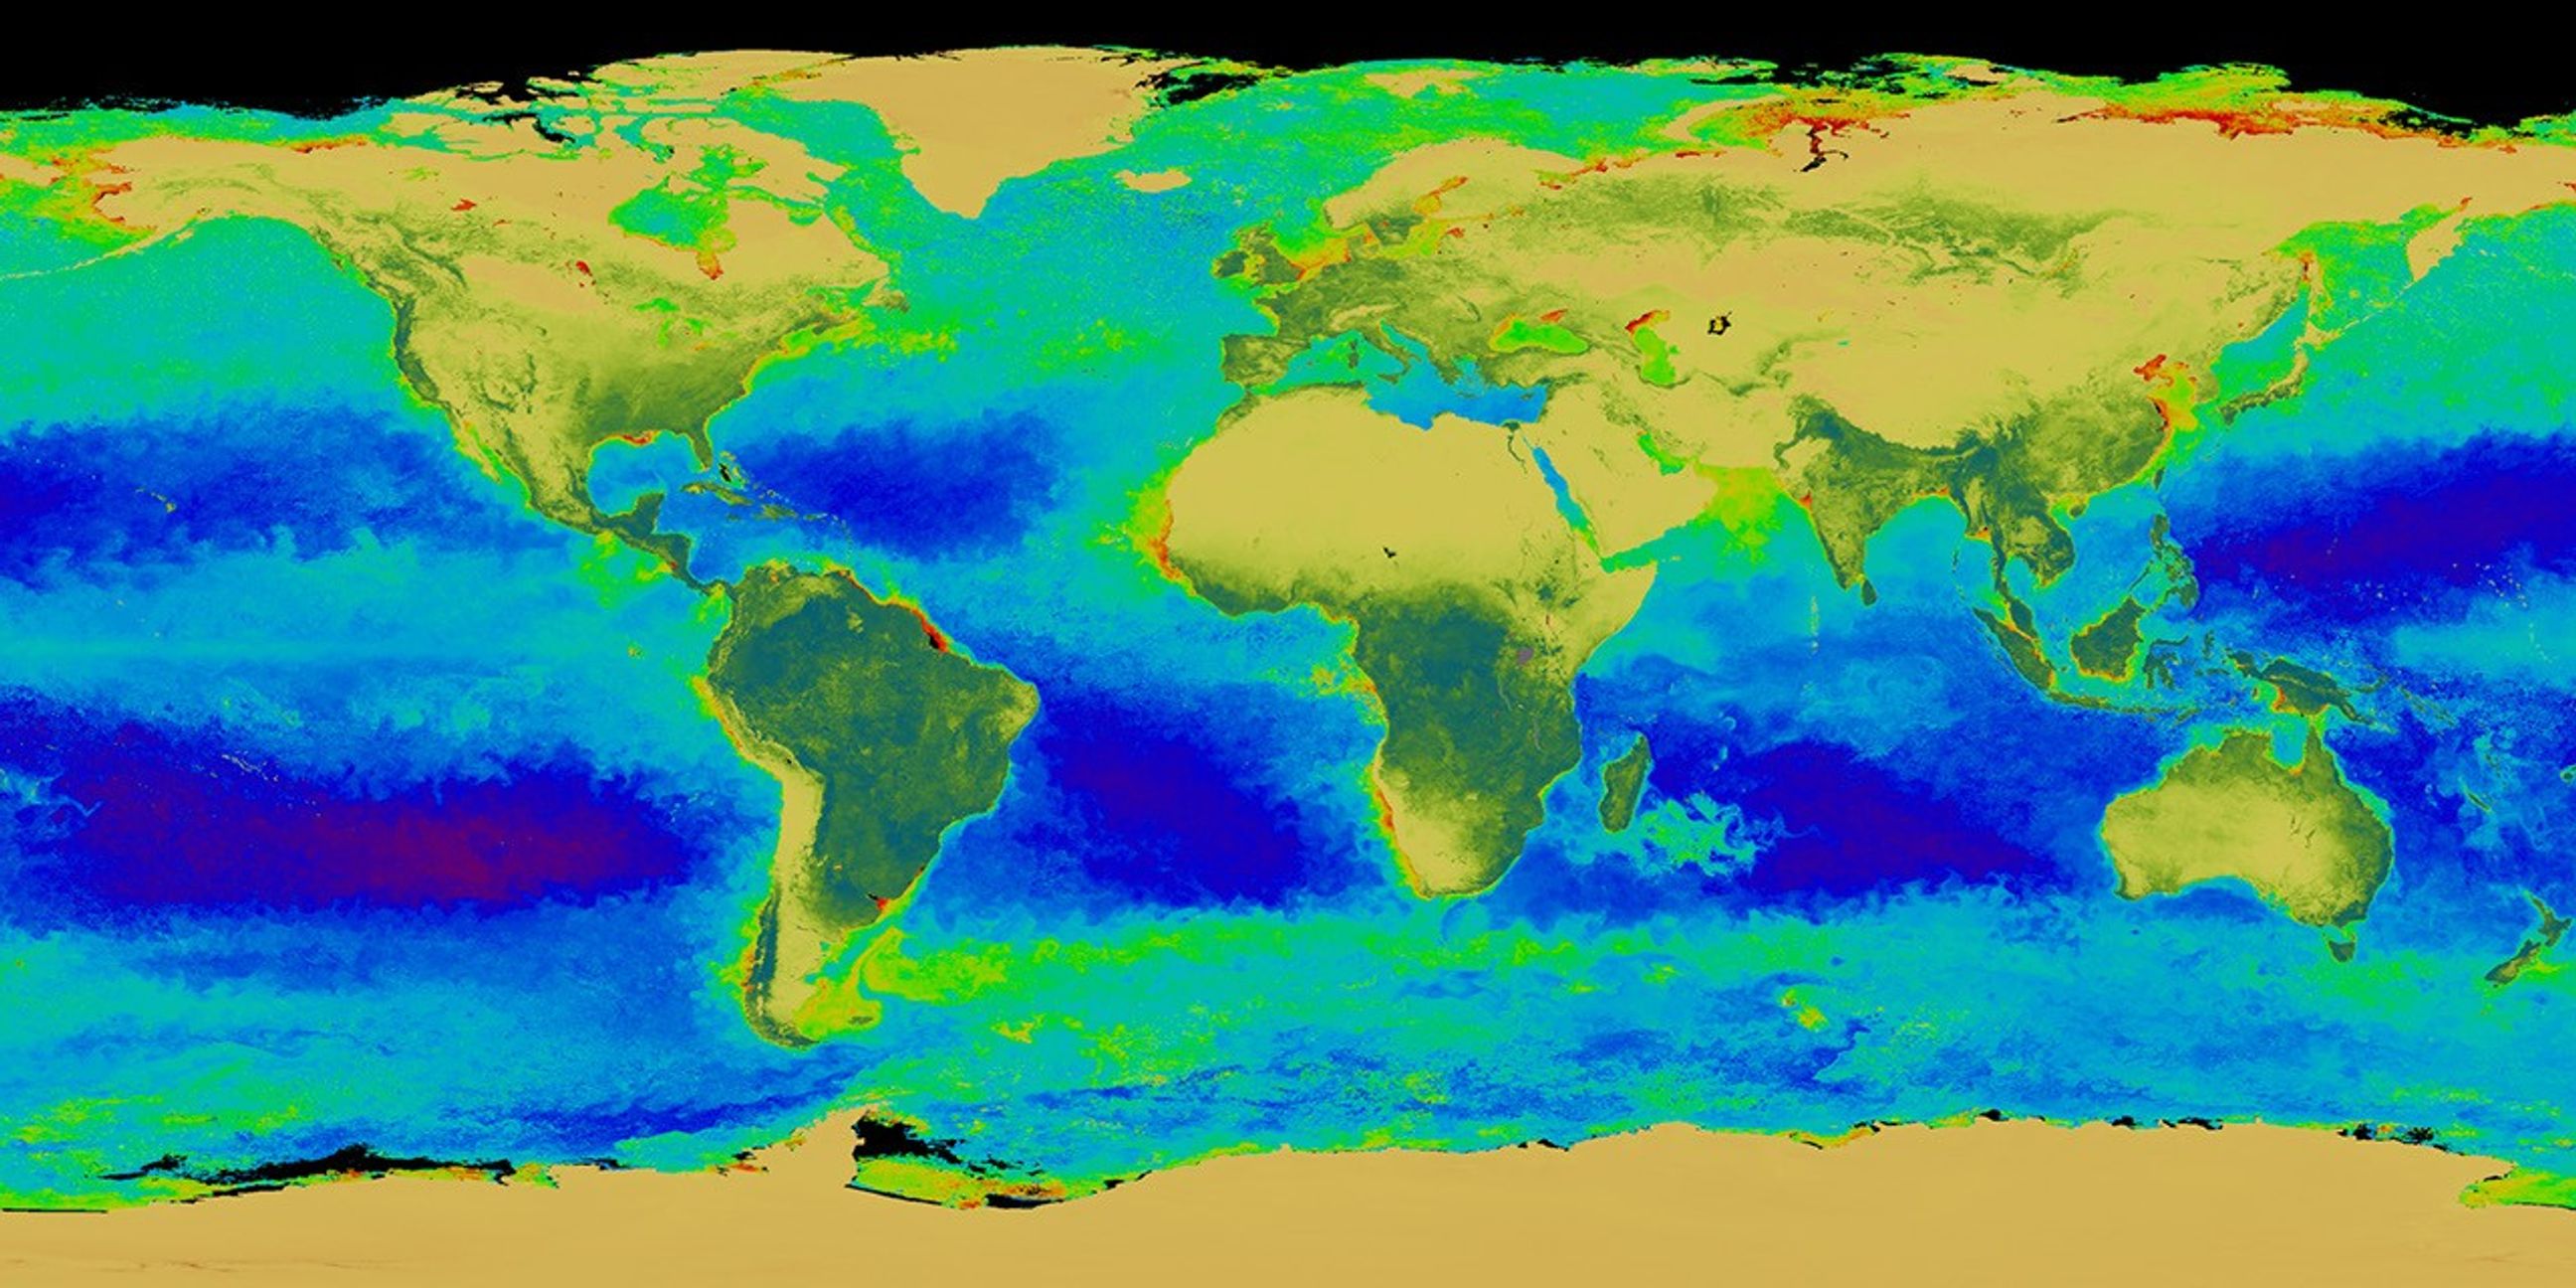
Chlorophyll is the material that allows plant cells to convert sunlight into energy, thusenabling them to grow. It’s a green substance, and thus a good indicator of overallplant health: robust forests and lush lawns and vibrant phytoplankton blooms appeargreen. By measuring chlorophyll concentration, scientists can determine the healthand growth of plants in a given area. By extension, healthy color signatures indicatethe successful use of carbon, the fundamental building block for life. In other words,lots of green indicates lots of chlorophyll; lots of chlorophyll implies healthyphotosynthesis; strong photosynthesis indicates growth, and growth indicatessuccessful use of carbon.
The above image shows the amount of chlorophyll present in the oceans, and theamount of vegetation on land. Purple and blue represent low levels of chlorophyll, whilegreen, yellow, and red indicate progressively higher concentrations. On land, brown pixelsshow areas of little vegetation, while blue-green represents dense vegetation.
For more information, seeThe Colors of Life.
References & Resources
Image and animations provided by the SeaWiFS Project and the NASA GSFC Scientific Visualization Studio