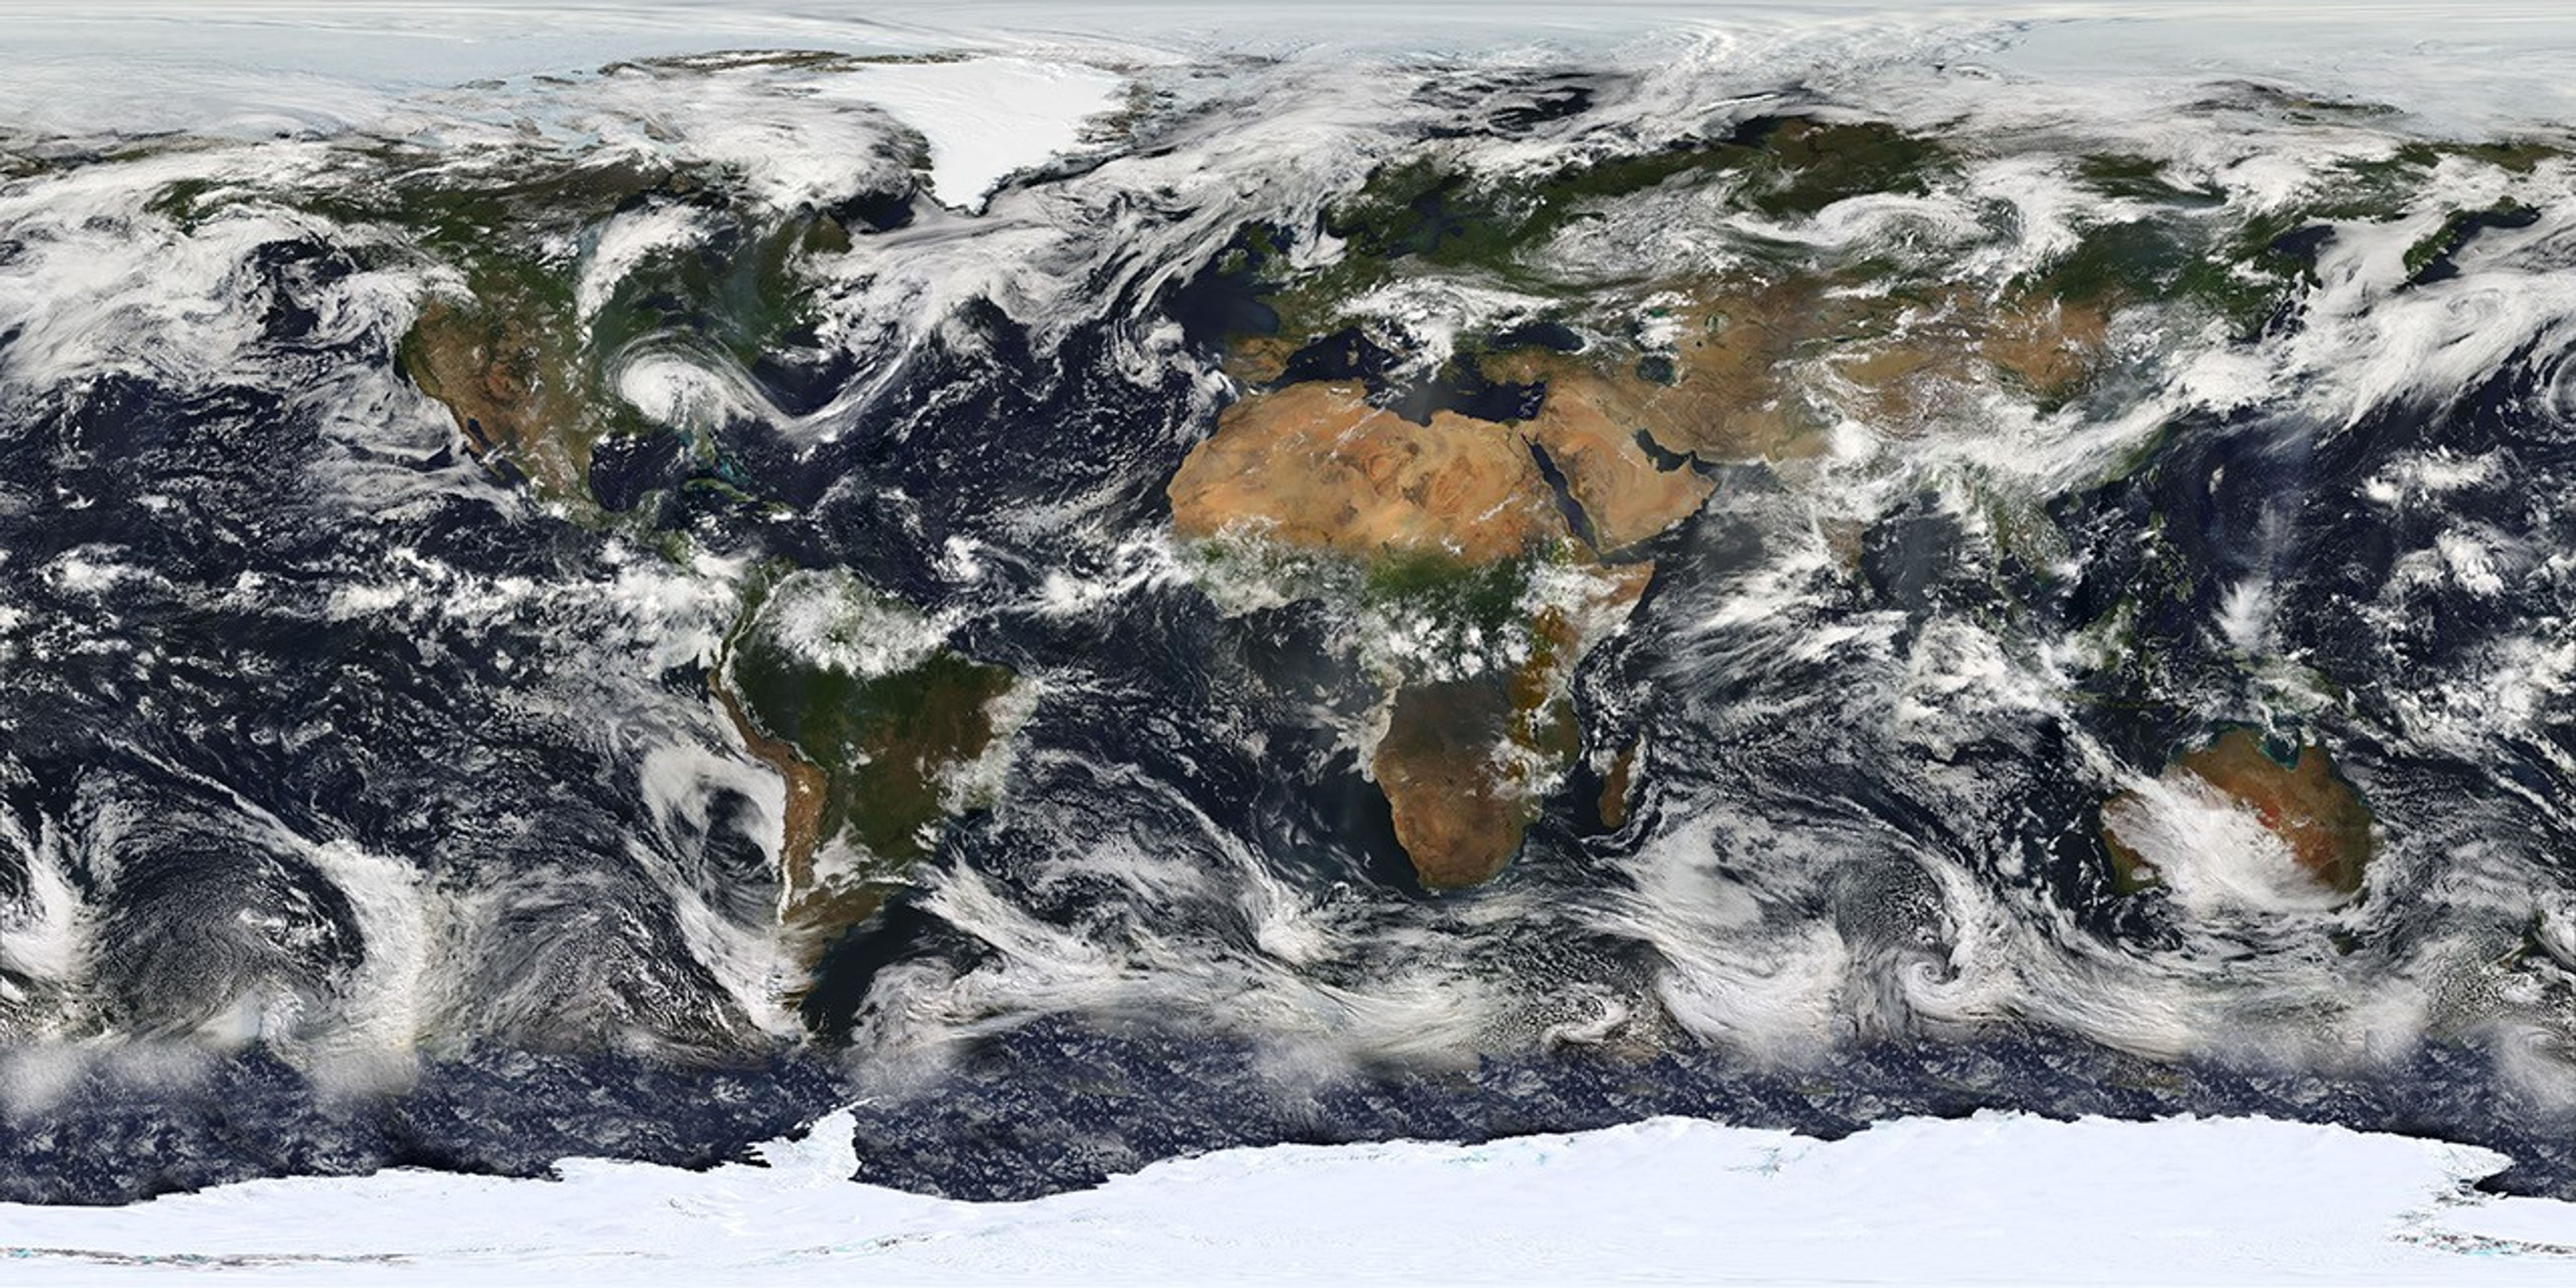


On February 24, 2000, after two months of post-launch testing, sensors on NASA’s Terra satellite began opening their shutters and making their first observations. The mission ushered in a decade of observations from NASA’s Earth Observing System, a coordinated series of satellites that monitor how Earth is changing.
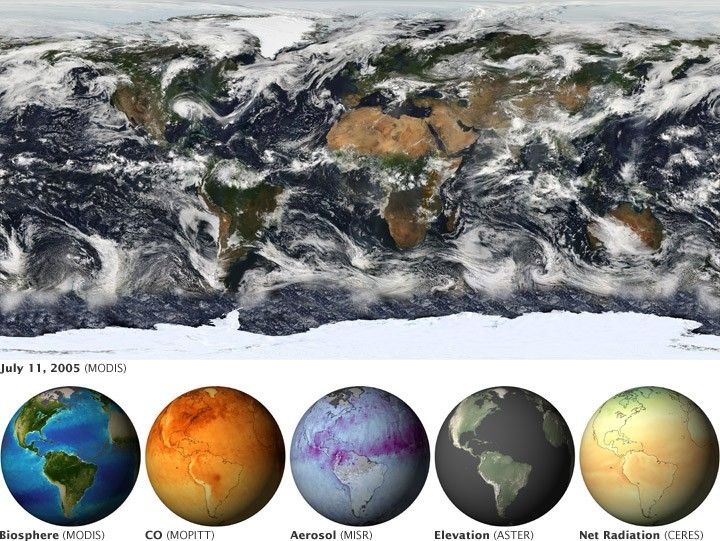
Among the most dramatic views the mission provides are the most detailed, photo-like views of Earth available on a daily basis. The top image is based largely on observations from the Moderate Resolution Imaging Spectroradiometer (MODIS) on July 11, 2005. Small gaps in MODIS’ coverage between overpasses, as well as Antarctica (which is in polar darkness in July), have been filled in using GOES weather satellites and the latest version of the NASA Blue Marble.)
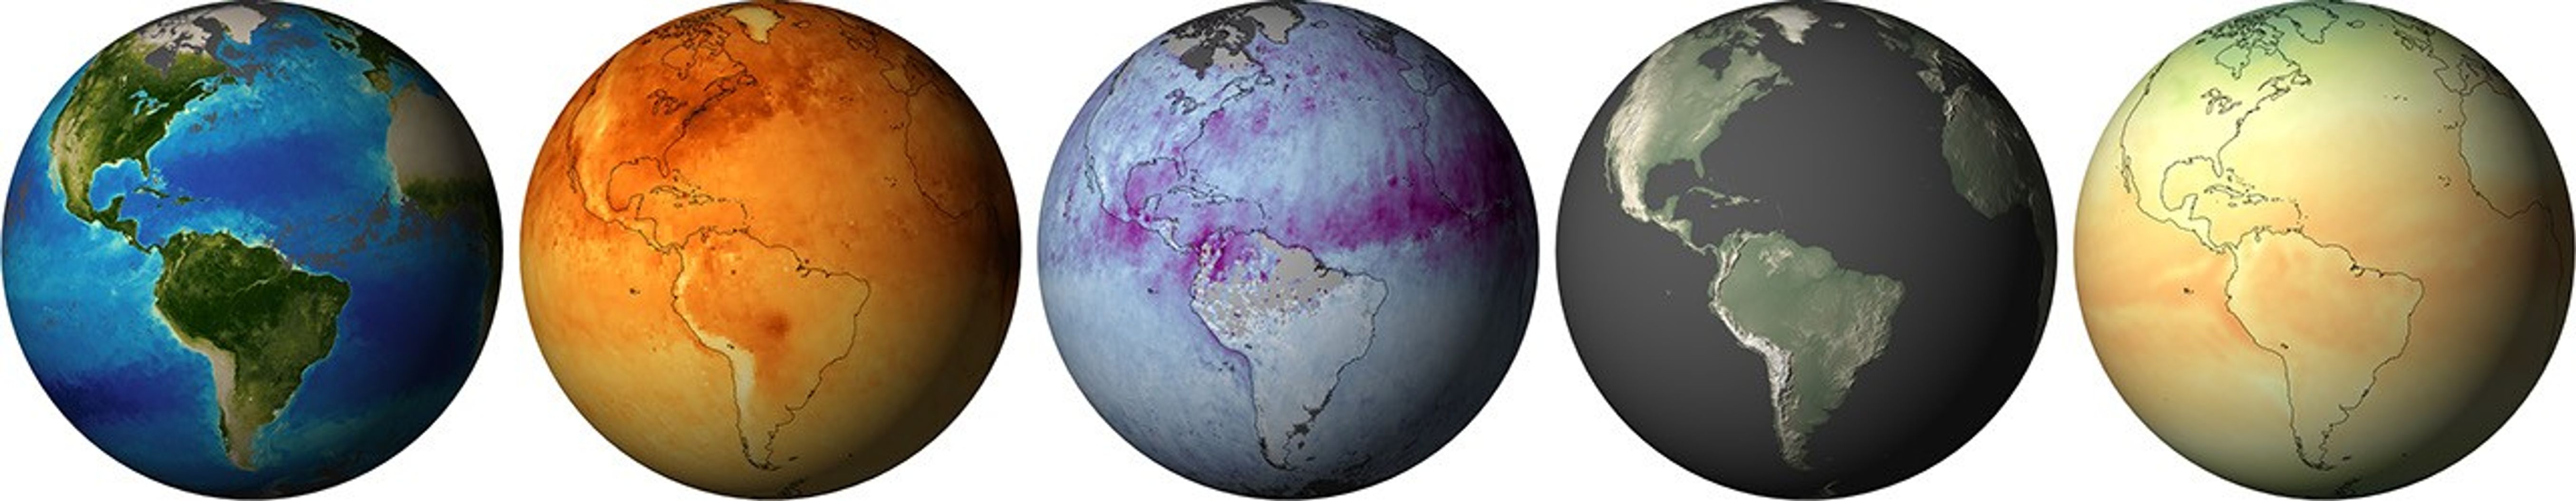
Stunning pictures are only part of Terra’s story, however. The small globes show just a few of the Earth’s “vital signs” that Terra’s five sensors monitor. In all five globes, gray indicates no data.
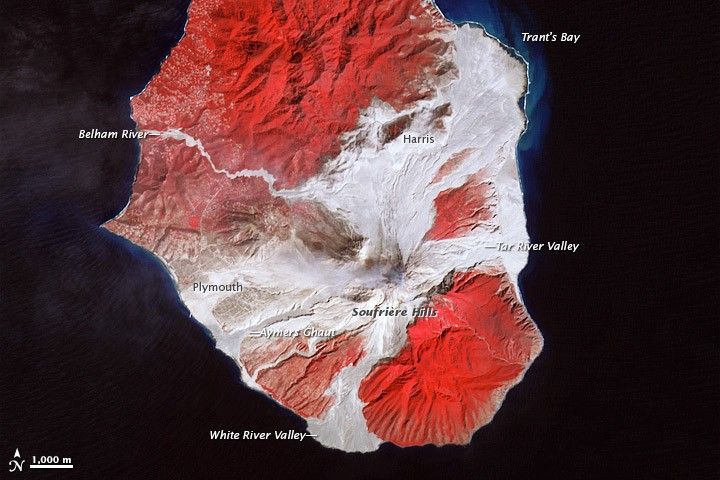
- Biosphere. MODIS tracks photosynthesis by measuring growing vegetation on land and chlorophyll from phytoplankton in the ocean. Dark green on land (June 2009) and light colors in the ocean (March 2009) show the most productive areas.
- Carbon Monoxide. Released by burning plants and fossil fuels, long-lived carbon monoxide (CO) is commonly used to trace the path of pollution as it spread from its source. The Measurements of Pollution in the Troposphere (MOPITT) sensor collected these measurements in June 2009. The highest concentrations of carbon monoxide are dark orange.
- Aerosols. Particles like pollution or dust—aerosols—affect both air quality and climate. Between March and May 2007, the Multi-angle Imaging Spectroradiometer (MISR) measured high aerosol concentrations (purple) from Saharan dust over the Atlantic Ocean and smoke and pollution over the Americas.
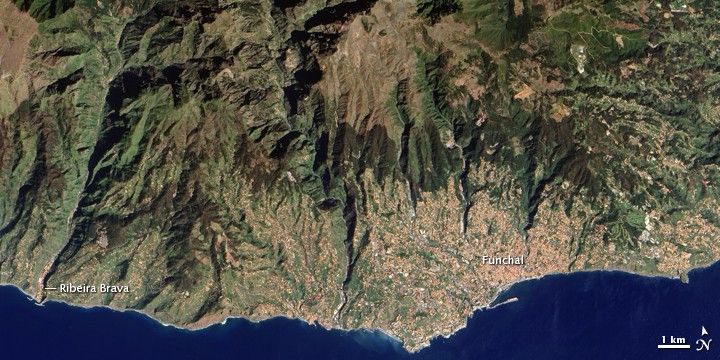
- Elevation. With its stereo imagers, the Advanced Spaceborne Thermal Emission and Reflection Radiometer (ASTER), can take an image of the same ground area from two different angles. This stereo view allowed scientists to generate the most extensive satellite-based topographic model of the Earth to date.
- Net Radiation. The balance between solar energy entering and thermal (heat) energy leaving Earth is the net radiation. This balance determines our planet’s average temperature. These observations from the Clouds and the Earth’s Radiant Energy System (CERES) sensor show net radiation in March 2009. Orange shows energy surpluses (more energy in than out), while green shows energy deficits (more going out than coming in).
Global Maps and Animations
- Vegetation
- Chlorophyll
- Carbon Monoxide
- Aerosols
- Net Radiation
References & Resources
NASA images by Marit Jentoft-Nilsen (image) and Robert Simmon (globes). Based on data from the MODIS, MOPITT, MISR, ASTER, and CERES science teams. Caption by Rebecca Lindsey and Holli Riebeek.