


After abundant rain and flooding in the Mississippi Valley and other regions in 2019, drought returned to much of the United States in 2021-22. From wet to dry, both extremes have implications for soils and the agriculture it supports.
The opposing extremes were detected by NASA satellites. But it was a novel tool—the Soil Moisture Analytics (Crop-CASMA) product—that integrated this satellite data into a format that was particularly useful to people. With Crop-CASMA’s high-resolution, timely information on soil moisture, farmers and agriculture managers could track the areas of high and low moisture more closely.
The animations on this page, based on data from Crop-CASMA, show soil moisture anomalies in the top 10 centimeters (4 inches) of the ground across the conterminous United States. This surface layer, or topsoil, holds water used by plants in their earliest stages, from sprouts to seedlings. Too little or too much water during these phases of growth can mean trouble for crops.
Winter and spring 2019 delivered too much water, particularly in the Mississippi and Missouri River watersheds. Rapidly melting snow and ice, along with a barrage of storms, led to flash floods across Midwestern states. Meanwhile, the United States as a whole saw its soggiest 12 months in 124 years of modern recordkeeping. The wet conditions forced many farmers to delay planting. Other farmers did not plant at all.
The abundance of moisture is apparent in the first animation (March through July 2019). Darker blue areas indicate where Crop-CASMA found more water than average for each date. Each pixel represents 9 square kilometers (3 square miles). This resolution allows farmers and resource managers to observe soil moisture conditions at the scale of towns and counties instead of states.
Areas of above-average moisture are almost always flashing across some part of the landscape, which becomes evident in the second animation (March 2021 through June 2022). For instance, in August 2021, category-4 Hurricane Ida drenched the U.S. East. Putting the Crop-CASMA dataset to work, the USDA’s National Agricultural Statistics Service (NASS) was able to determine where crops might be damaged.
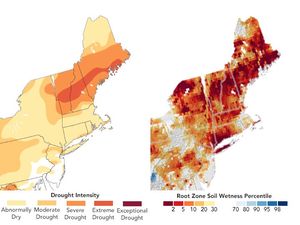
But amid the fleeting weather events of the past eighteen months, notice the vast areas where the soil became and stayed drier than normal (brown). By summer 2021, drought parched much of the United States from the Rocky Mountains to the Pacific Coast. The dryness extended down into the root zone—the top meter (3 feet) of soil. This layer (not pictured) holds the water used by more established plants, making it an important component of crop health later in the growing season. Unusually dry topsoil and root-zone soil are among the key indicators of drought.
In early August 2021, USDA NASS reported that 56 percent of the total cropland in California had significantly less moisture in the root zone than what is required for normal plant development. The analysis stated: “Growth has been stopped, or nearly so, and plants are showing visible signs of moisture stress. Under these conditions, plants will quickly suffer irreparable damage.”
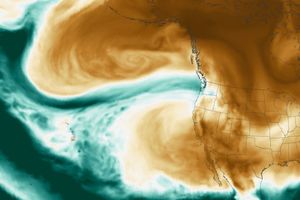
Compared to groundwater, the surface layers respond quickly to weather events. Even after an atmospheric river brought historic rain and snowfall to the West Coast in late October 2021, soils quickly dried again. Then California saw its driest January, February, and March on record in 2022, as nearly all of the state fell into severe to extreme drought.
Analyses of soil conditions, along with Crop-CASMA’s web GIS tool, can help farmers and resource managers to time the planting and irrigation of crops and forecast yields, particularly as drought continues this year. By the end of June 2022, almost half of the United States was in moderate to extreme drought; just 3 percent was severely to extremely wet.
References & Resources
- Center for Spatial Information Science and Systems (2021) Crop-CASMA Userâs Guide. Accessed July 28, 2022.
- Cooley, S., et al. (2022) Paths to research-driven decision making in the realms of environment and water. Technology in Society, 70 (101994).
- Drought.gov Crop Condition and Soil Moisture Analytics Tool (Crop-CASMA). Accessed July 28, 2022.
- NASA Earth Observatory (2021) 2021 Drought in North America.
- NASA Earth Observatory Blogs: Earth Matters (2021, July 13) NASA Supports Drought Resilience in the American West.
- NASA Earth Observatory (2019) Flooding In the Mississippi Watershed 2019.
- NASA Earth Observatory (2019, May 27) Record-Setting Precipitation Leaves U.S. Soils Soggy.
- NASA Earth Observatory (2019, March 19) Historic Floods Inundate Nebraska.
- NASA Earth Observatory (2019, March 15) Late-Winter Storm Blasts the Great Plains.
- NASA Features (2021, March 8) NASA Data Powers New USDA Soil Moisture Portal. Accessed July 28, 2022.
- NOAA National Centers for Environmental Information (2022, June) June 2022 Drought Report. Accessed July 28, 2022.
- USDA National Agricultural Statistics Service (2021, September 3) Hurricane Ida, August 2021. Accessed July 28, 2022.
- USDA National Agricultural Statistics Service (2021) Western U.S. Drought and Extreme Heat Event (July/August 2021). Accessed July 28, 2022.
- Ventura County Star (2022, July 1) Southern California residents cut water in drought of âepic proportionsâ. Accessed July 28, 2022.