


- Quicktime (.mov) format (472 KB)
- MPEG-1 (.mpg) format (824 KB)
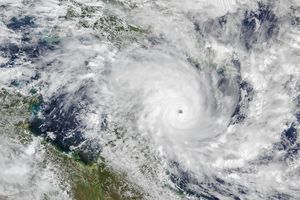
Tropical Cyclone Fay first developed into a tropical depression on the 16th of March 2004in the Timor Sea west of Bathurst Island off the northern coast ofAustralia. Just twelve hours after becoming a depression, Fay became anamed tropical storm with winds estimated at 35 knots (40 mph). Fromthere, the system took a general west southwestward track parallel tothe northwestern coastline of Australia. On the 18th of March, Fay wasupgraded to a Category 1 cyclone with maximum sustained winds estimatedat 65 knots (75 mph). Fay then continued to steadily gain in strengthbecoming a Category 2 cyclone on the 19th, a Category 3 cyclone on the20th, and a powerful Category 4 cyclone on the 21st with maximum sustainedwinds reaching an estimated 120 knots (138 mph). Fay is expected now totake a more southerly track ahead of an advancing trough and threaten thecoast of Western Australia.
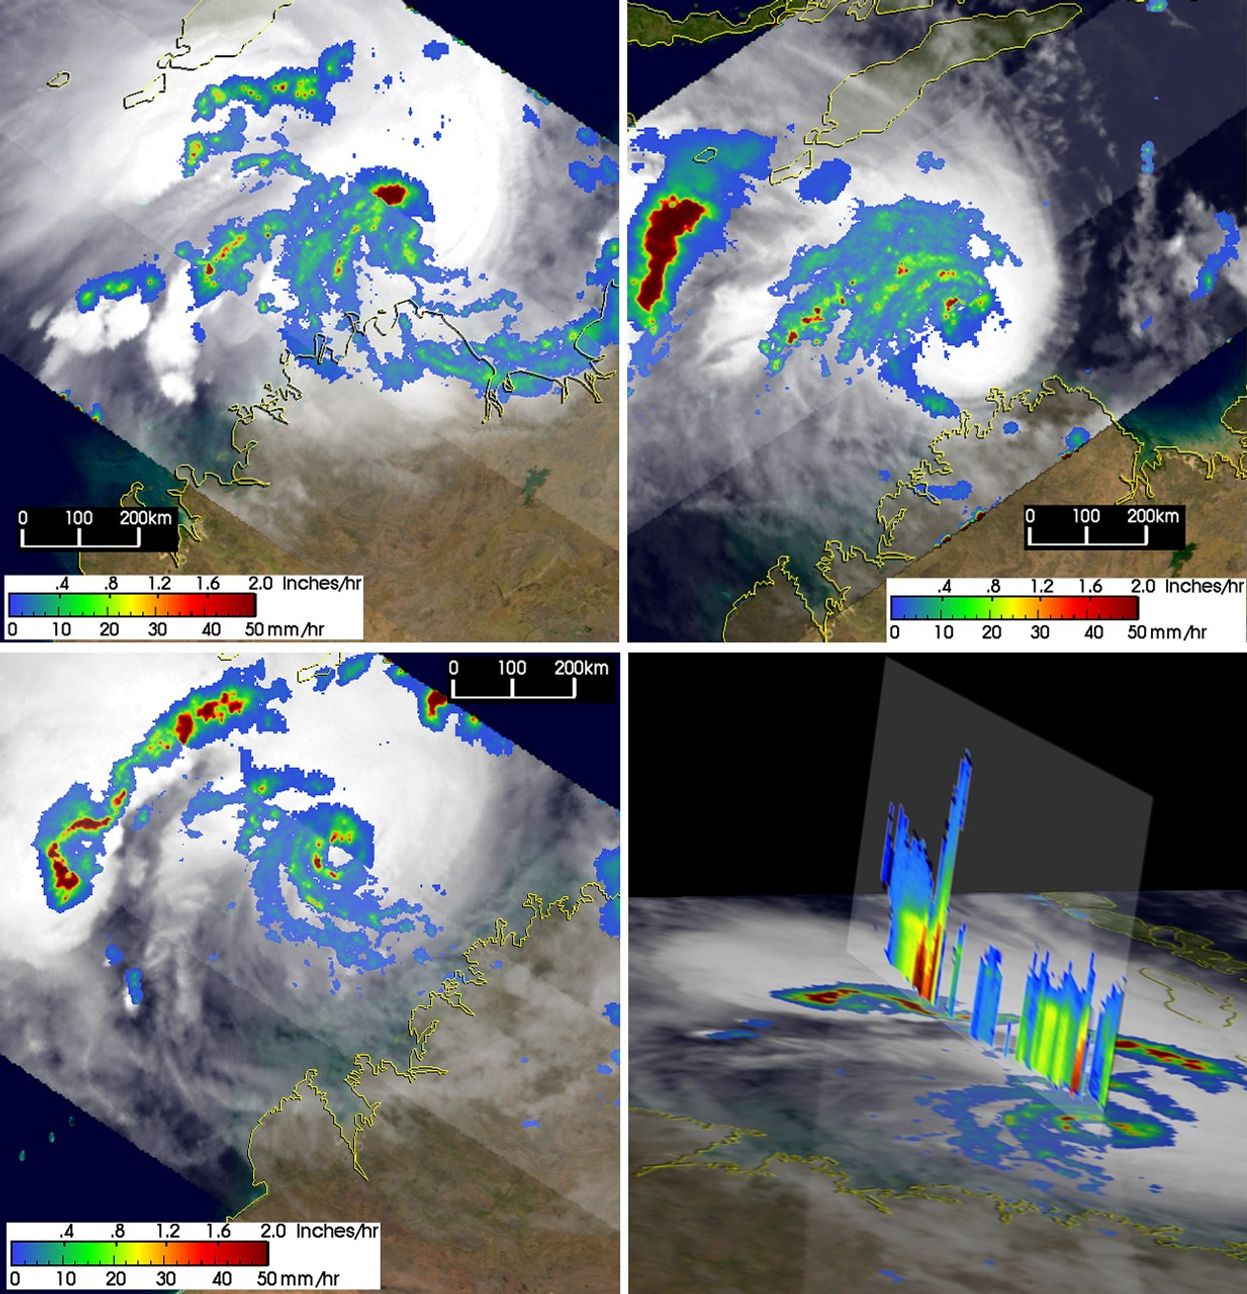
The Tropical Rainfall Measuring Mission (TRMM) satellite has monitoredthe development of Fay capturing several unique images of the storm asit grew into a major cyclone. The first image (top left) was taken at 21:11 UTC on17 March 2004 (5:11 am Australian WST 18 March). It shows the horizontaldistribution of rain rates as seen from above by the TRMM satellite.Rain rates in the center swath are from the TRMM Precipitation Radar(PR), the first and only precipitation radar in space, while rain ratesin the outer swath are from the TRMM Microwave Imager (TMI). Theserain rates are overlaid on infrared (IR) data from the TRMM VisibleInfrared Scanner (VIRS). At the time of this first image, Fay was stilla tropical storm with winds estimated at 45 knots (52 mph). TRMM revealsthat the storm is still organizing with no evidence of an eye. However,a sizeable area of intense 2-inch-per-hour rain rates (darker red area)exists near the center of circulation, and the heating generated fromthis rainfall can help to drive the storm's circulation and make itstronger. The next image taken over a day later at 06:05 UTC on the 19th (top right)shows that Fay had become much better organized. The banding evident inthe moderate intensity rain field (green arcs) is more pronounced, and aneye has started to form in the southeast portion of the main rain area.An area of intense rain rates (darker reds) is embedded in the northwestquadrant of the eyewall. Fay was at the time a Category 1 cyclone withsustained winds of 75 knots (86 mph).
The last two images were taken at 20:00 UTC on March 20. Fay was now aCategory 3 cyclone with sustained winds of 100 knots (115 mph). The eyeof the storm is now readily apparent with moderate (green) to heavy (red)rain rates in the northern, western and southern portions of the eyewall.The final image (bottom right) shows a vertical slice through the center of Fay. Itshows the heavy rain (red area) in the western eyewall as well as intenserain (dark reds) associated with deep convection (vertical blue/greentower) in an outer rainband well west of the center.
TRMM is a joint mission between NASA and the Japanese space agency JAXA.
References & Resources
Images produced by Hal Pierce (SSAI/NASA GSFC) and caption by Steve Lang (SSAI/NASA GSFC).