


World of Change: Antarctic Sea Ice
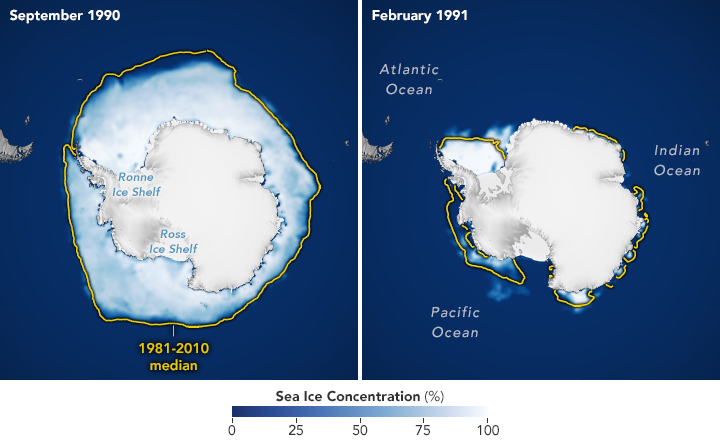


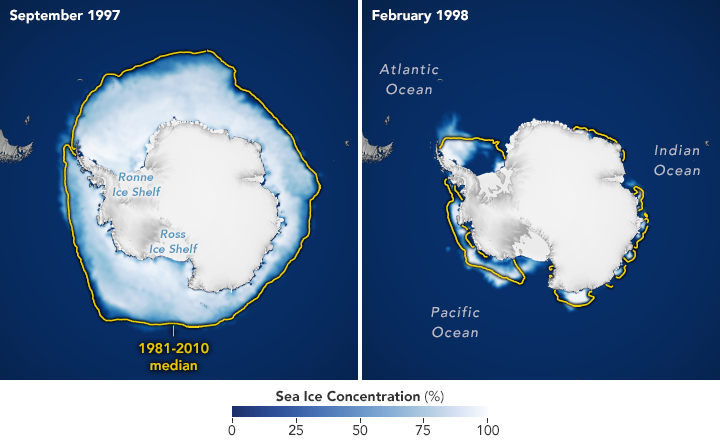

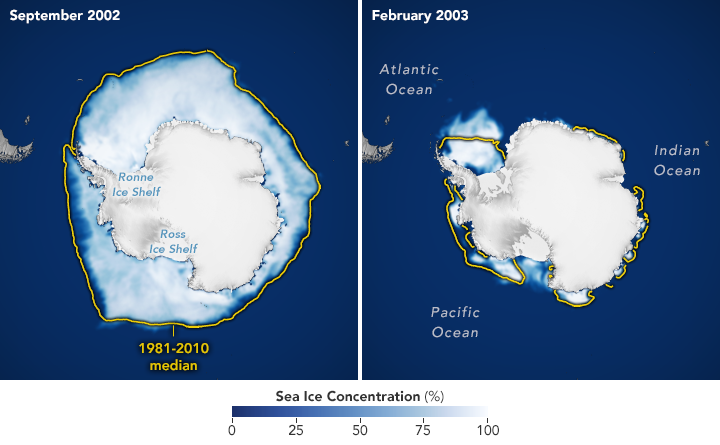


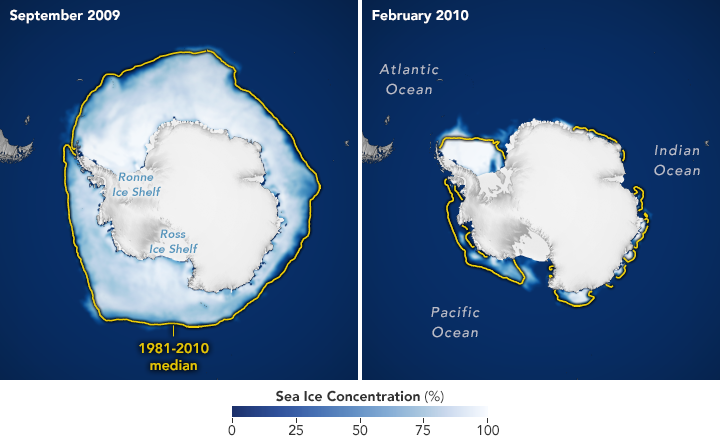


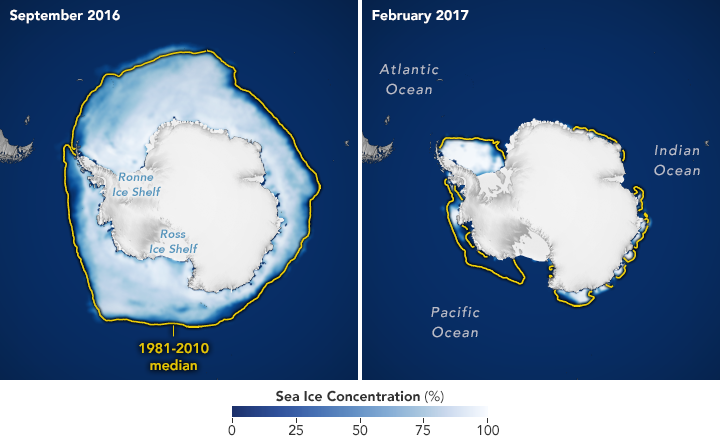

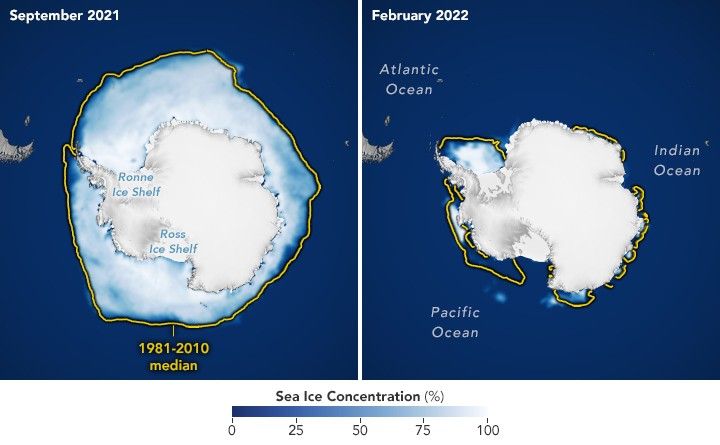
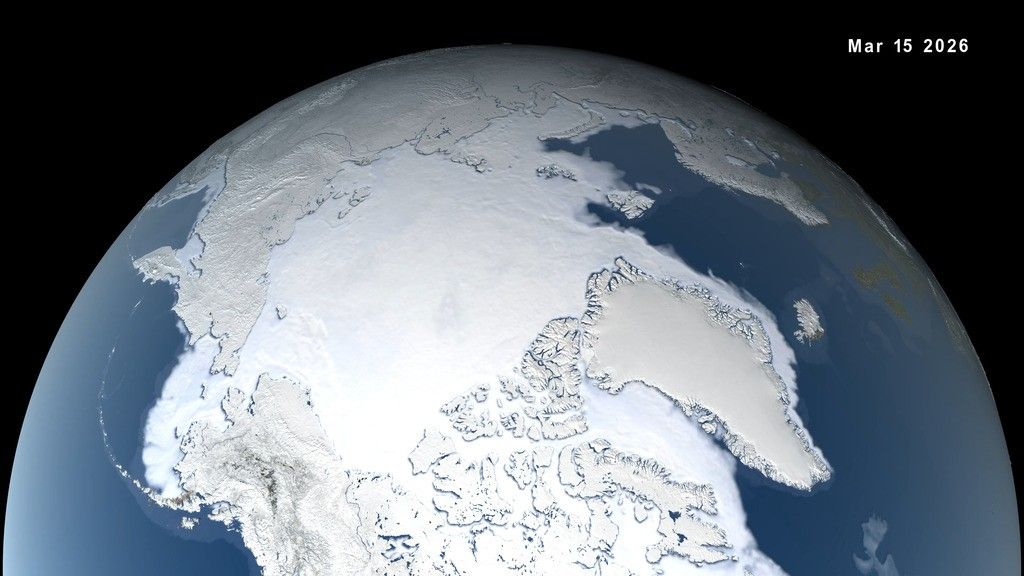
Unlike the Arctic—an ocean basin surrounded by land—the Antarctic is a large continent surrounded by an ocean. Because of this geography, sea ice has more room to expand in the winter. But that ice also stretches into warmer latitudes, leading to more melting in summer. Antarctic sea ice peaks in September (the end of Southern Hemisphere winter) and usually retreats to a minimum in February.
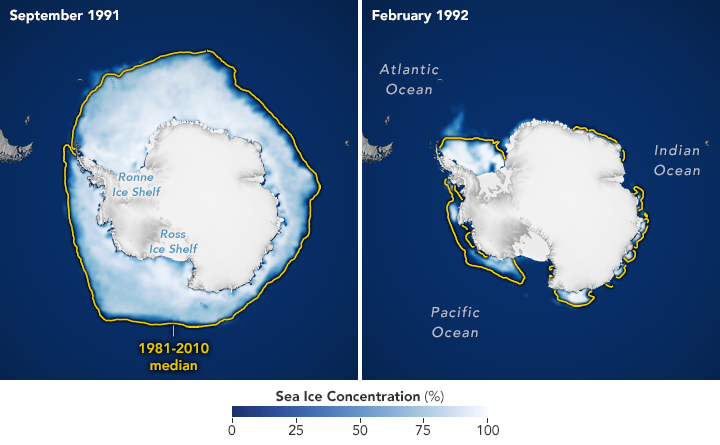
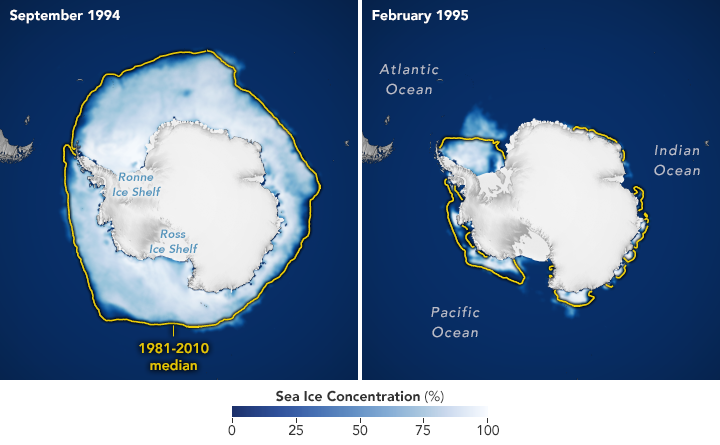
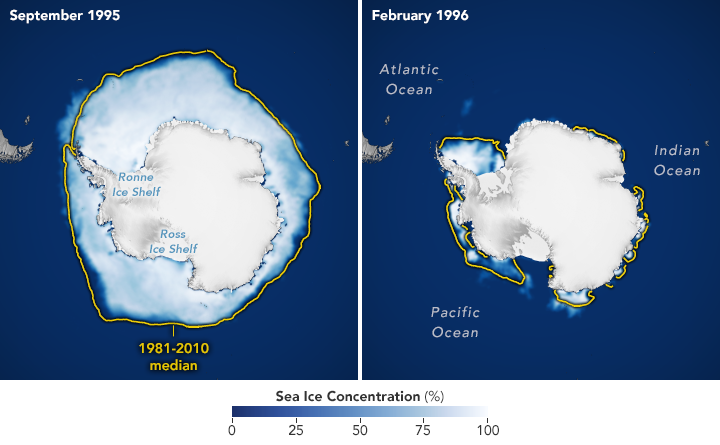
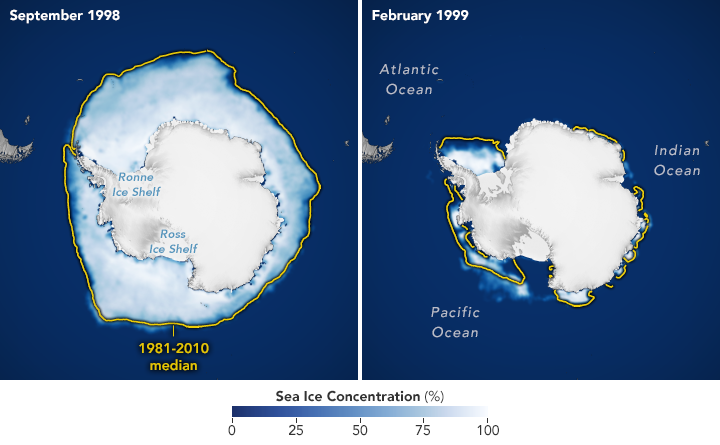
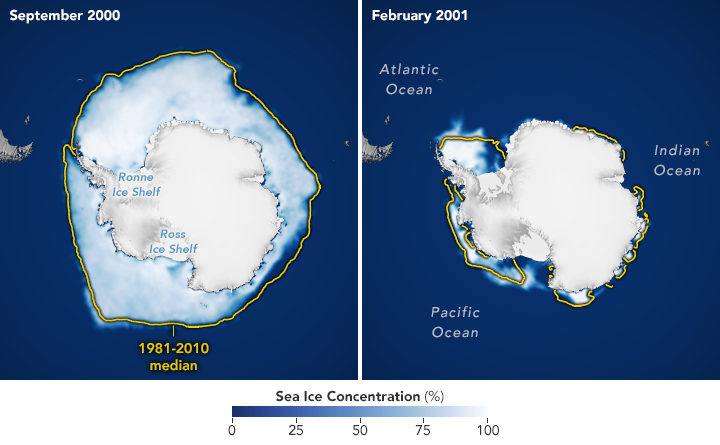
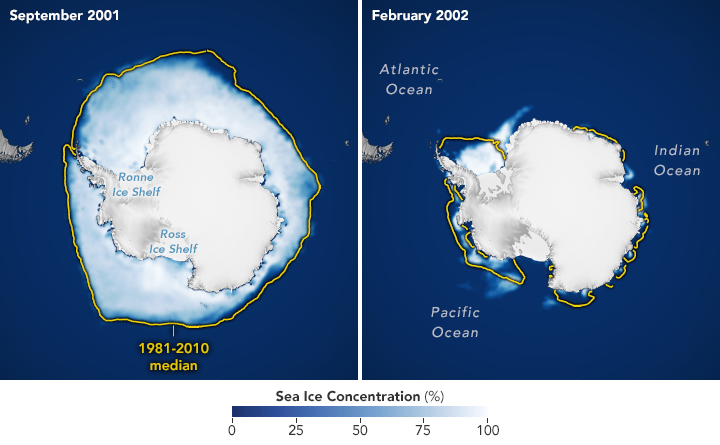
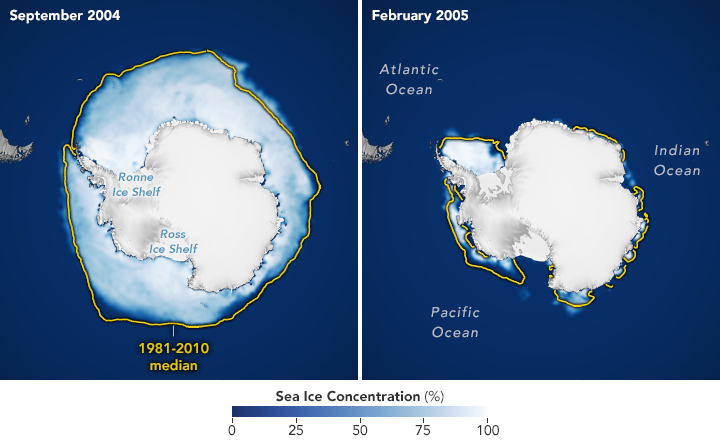
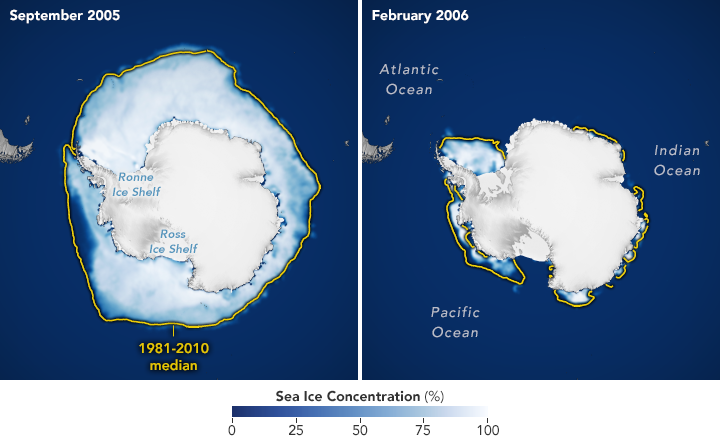
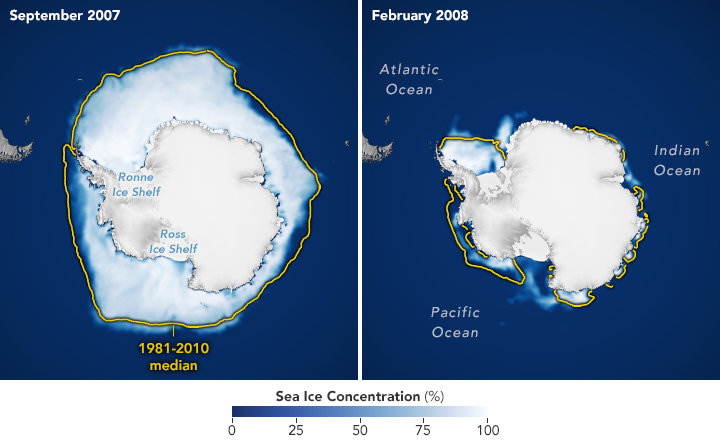
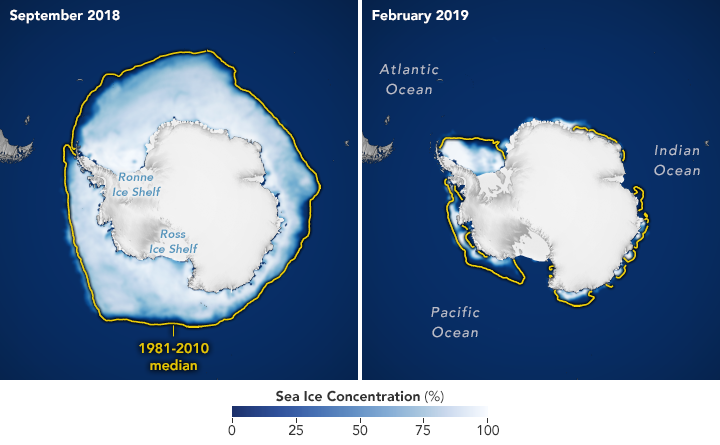
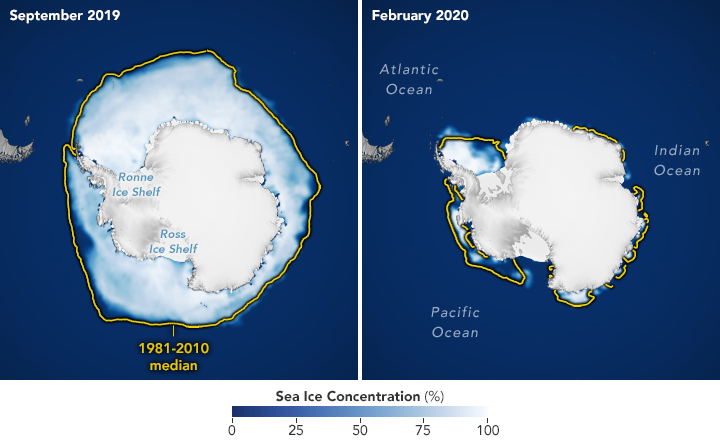
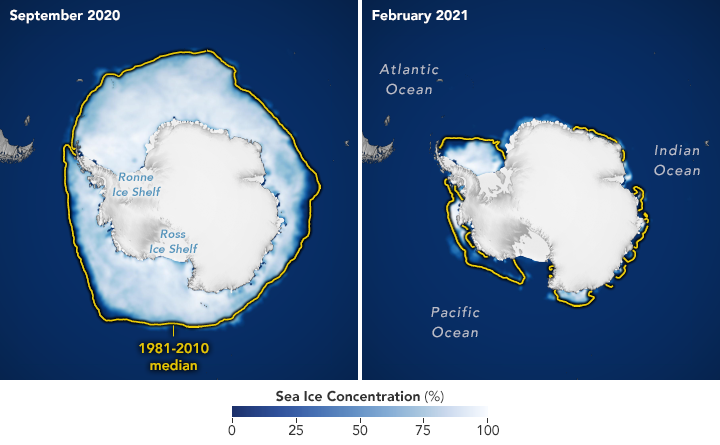
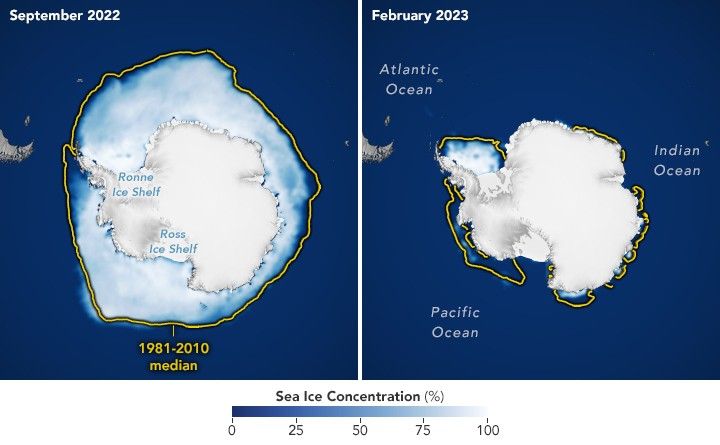
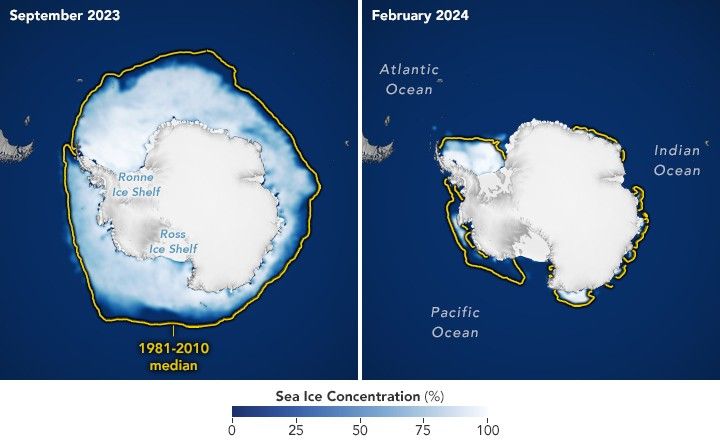
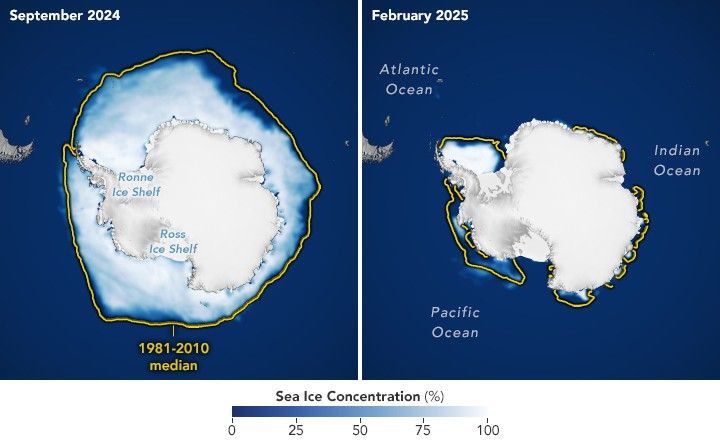
These image pairs show the average concentration of Antarctic sea ice for the month of September (left) and the following February (right) from September 1990 to February 2025. Opaque white areas indicate the greatest concentration, and dark blue areas are open water. All icy areas pictured here have an ice concentration of at least 15 percent (the minimum at which space-based measurements give a reliable measure) and cover a total area that scientists refer to as the “ice extent.”
The yellow outline shows the median sea ice extent in September and February from 1981 to 2010. Extent is the total area in which the ice concentration is at least 15 percent. The median is the middle value; that is, half of the extents were larger than the line, and half were smaller.

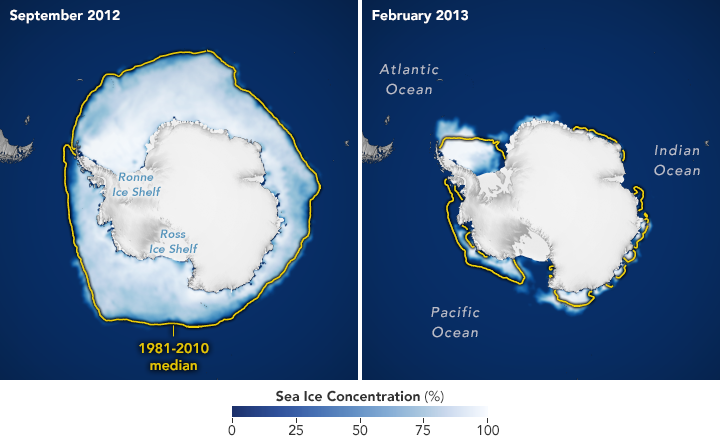
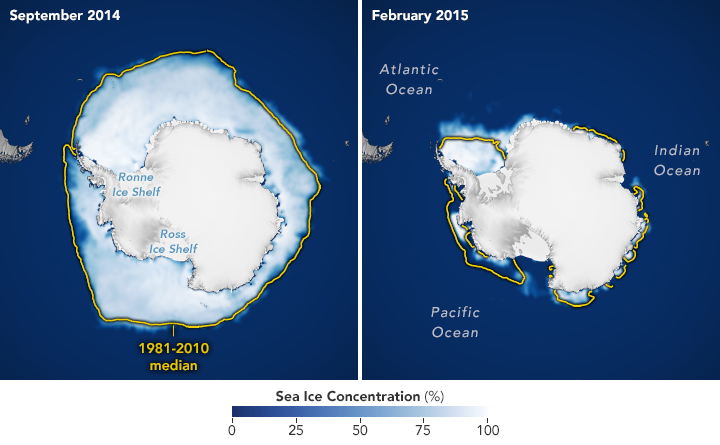
From the start of satellite observations in 1979 to 2014, total Antarctic sea ice increased by about 1 percent per decade. Whether the increase was a sign of meaningful change is uncertain because ice extents vary considerably from year to year around Antarctica. For three consecutive Septembers from 2012 to 2014, satellites observed new record highs for winter sea ice extent. These highs occurred while the Arctic was seeing record lows.
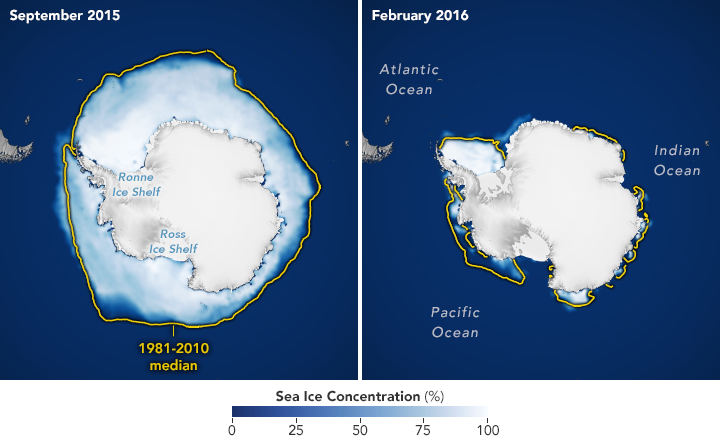
The climb came to an end in 2015, and significant decreases in sea ice around Antarctica started to occur in 2016. There have since been years with small rebounds, but overall, Antarctic sea ice coverage has largely remained lower than normal with several years reaching record lows. Scientists will continue to observe the area each year to find out if the decline is part of a long-term change or a statistical fluctuation.
The time series above is based on data collected by microwave sensors aboard the Nimbus-7 satellite, jointly operated by NASA and the National Oceanic and Atmospheric Administration (NOAA), along with satellites in the Defense Meteorological Satellite Program. The sensors measure microwave energy radiated from the Earth’s surface (sea ice and open water emit microwaves differently), which can be used to map sea ice concentrations.
Further Reading
- NASA Earth Observatory (2017, March 23) Polar Sea Ice at Record Lows. Accessed March 26, 2025.
- NASA Earth Observatory (2016, September 16) Sea Ice. Accessed March 26, 2025.
- NASA Earth Observatory (2015, February 11) Despite Antarctic Gains, Global Sea Ice is Shrinking. Accessed March 26, 2025.
- NOAA Climate (2021, March 26) Understanding climate: Antarctic sea ice extent. Accessed April 28, 2021.
- NSIDC State of the Cryosphere. Accessed February 18, 2020.
- NSIDC Quick Facts: What is sea ice? Accessed March 25, 2025.
- NSIDC Sea Ice Index. Accessed February 18, 2020.
- Parkinson, C.L. (2014) Global Sea Ice Coverage from Satellite Data: Annual Cycle and 35-Yr Trends. Journal of Climate, 27, 9377–9382.


