


World of Change: Drought Cycles in Australia
Drought is a frequent visitor in Australia. The Australian Bureau of Meteorology describes the typical rainfall over much of the continent as “not only low, but highly erratic.” Over the last decade, drought has dominated Australian weather. Between 2007 and 2009, the southeastern states of Victoria and New South Wales endured three years of drought, that broke only when La Niña rains drenched the region in late 2010.
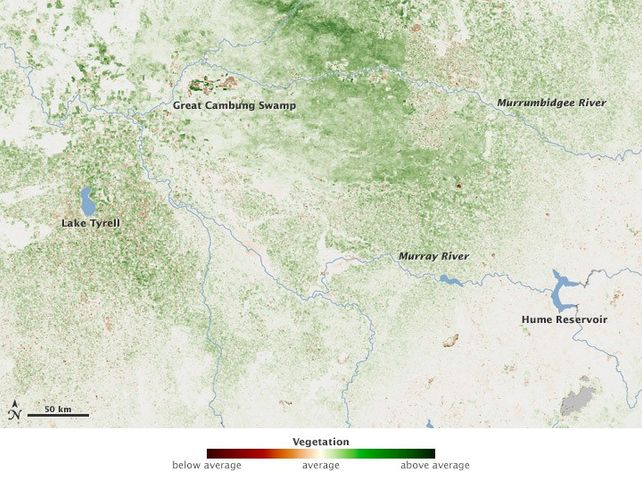
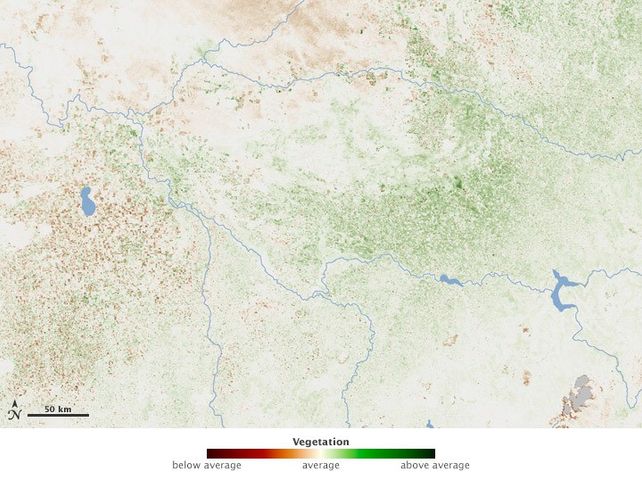
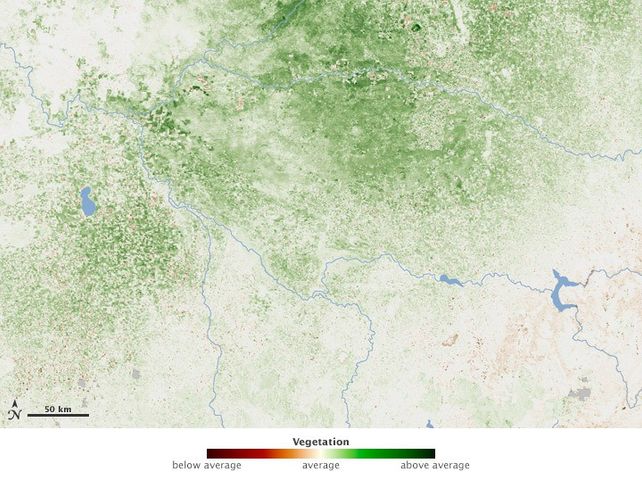
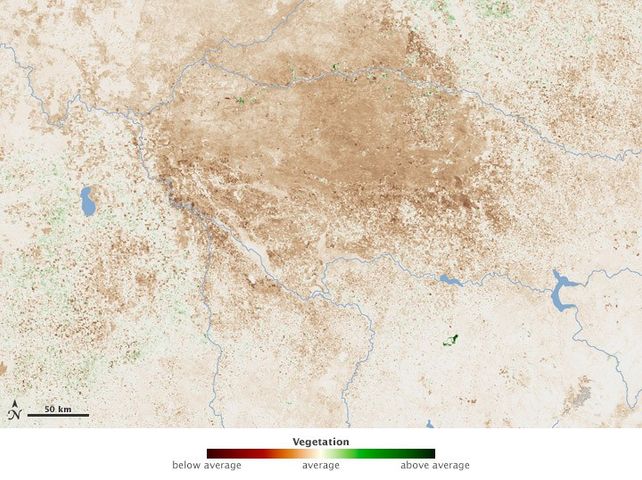
The multi-year drought was devastating for farmers. These satellite-based vegetation images document what farmers and ranchers have had to contend with over the past decade. The images are centered on the agricultural areas near the Murray River—Australia’s largest—and between Hume Reservoir and Lake Tyrrell. The series shows growing conditions for a 16-day period in the middle of each September from 2000 through 2011 compared to the average mid-September conditions over the decade. Places where the amount and/or health of vegetation was above the average are green; average areas are off-white; and places where vegetation growth was below average are brown.
The area in the images is part of Australia’s “Wheatbelt,” and mid-September is the height of the growing season for cereal grains, including wheat, barley, and oats. Fields have a fairly distinct appearance, creating a speckled patchwork of geometric shapes. Areas where the vegetation appears smoothly continuous (such as in the top center, east of the Great Cambung Swamp) are more likely to be pasture or natural vegetation. The lower right corner is occupied by the mountain ranges whose streams deliver much of the Murray River’s volume.
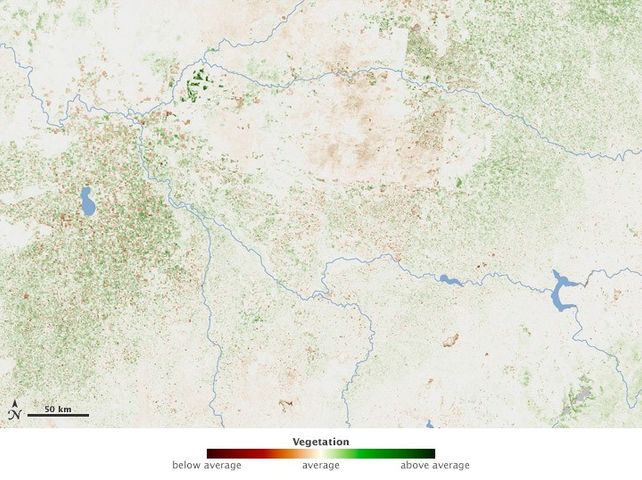
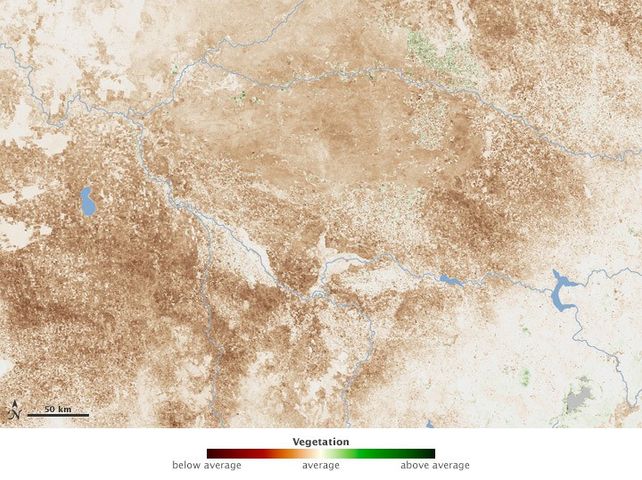
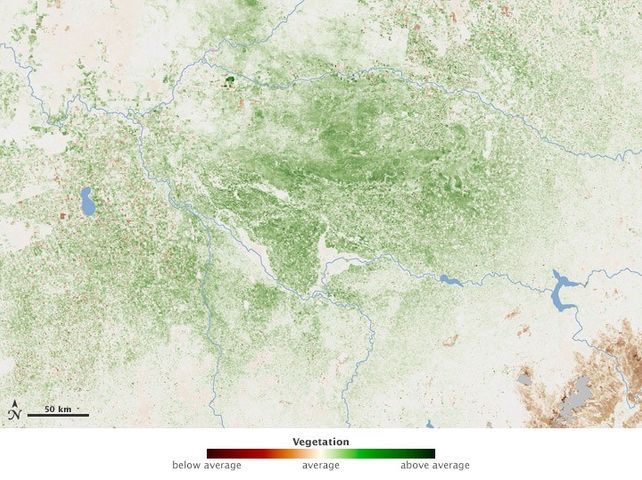
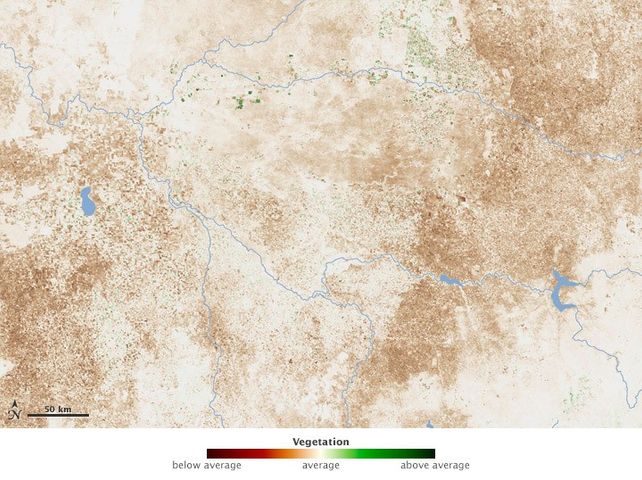
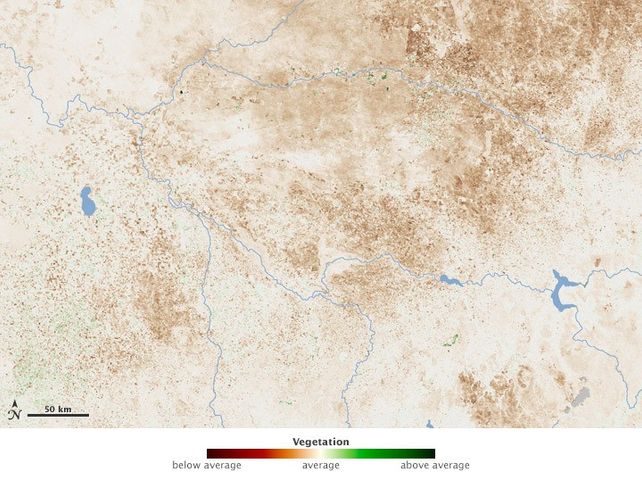
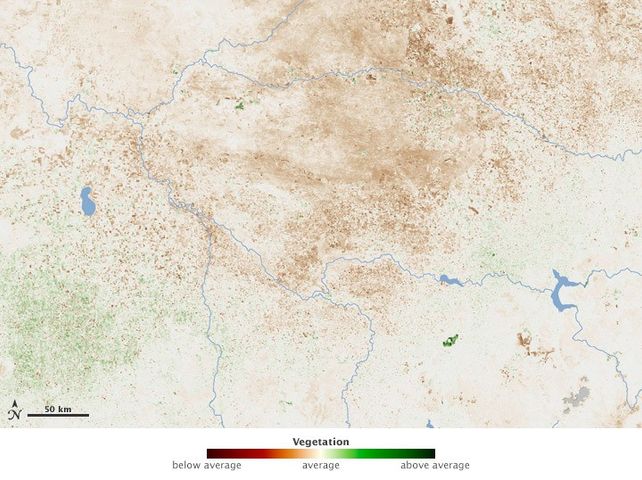
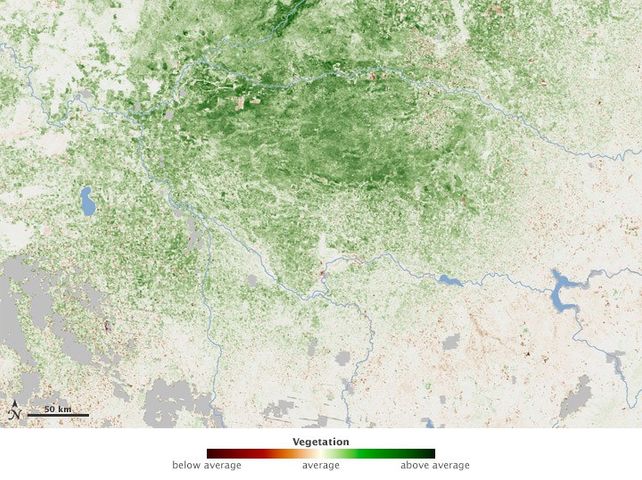
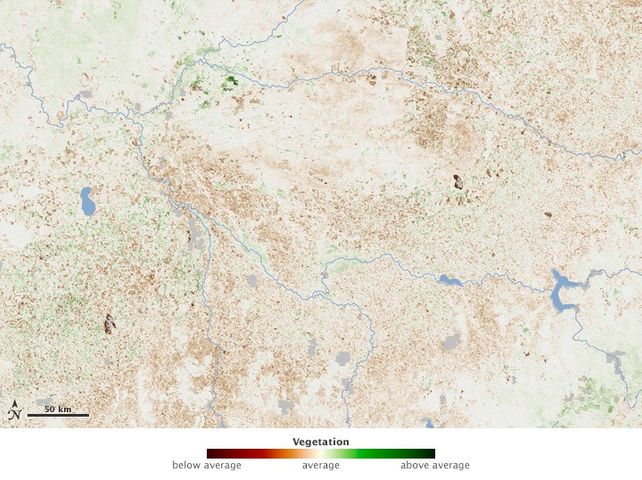
The decade’s drought history is obvious in the cycling between years where the images are dominated by shades of green (2000, 2003, 2005, 2010) and years dominated by shades of brown (2002, 2006, 2007, 2008, 2009, 2011). While the overall pattern in any given year is generally unmistakable, there are localized differences in how crops responded to the climate each year. These differences could have numerous causes, from local rainfall to variability in the drought-tolerance of an area’s predominant crop. At the individual field level, a brown or green patch in a single year could indicate a crop that was struggling or flourishing, but it could also reflect a management decision to plant or harvest at a different time, or to leave a field fallow.
Another pattern that emerges is the dramatic difference in the ability of crops versus natural vegetation to withstand dry years. Scattered across the “Wheatbelt” are small pockets of native landscapes protected in parks and preserves. Among these protected areas is Wyperfield National Park; two arms of the park stretch into the image west of Lake Tyrrell. In 2002, as the countryside plunged into drought, the natural vegetation in the park remained near average (neutral colors). The forested mountains south and east of Hume Reservoir turned just slightly brown, a far cry from the deep browns of the croplands to the north and west. Later in the series (2006-2009), even natural areas begin to appear more brown than neutral, although the conditions were not as far below average as they were in cropland.
The images in this series are based on vegetation observations collected by the Moderate Resolution Imaging Spectroradiometer (MODIS) on NASA’s Terra satellite, which completed its eleventh year in orbit in December 2011. Observations from Terra and its sister satellite Aqua, launched in 2002, are helping ecologists and climate scientists monitor the impact of short- and long-term climate change on Earth’s natural and agricultural ecosystems.
Links
- Springtime Heatwave in Southeastern Australia (2009)
- Dust Over Southeast Australia (2009)
- Bushfires Raging in Southeast Australia (2003)
- Fires in Victoria, Australia (2007)
- Bushfires in Southeast Australia (2009)
References
- Murray-Darling Basin Authority. (2009). River Murray System Drought Update, Issue 21 (pdf). Murray-Darling Basin Authority Website. Accessed December 10, 2009.
- Australian Bureau of Meteorology. Climate Education: Drought. Accessed December 10, 2009.


