


World of Change: Severe Storms
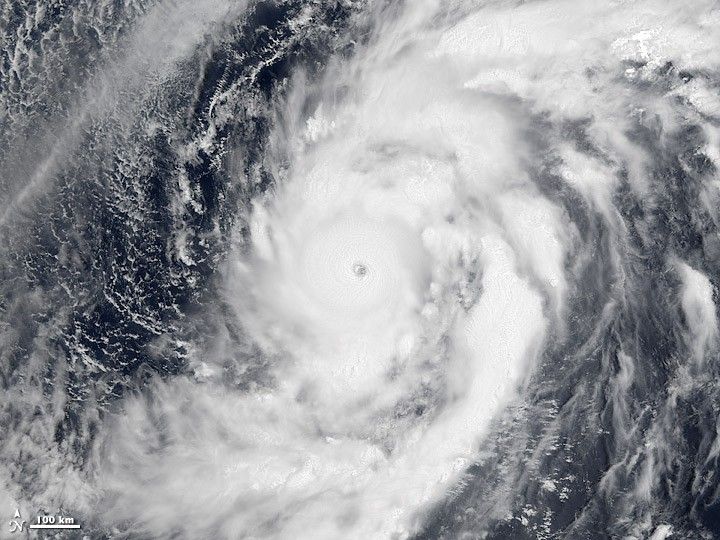
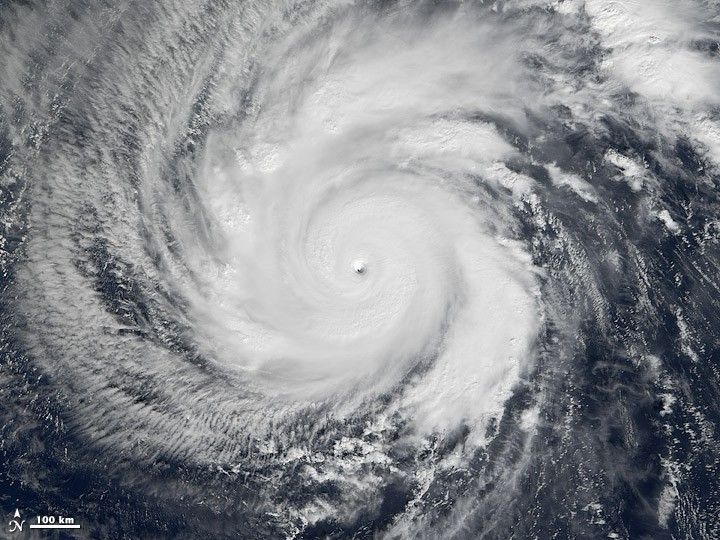
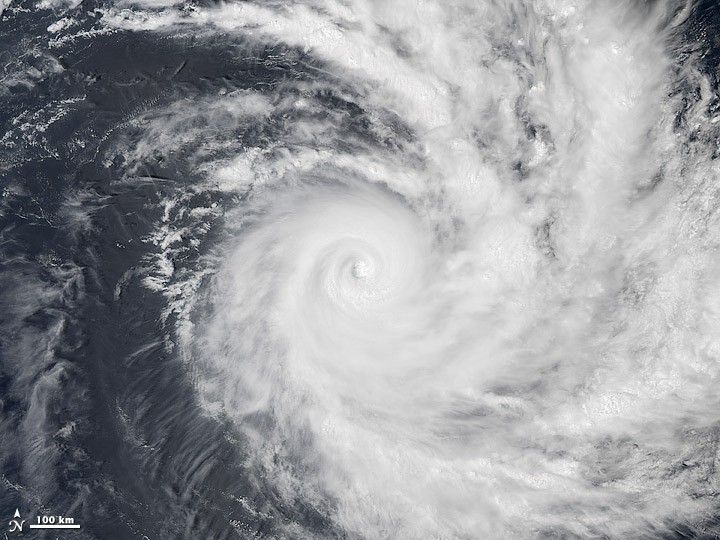
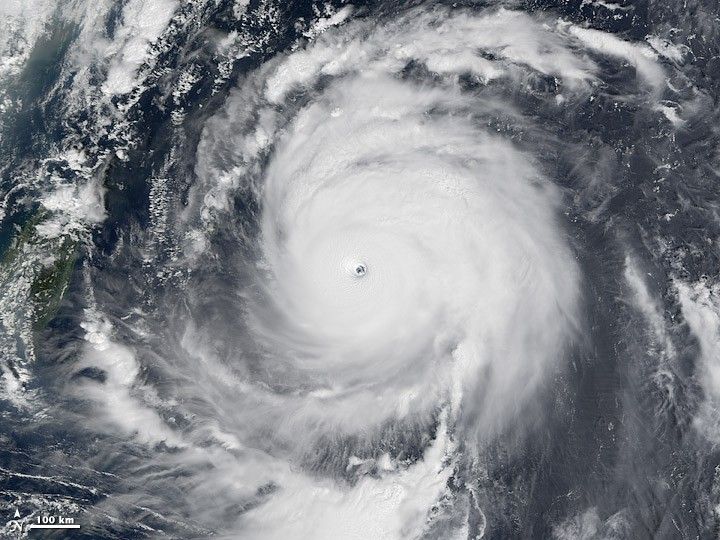
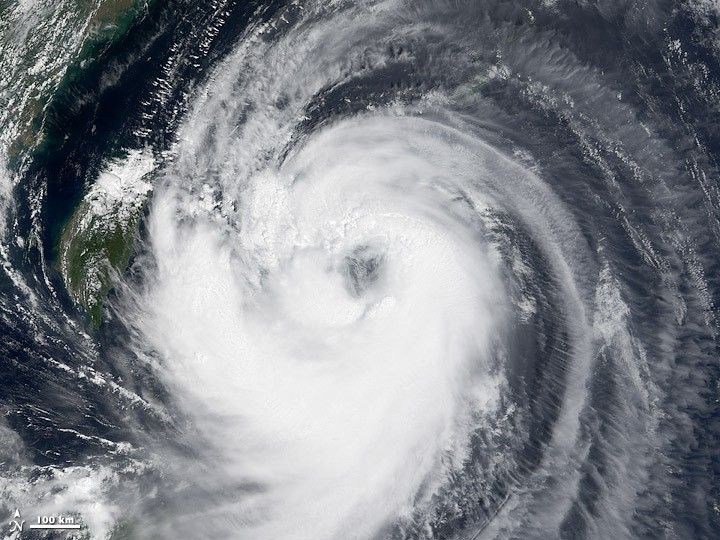
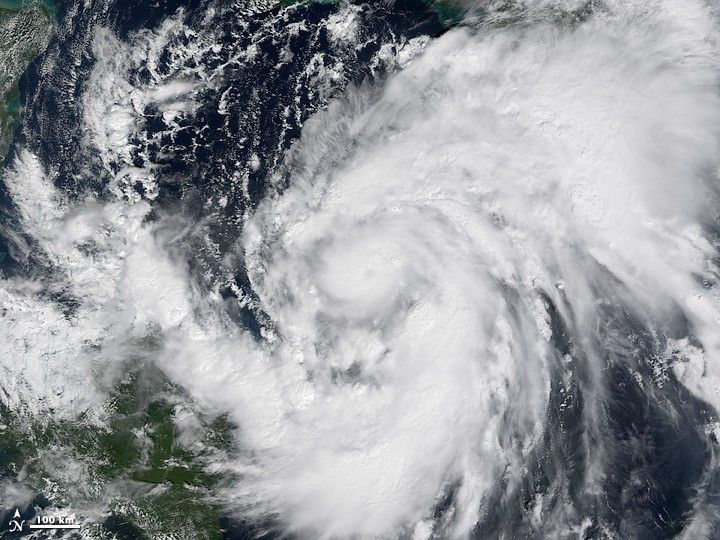
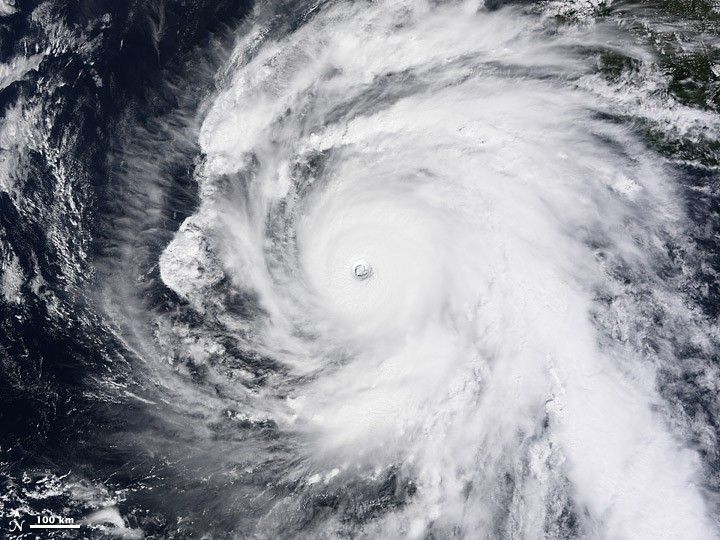
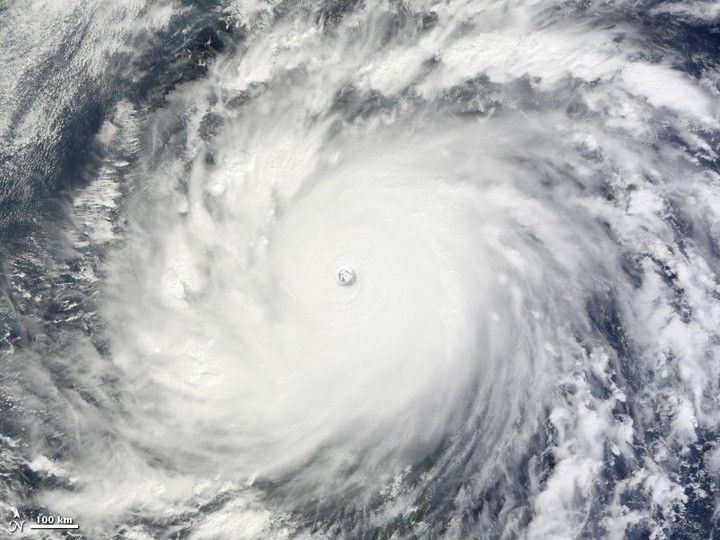
The series of eleven images above depicts the strongest hurricane, cyclone, or typhoon during each year, regardless of ocean basin. It includes storms both infamous and obscure. The judging is based on the storm with the highest wind speed, using lowest minimum pressure as a tie-breaker when needed. The images were all captured by the Moderate Resolution Imaging Spectroradiometer (MODIS) on NASA’s Terra or Aqua satellites, and they are all shown at the same scale.
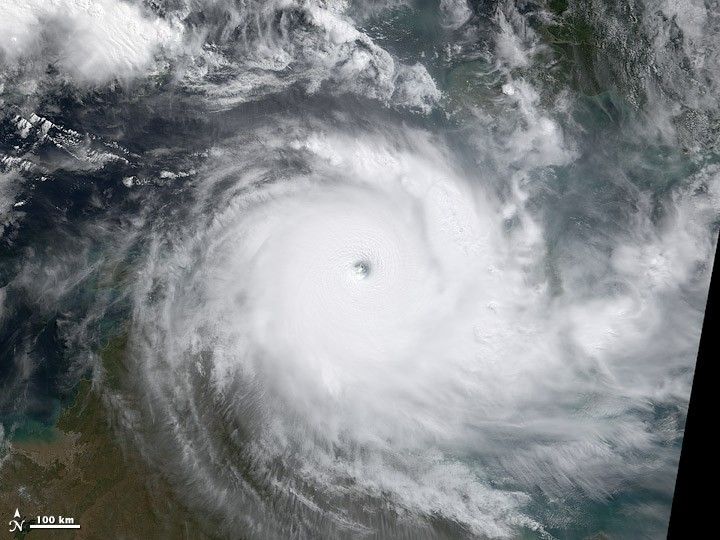
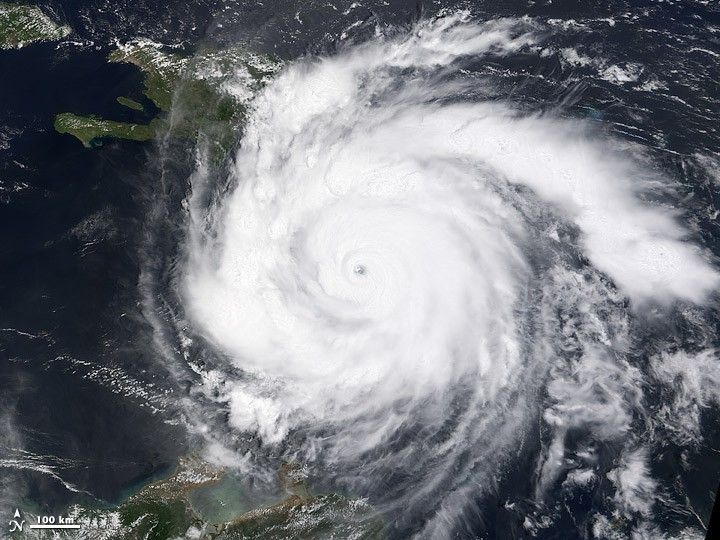
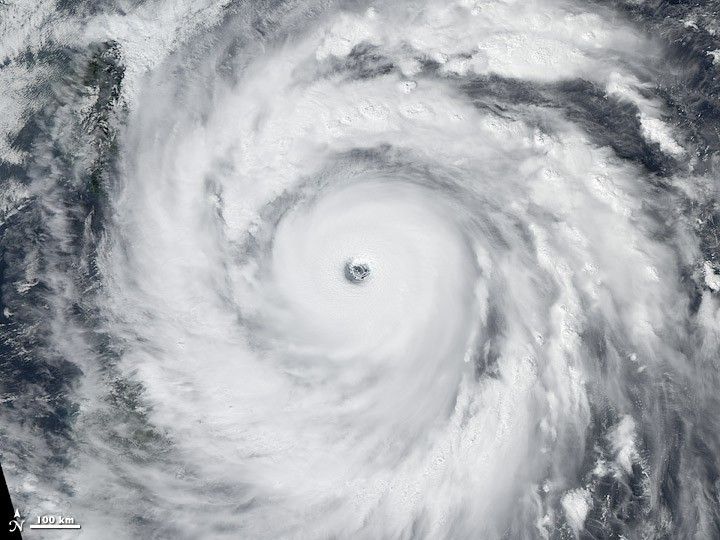
In the past 11 years, two of the most powerful storms were in the Atlantic/Caribbean basin, six were in the Western Pacific (and north of the equator), and three were in the South Pacific. Even without looking at the table below, you can distinguish Northern Hemisphere storms from Southern by examining the imagery. Northern cyclones rotate counterclockwise, while southern storms rotate clockwise (because of the Coriolis force). All storm categories are based on the Saffir-Simspon Hurricane Scale.
| Storm | Date of image | Maximum Wind Speed km/h (mph) | Minimum Pressure (millibars) | Basin |
|---|---|---|---|---|
| Damrey | May 9, 2000 | 290 (180) | 878 | Western Pacific |
| Faxai | December 22, 2001 | 290 (180) | 915 | Western Pacific |
| Zoe | December 28, 2002 | 285 (177) | 890 | South Pacific |
| Maemi | September 10, 2003 | 280 (174) | 910 | Western Pacific |
| Chaba | August 23, 2004 | 290 (180) | 879 | Western Pacific |
| Wilma | October 18, 2005 | 295 (183) | 882 | Atlantic/Caribbean |
| Monica | April 24, 2006 | 285 (177) | 905 | South Pacific |
| Dean | August 18, 2007 | 280 (174) | 907 | Atlantic/Caribbean |
| Jangmi | September 27, 2008 | 260 (162) | 905 | Western Pacific |
| Rick | October 18, 2009 | 285 (127) | 906 | Eastern Pacific |
| Megi | October 18, 2010 | 295 (183) | 885 | Western Pacific |
Many North Americans will recognize Hurricanes Dean (2007) and Wilma (2005). Wilma holds the record for the most intense Atlantic Basin storm on record (based on air pressure), and it made landfall on the island of Cozumel, the Yucatan Peninsula, and Florida. After cutting a devastating path through the Caribbean, Hurricane Dean made a rare Category 5-strength landfall in Mexico.
Residents around the Western Pacific Basin might not remember the names Damrey (2000) or Faxai (2001); both of these Category 5 super typhoons came and went through the remote Pacific without ever approaching land. But other storms inflicted great damage. Super Typhoon Maemi (2003) was the costliest typhoon ever to hit Korea, killing more than a hundred people. Super Typhoon Chaba (2004) pummeled both the Northern Marianas Islands and Honshu, Japan. Super Typhoon Jangmi (2008), which made landfall across northern Taiwan as a Category 3 storm, was not only the strongest storm of 2008, it was also the only storm worldwide to reach Category 5 strength. Super Typhoon Megi (2010), which tied for the most intense winds in our series, caused extensive damage but thankfully low casualties across the Philippines and southeastern China.
Of the three South Pacific cyclones to appear in this collection, Monica (2006) and Zoe (2002) were nearly equal in terms of strength. Monica crossed the Cape York Peninsula of Australia as a Category 2 cyclone, but emerged over the warm waters of the Gulf of Carpentaria and intensified into a Category 5 storm before its second landfall on Northern Territory’s Top End. Cyclone Zoe (2002) traced an erratic path through the Solomon Islands, avoiding major land masses, but the eye passed over the tiny, sparsely populated island of Tikopia at the height of the storm. The strongest storm of 2009 didn’t arrive until October, when Category 5 Hurricane Rick formed in the eastern Pacific. Rick weakened significantly before coming ashore near Mazatlán, Mexico.
Data on maximum wind speed and minimum pressure for Atlantic Basin storms comes from the National Hurricane Center; for Western Pacific storms, from the Japanese Meteorological Agency; for South Pacific storms, the Australian Bureau of Meteorology.


