


World of Change: Solar Activity


Over the span of 11 years, the Sun’s activity waxes and wanes as magnetic field lines that are wound and tangled inside the Sun periodically break through to the surface. These breakthroughs produce a pair of sunspots of opposite magnetic polarity, one positive and the other negative, that travel together across the face of the Sun. The heightened magnetic activity associated with sunspots can lead to solar flares, coronal mass ejections, and other far-reaching electromagnetic phenomena that endanger astronauts and damage or disrupt satellites.
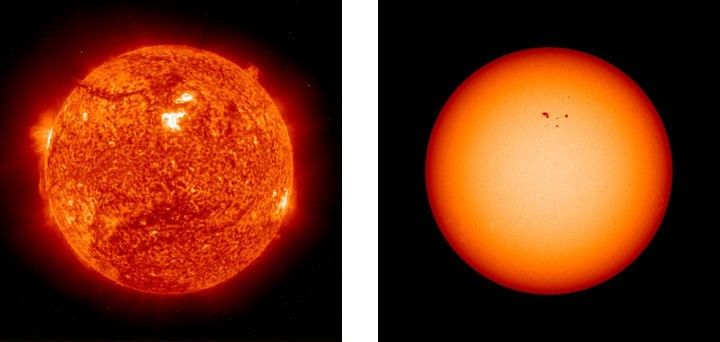
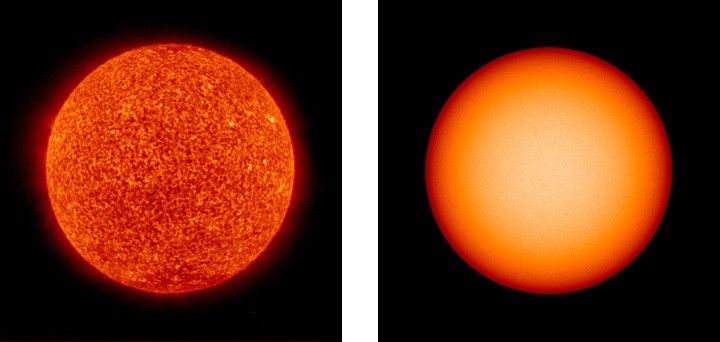
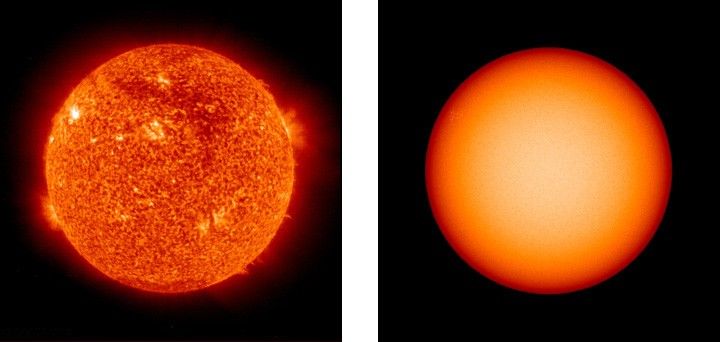
This series of images from the Solar and Heliospheric Observatory (SOHO) spacecraft shows ultraviolet light (left) and sunspots (right) each spring from 1999 through 2010. Sunspots darken the visible surface of the Sun, while observations of ultraviolet light reveal how the magnetic activity that produced the sunspots excited the overlying solar atmosphere, producing intensely bright areas. As Solar Cycle 23 reached its peak between 2000-2002, numerous sunspots speckled both hemispheres, and then their numbers dramatically dropped off as the cycle went toward its minimum.
If you map the location of the spots on the Sun’s surface over the course of a solar cycle, the pattern they make is shaped like a butterfly. The reason for the butterfly pattern is that the first sunspots of each new solar cycle occur mostly at the Sun’s mid-latitudes, but as the solar cycle progresses, the area of maximum sunspot production shifts toward the (solar) equator.
Solar Cycle 24 began in early 2008, but there was minimal activity through early 2009. The image from April 29, 2009, does show a pair of small sunspots (far right, most visible in large image), but the location of the spots near the equator means that they belong to solar cycle 23. The sunspots visible in the images from May 2, 2010, however, are from the new cycle. The most recent forecast from the Space Weather Prediction Center is that solar cycle 24 will be of below-average intensity, and that it will peak in May 2013.
The small changes in solar irradiance that occur during the solar cycle exert a small influence on Earth’s climate, with periods of intense magnetic activity (the solar maximum) producing slightly higher temperatures, and solar minimum periods such as that seen in 2008 and early 2009 likely to have the opposite effect.


