










NASA Knows: Drought
Drought can begin quietly or arrive in a flash. It can begin with too little rain, too little snow, or a water supply that never fully recovers from past dry years. NASA helps communities see where rain and snow are falling, where water is stored, how it is being used, and whether landscapes are recovering from drought or still running a deficit.
Key takeaways
- Drought is a prolonged period of abnormally low precipitation that causes water shortages in soil, rivers, reservoirs, snowpack, or underground aquifers.
- Droughts can last from weeks to decades, depending on severity and how quickly water systems recover.
- Droughts can affect drinking water, agriculture, energy, ecosystems, recreation, navigation, and wildfire risk. Extreme heat and land use can make drought impacts worse.
- NASA’s Earth-observing satellites, aircraft, models, and data tools help farmers, ranchers, water managers, emergency planners, and communities track drought and make better-informed decisions.
The basics
-
What is drought?
A drought happens when water availability falls below normal for an extended period. One useful way to think about drought is through three connected parts of the water system: how water is delivered, how it is stored, and how it is used. Water may arrive as rain or snow. It may be stored in snowpack, rivers, reservoirs, soil, wetlands, or underground aquifers. It may be used by crops, forests, cities, industry, power systems, and ecosystems. Drought can emerge when any part of that system falls out of balance.
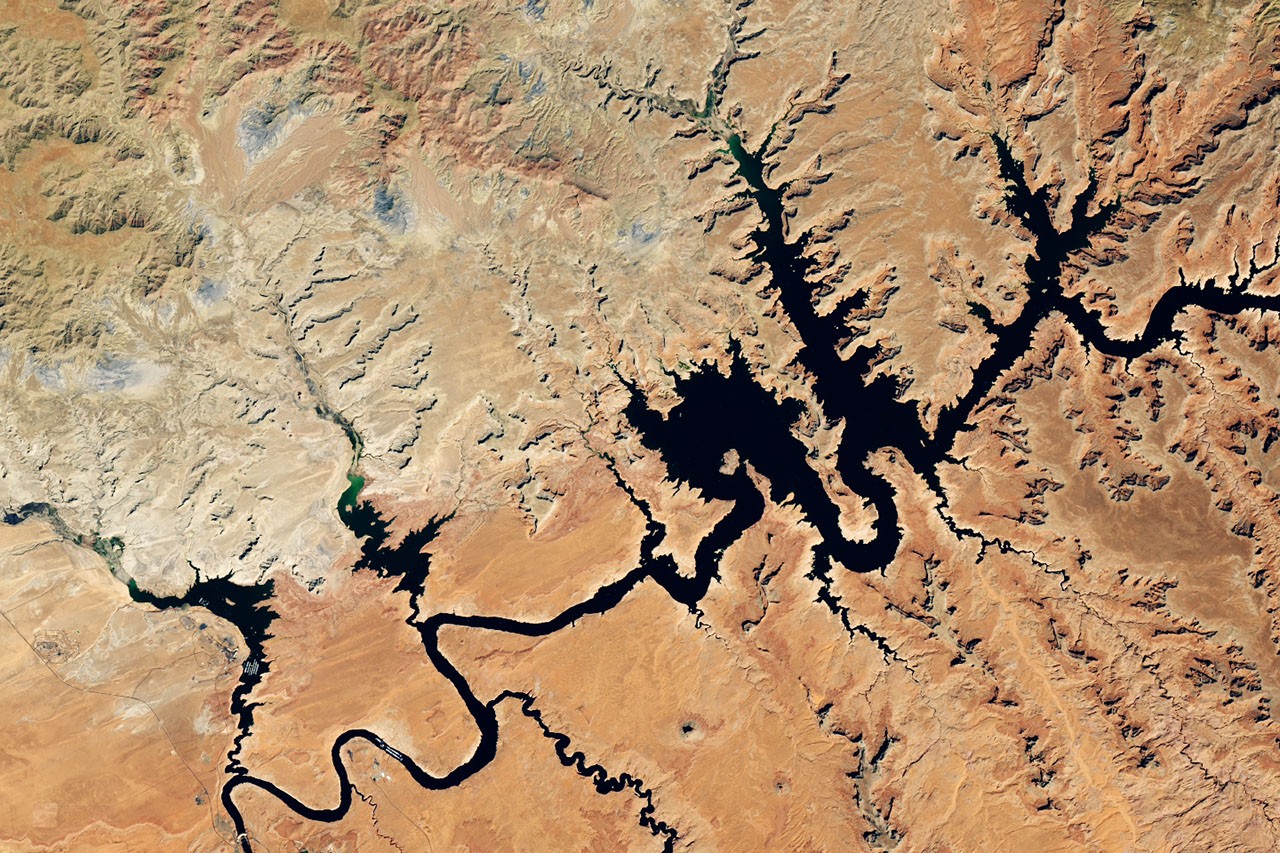
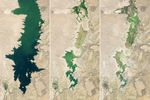
 In 2013, drought and persistent demand pushed New Mexico’s largest reservoir to what were then record-low levels.NASA Earth Observatory
 -
What causes drought?
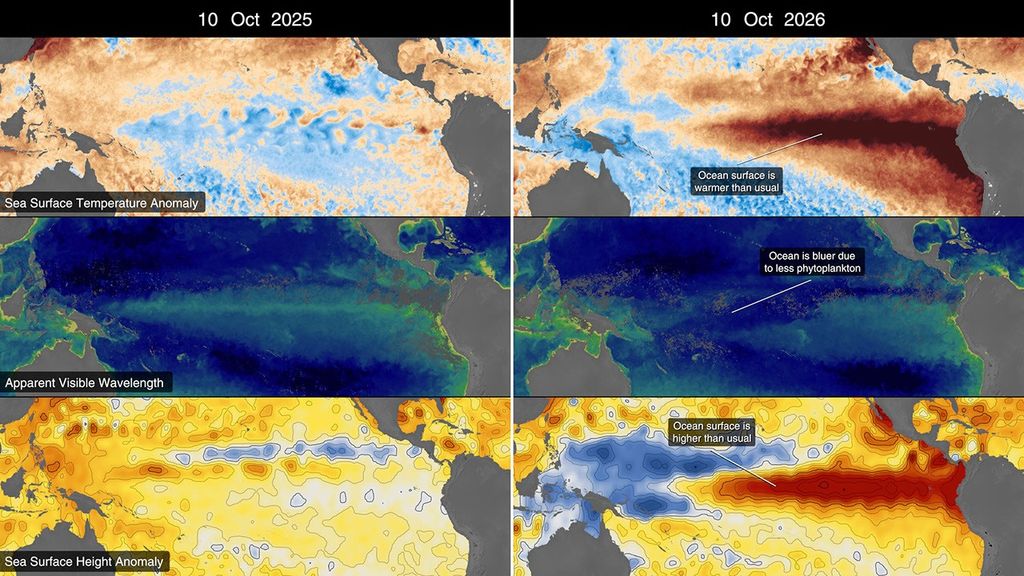
Droughts often result from a combination of factors, including large-scale climate patterns, persistent weather systems, and changes in when or how often major storms bring rain or snow. A shift in ocean temperatures like those associated with El Niño or La Niña can disrupt rainfall patterns. Persistent high-pressure weather systems can reduce precipitation and enhance regional heating.
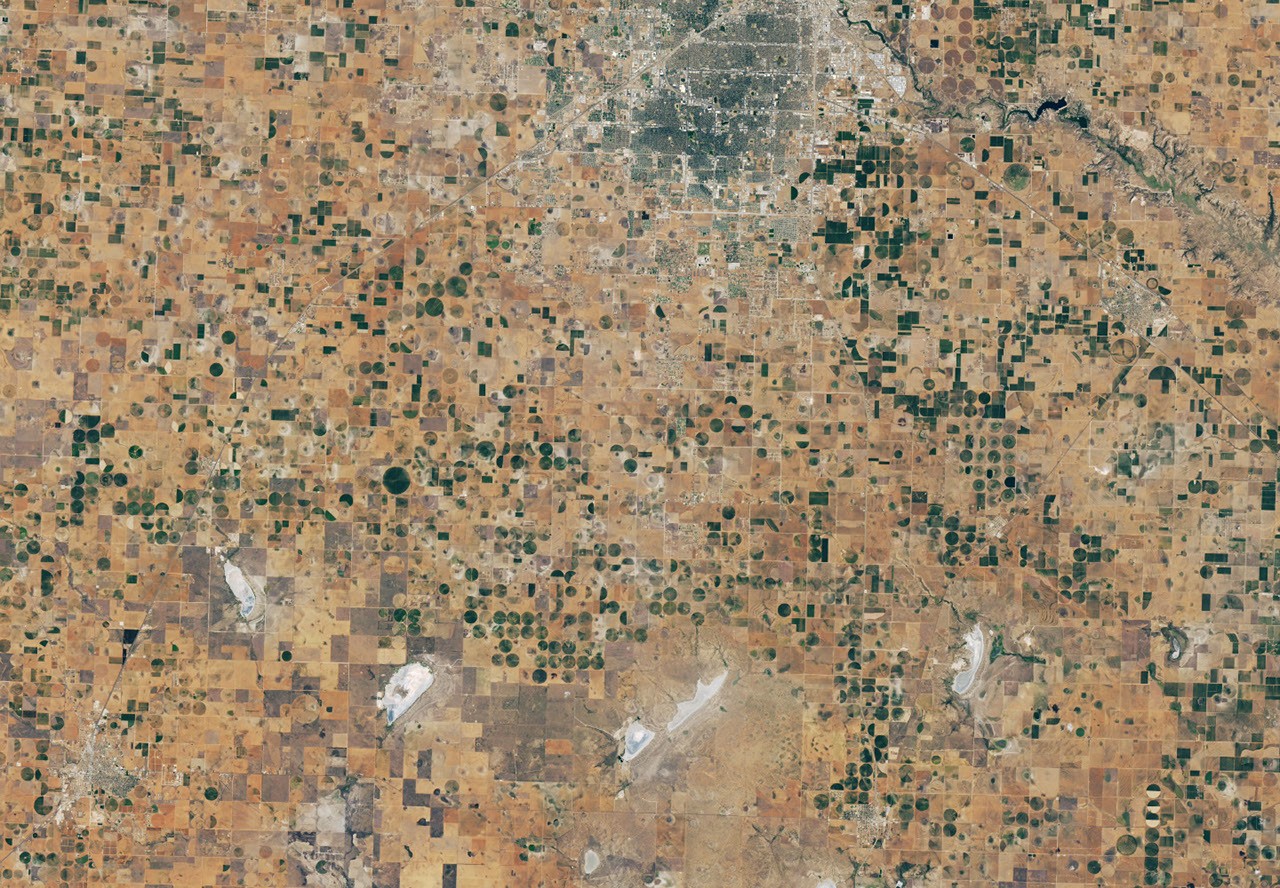
In the Western U.S., drought is often shaped by snow as much as rain. Warmer winters can make more precipitation fall as rain instead of snow, and early heat can melt snowpack before spring and summer, when water demand is highest. That can mean less water in rivers, reservoirs, and aquifers, even in years with winter storms. Human factors, including overuse of surface water or groundwater and changes in land cover, can worsen drought impacts. In summer 2024, a large reservoir in the Rio Grande Valley hit what was then record-low levels, as the surrounding area in southern Texas and northern Mexico faced severe drought conditions.NASA Earth Observatory
 -
How does drought affect us?
Drought can affect drinking water, crops, rangelands, hydroelectric power, ecosystems, recreation, and even shipping when rivers run low. Farmers may face crop losses or rising irrigation costs. Low reservoirs can lead to water use restrictions. Low streamflow and elevated water temperatures can harm aquatic life, including salmon survival and reproductive success. Reduced water availability dries out grasslands and forests, creating conditions that can increase wildfire risk.
 Months of heat and drought parched the Mississippi River in 2023.NASA Earth Observatory
2026 Western Snow Drought
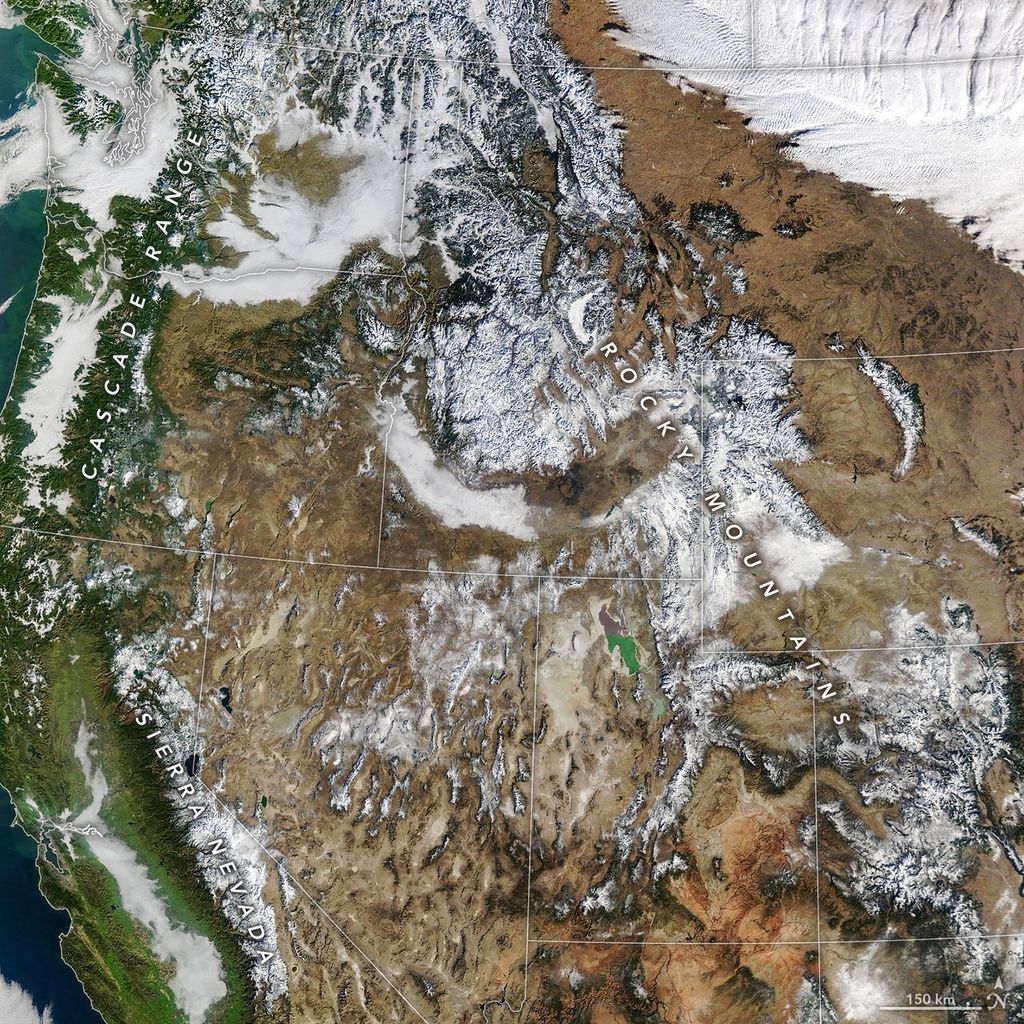
During the winter of 2025–26, unusually warm conditions caused more precipitation to fall as rain instead of snow across much of the western United States, while low precipitation also limited how much snow accumulated in some areas. On Jan. 15, satellite-based measurements showed that snow covered about 142,700 square miles of the West — the lowest coverage for that date in the MODIS (Moderate Resolution Imaging Spectroradiometer) record dating back to 2001.
January, February, and March of 2026 each had the lowest snow cover for that month in the MODIS record, with a late March heat wave accelerating the decline.
By spring, snowpack had peaked weeks earlier than usual in many areas. In the Upper Colorado River Basin, for example, snow water equivalent peaked around mid-March 2026, about four weeks early.
By late summer, the below-average snow year had compounded long-term water shortages across the West, leaving many major reservoirs at or near historic lows.
Why It Matters
When snow melts too early, water may move through rivers before communities, farms, and ecosystems need it most. The effects can continue long after the snow itself has disappeared:
Water supplies: Less or earlier runoff can reduce water availability later in the year and complicate reservoir operations and water-supply forecasts.
Agriculture and energy: Farmers may have less water available during the growing season, while changes in streamflow can affect hydropower production.
Ecosystems: Lower and warmer streams can impact fish and other aquatic life, including salmon.
Wildfire: Earlier snow loss can allow soils and vegetation to dry sooner, contributing to conditions that are conducive to wildfire.
NASA In Action
NASA's Earth observations provide open, scientifically validated information that helps water managers and other experts understand current conditions and make informed decisions based on NASA data.
See snow drought more clearly. Ground stations provide precise measurements at individual locations. NASA Earth observations add a consistent view across entire watersheds, including remote areas. NASA-funded and NASA-enabled products such as Snow Today use that data to show where snow remains, how much water it holds, and how conditions change during melt season.
Understand water supplies. NASA information enables government, university, and commercial tools that estimate how much water will reach rivers and reservoirs and when. These tools can connect current snowpack conditions to water supplies expected later in the season.
Respond with a fuller picture. NASA observations and derived products also show soil moisture, groundwater, rivers, reservoirs, and water use. Missions and tools such as GRACE-FO, SMAP, SWOT, and OpenET give states, tribes, utilities, farmers, and other decision-makers a fuller picture of water supply and demand. NASA scientists and data also support the U.S. Drought Monitor, the nation’s weekly assessment of drought conditions.
Vital info
Is my area experiencing drought?
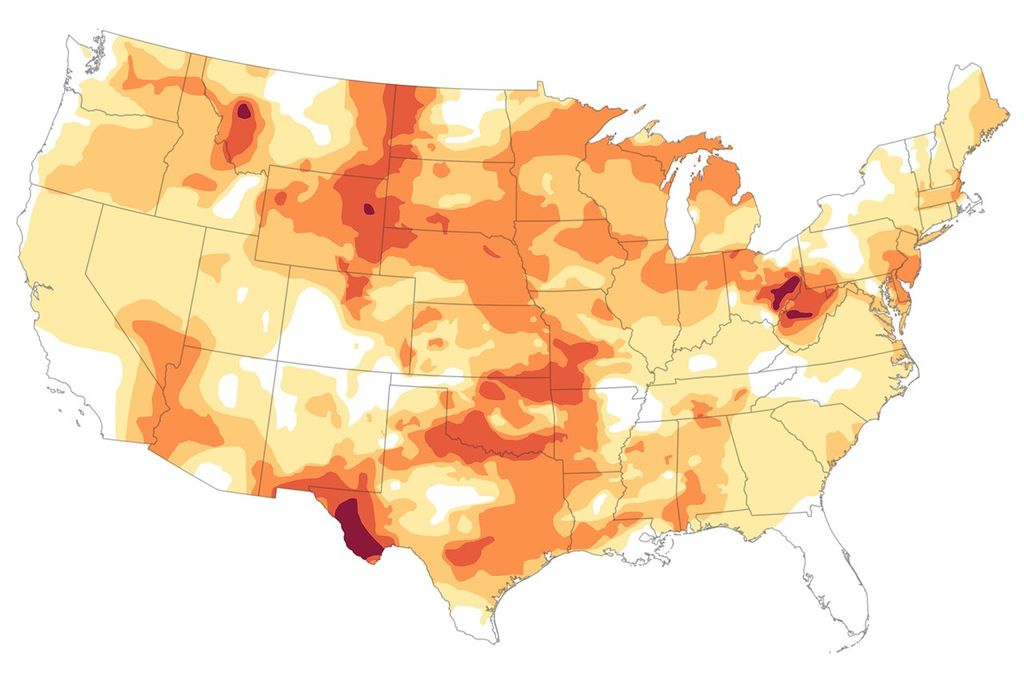
NASA is an official partner in the U.S. Drought Monitor, along with the U.S. Department of Agriculture, the National Oceanic and Atmospheric Administration (NOAA), and the University of Nebraska-Lincoln. NASA scientists serve on the rotating team that produces its weekly maps. Scientists combine NASA observations and models with information from federal, state, and local experts to assess drought conditions across the nation.
What is a flash drought?
Not all droughts build slowly. “Flash droughts” can develop in a matter of weeks when intense heat quickly dries out soil and vegetation. NASA Earth missions may detect these rapid changes in soil moisture, helping farmers and forecasters respond before crops wither.
How do droughts end?
Drought recovery can take time. A single storm may temporarily revive vegetation, but rivers, reservoirs, and aquifers may need months or years to refill. Drought can also create conditions that may trigger other problems. Soil, for example, may become so compacted during drought that it isn’t able to absorb water effectively, increasing the risk of floods and dust storms. NASA satellites help track a drought’s recovery phase, showing how landscapes are bouncing back.
A Year of River Flow
This visualization, based on data from the SWOT (Surface Water and Ocean Topography) satellite, shows seasonal changes in river volume worldwide from October 2023 to September 2024, including for the Mississippi, Amazon, Congo, Ganges, and Yangtze rivers.
Learn MoreHow the science happens
Using remote sensing, NASA tracks key parts of the water cycle from space: rain and snow, snow cover, soil moisture, signs of plant stress, surface water, and total water storage, including groundwater.
Airborne missions and computer models fill in additional detail and help simulate what satellites cannot see directly. Field measurements remain essential for checking and improving those observations. That broad view can help reveal where snow remains, where soils are dry, where reservoirs are shrinking, and whether groundwater and ecosystems are recovering.
From Floods to Droughts
More than 10 years after launch, the joint NASA-JAXA Global Precipitation Measurement (GPM) mission continues to provide a global view of rain and snow, helping scientists track where precipitation is falling short and how much storms deliver.
Learn MoreHow does NASA help?
NASA provides free, scientifically validated data and tools that help communities, farmers, states, tribes, federal agencies, and water managers make better-informed decisions about drought. Some examples include:
- The GPM mission tracks global precipitation. Its IMERG (Integrated Multi-satellitE Retrievals for GPM) product provides near-real-time estimates of Earth’s precipitation, updated every half-hour.
- NASA’s GMAO (Global Modeling and Assimilation Office) develops and operates the GEOS-S2S (Goddard Earth Observing System Subseasonal-to-Seasonal) prediction system, which combines Earth observations with a coupled model to project temperature and precipitation patterns from weeks to several months ahead.
- With its advanced radar, the NISAR (NASA-ISRO Synthetic Aperture Radar) satellite brings powerful new detail to NASA’s view of soil moisture. The SMAP (Soil Moisture Active Passive) mission provides a complementary global view of surface soil moisture, while GRACE-FO (Gravity Recovery and Climate Experiment Follow-On) tracks changes in total water storage, including groundwater.
- Observations from MODIS (Moderate Resolution Imaging Spectroradiometer) and VIIRS (Visible Infrared Imaging Radiometer Suite), together with data from the HLS (Harmonized Landsat and Sentinel-2) project, can be used to map changes in snow cover, vegetation greenness, and the extent of surface water. Snow cover alone does not show how much water the snowpack contains. Scientists combine satellite observations with ground measurements and models to assess snow water equivalent, or the amount of water stored in the snowpack.
- Researchers are exploring observations from the PACE (Plankton, Aerosol, Cloud, ocean Ecosystem) mission to study snow grain size and light-absorbing particles that darken snow, both of which influence how much sunlight the snowpack absorbs and how quickly it melts.
- The ICESat-2 (Ice, Cloud, and land Elevation Satellite-2) mission measures surface elevation, helping scientists track elevation changes in mountain glaciers and derive estimates of snow depth.
- The SWOT mission measures the height and extent of rivers, lakes, and reservoirs, helping scientists estimate changes in how much water they hold. NASA’s OPERA (Observational Products for End-Users from Remote Sensing Analysis) project maps the extent of surface water, providing frequent, detailed views of changing rivers, lakes, reservoirs, and floodwaters.
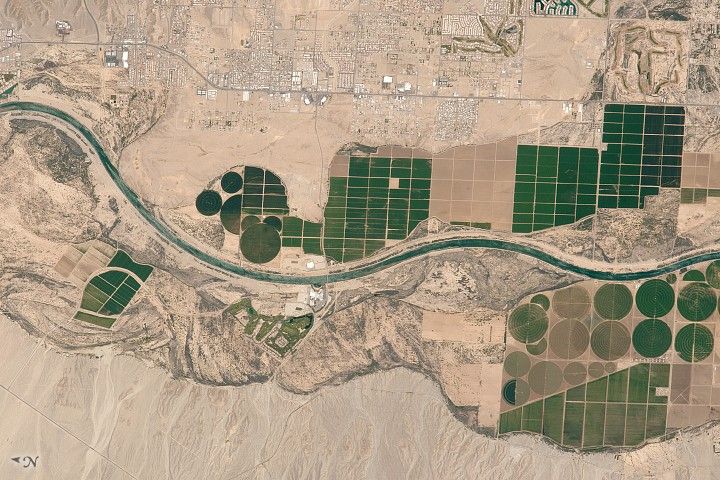
- The Landsat satellites, the ECOSTRESS (ECOsystem Spaceborne Thermal Radiometer Experiment on Space Station) mission, and the online OpenET tool help estimate evapotranspiration (ET), or how much water crops and landscapes use, across the contiguous U.S. By providing up-to-date, field-level water-use data, OpenET helps farmers, water managers, and states track shortages, plan allocations, and respond more effectively during drought.
- Landsat also supports the Normalized Difference Vegetation Index, a vegetation index that helps scientists spot drought stress by measuring how healthy plants appear from space.
- NASA’s Water Resources program works on drought as one of its core focus areas. The program supports tools and applications that help water managers and others use Earth observations to monitor dry conditions, assess impacts, and make improved decisions about scarce water resources.
- NASA’s SPoRT (Short-term Prediction Research and Transition) center combines observations with land-surface modeling to make frequently updated maps that show soil moisture at different depths and how current conditions compare with the historical record.
- NASA works with the commercial space industry to expand the nation’s view of drought. Through the Commercial Satellite Data Acquisition program, the agency acquires detailed and frequently collected observations that complement NASA missions and can help researchers examine drought conditions at local scales.
- Through its EarthRISE program, NASA works with state and local governments, federally recognized tribes, territories, and the private sector to integrate satellite information into real-world decisions, including about drought.
- GEOGloWS, short for Group on Earth Observations Global Water Sustainability, is a free, open service providing global river-flow forecasts and historical context to help water managers prepare for drought and other extremes. NASA funded and contributed to its early development; the service has since matured into a widely used system sustained by a broader community of partners, users, and stakeholders.

Resources
Related Missions
NISAR
Launched in 2025, the NISAR mission — a partnership between NASA and ISRO — puts unprecedented radar capability in orbit, revealing tiny changes in Earth's surface. With NISAR's advanced radar, discovery comes in the details. Its data could help pinpoint where areas dry out first, how quickly they recover after rain, and how plants and irrigation change the map.
SWOT
The SWOT mission brings together two communities focused on a better understanding of the world's oceans and its terrestrial surface waters. U.S. and French oceanographers and hydrologists and international partners have joined forces to develop this satellite mission to make the first global survey of Earth’s surface water, observe the fine details of the ocean's surface topography, and measure how water bodies change over time.
GRACE / GRACE-FO
The GRACE mission and its successor GRACE-FO track changes in groundwater and surface water by tracking slight variations in Earth’s gravity field. Developed through a long-running partnership between NASA and the German Aerospace Center, the missions have provided a unique view of how water storage changes across continents, ice sheets, and aquifers. This data is used by commercial insurers, agribusinesses, water utilities, agronomists, and others to assess drought risk, manage aquifers, and plan for long-term resource stability.
SMAP
The SMAP mission measures the amount of water in the surface soil everywhere on Earth. It also distinguishes between ground that is frozen or thawed. The mission helps provide critical information for early warnings of droughts and floods.
Landsat
A joint NASA-U.S. Geological Survey mission series, Landsat has provided more than 50 years of observations of Earth’s land surface. Its long record helps scientists and communities see how drought affects vegetation, lakes, rivers, irrigated fields, and landscapes over time.
GPM
NASA/JAXA’s GPM mission uses satellites to track rain and snow worldwide, giving a clearer picture of changing precipitation patterns. That makes GPM valuable for drought because it helps reveal rainfall deficits, monitor dry conditions, and improve forecasts.
MODIS and VIIRS
These instruments track vegetation health, snow cover, and land-surface temperature, helpful for understanding drought impacts.
Related Instruments
Synthetic Aperture Radar: An instrument that sends microwave signals toward Earth and measures the signals that return, producing detailed observations through clouds and darkness. NISAR uses synthetic aperture radar to observe soil moisture, vegetation, ice, and subtle changes in Earth’s surface, supporting research on drought, ecosystems, and hazards such as earthquakes and landslides.
Ka-band Radar Interferometer: An instrument that uses radar signals and two antennas to measure the elevation and extent of water. On SWOT, these measurements help scientists track changes in major lakes, rivers, reservoirs, and wetlands while detecting ocean features with unprecedented resolution.
Radiometer: An instrument that detects the electromagnetic energy (mostly light and heat) emitted by objects and surfaces on Earth. On the SMAP mission, for example, a passive microwave radiometer measures naturally emitted microwave energy from the land surface to estimate moisture in the top layer of soil.
Accelerometer: An instrument that measures acceleration — how quickly an object’s speed or direction changes. On GRACE-FO, accelerometers measure forces acting on the satellites other than gravity, such as atmospheric drag. Accounting for those forces helps scientists map changes in Earth’s gravity field, revealing shifts in water, ice, and solid Earth mass.
Microwave Interferometer: A microwave interferometer measures tiny changes in the distance between the GRACE-FO satellites. Those changes reflect variations in Earth’s gravity, allowing scientists to track changes in the distribution of water, ice, and other mass.
Precipitation Radar: An instrument that sends radar signals into clouds to measure the three-dimensional structure and intensity of rain and snow. GPM’s dual-frequency precipitation radar helps scientists determine how much precipitation is falling and where.
Imaging Radiometer: An instrument that measures energy reflected or emitted from Earth in multiple wavelength bands. Instruments such as MODIS and VIIRS help scientists map snow cover, vegetation health, surface water, and land-surface temperature.
Definitions
Aquifer: A layer of rock or sediment that holds groundwater.
El Niño: Periodic Pacific warming that shifts rainfall, storms, and temperatures worldwide.
Evapotranspiration: The process by which water moves from the land surface to the atmosphere via evaporation and plant transpiration.
La Niña: Periodic Pacific cooling that shifts rainfall, storms, and temperatures worldwide.
Remote Sensing: Using instruments aboard aircraft or satellites to collect data about Earth’s surface without being in direct contact.
Snowpack: Snow that accumulates and remains on the ground, often in layers.
Soil Moisture: The amount of water held in the upper layers of soil.
