New research uses more than 40 years of data from NASA and the U.S. Geological Survey’s (USGS) Landsat satellites to help dam operators improve the health of salmon fisheries.
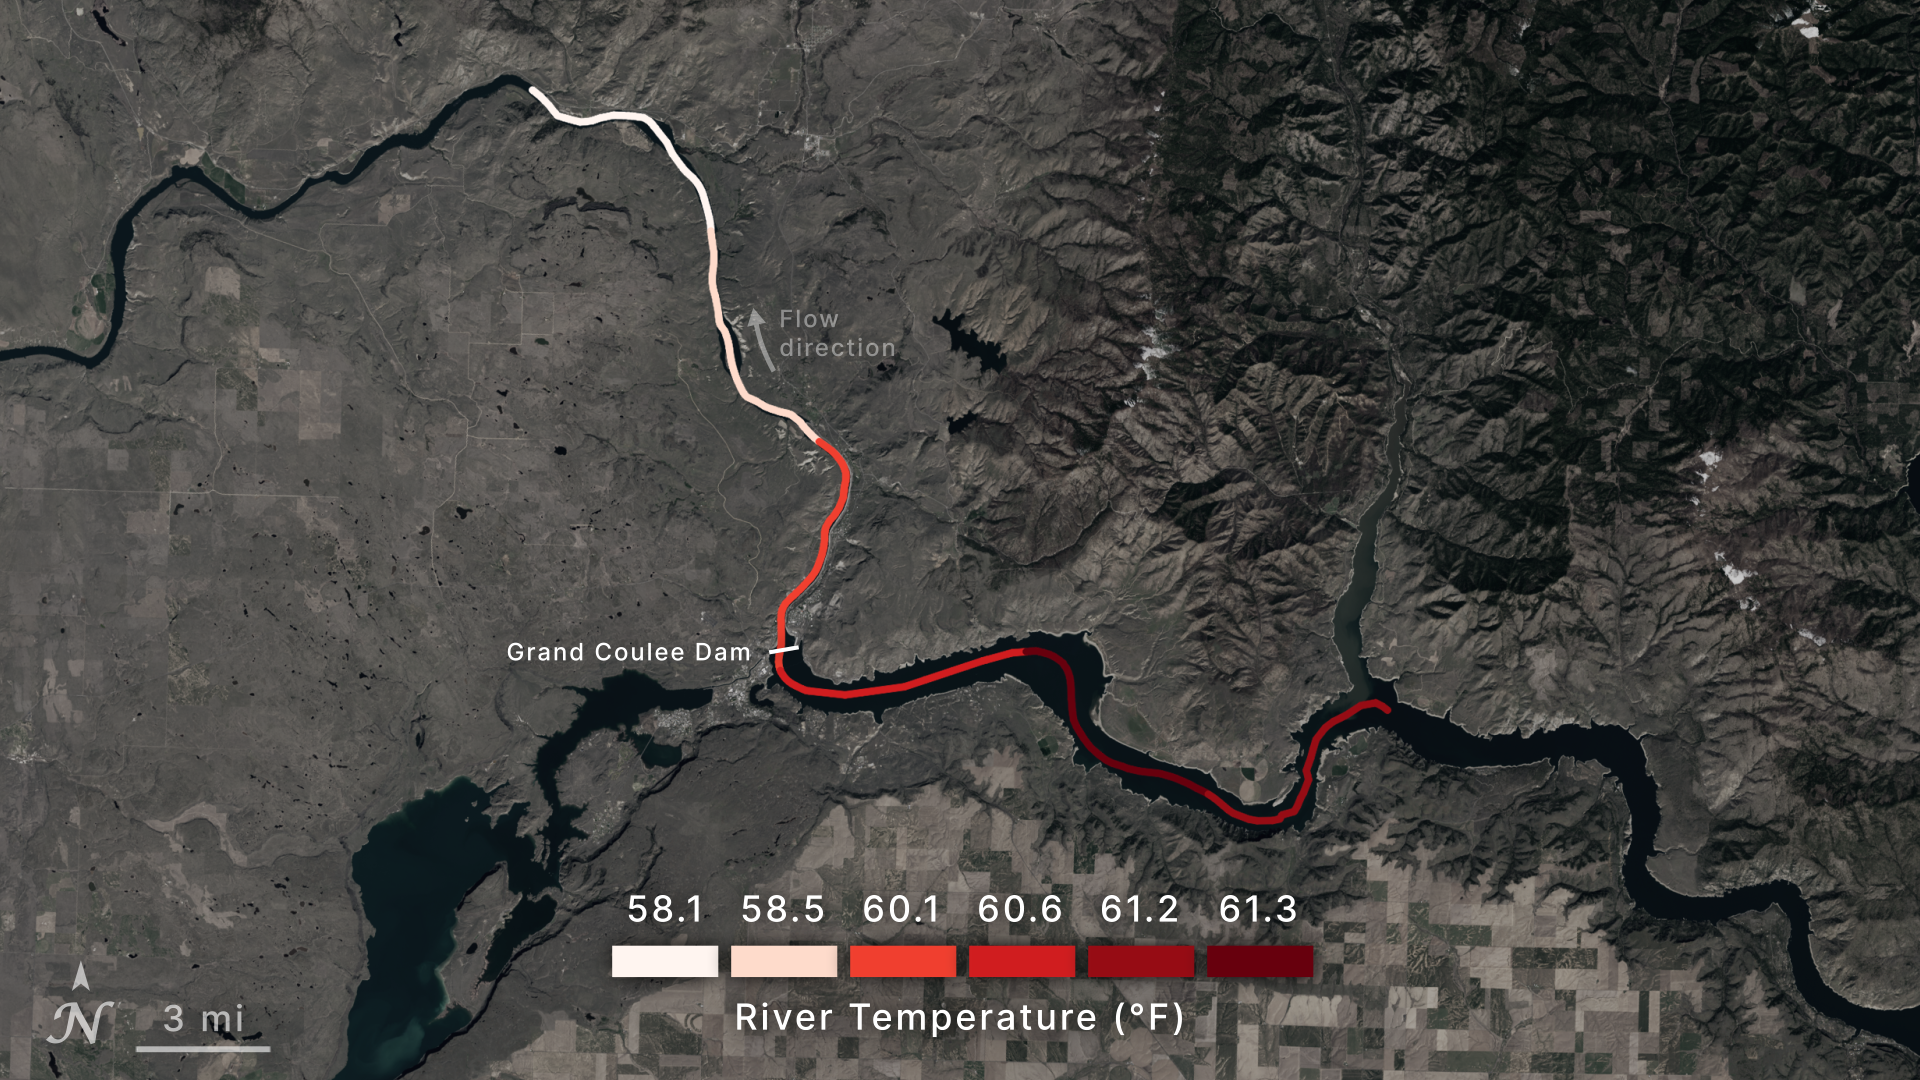
The Columbia and Snake rivers in the Pacific Northwest contain nearly 20 dams, which provide flood control, hydroelectric power, and water for irrigation. But they also change the way the rivers flow. For the study, researchers tracked temperature up and downstream of dams using surface temperature data from Landsat satellites. Data from these satellites support our nation’s agricultural industry, including farmers and food production. Researchers found warm water downstream of dams stressed salmon, making them swim faster. The scientists developed a tool called THORR, or Thermal History of Regulated Rivers, to perform this research.
“NASA’s focus on advancing our understanding of Earth’s freshwater resources is reflected in tools like THORR, which leverage decades of satellite data to improve water management strategies,” said Erin Urquhart, program manager, Earth Action Water Resources Program at the agency’s headquarters in Washington. “By making this information accessible and useful, NASA is ensuring its science directly benefits the communities and industries that depend on these resources.”
The recent study, funded by NASA, provides regularly updated information about river temperature that dam operators can use to fine-tune their operations. Faisal Hossain, a civil and environmental engineering professor at the University of Washington and one of the study authors, explained that when water spills over the dam from the top layer of the reservoir, the water tends to be hotter, as it was warmed by the Sun. That warmer water can stress and even kill salmon, while water that’s discharged through the turbines cools the river downstream. Strategically discharging water from lower levels of the reservoir could help salmon thrive, saving dam operators time and other, costlier interventions, Hossain said.
It has been historically difficult to use satellite data to monitor river temperature, due to cloud cover and the narrowness of river channels relative to satellite resolution. To account for this, a University of Washington team applied a machine-learning algorithm to 42 years of Landsat thermal data. Scientists trained the algorithm using measurements from temperature gauges along the Columbia River Basin, and data on climate, nearby land use, nearby land temperature, and elevation. The resultant tool was developed in consultation with the Columbia River Inter-Tribal Fish Commission. The commission provided on-the-ground feedback to help validate the satellite measurements and to ensure the final tool was user-friendly and served their fisheries’ needs.
“We’re collaborating with the end-users to make this research usable,” Hossain said.
Having a better grasp of local water conditions could influence future fishing regulations. Angela Forristall, staff officer for the Pacific Fishery Management Council working on the Salmon Fishery Management Plan, said the council develops fishing regulations every year based on the best available science. If a salmon stock is determined to be “overfished,” the council develops a rebuilding plan, which takes into consideration conditions that might have led to low numbers of salmon. A tool like THORR could be considered by the council for integration into future models to account for the impacts of river temperature on salmon abundance.
The research team built THORR to be compatible with data from the Surface Water and Ocean Topography mission (SWOT), a joint operation by NASA and CNES (Centre National D'Etudes Spatiales) with contributions from CSA (Canadian Space Agency) and the UK Space Agency. The SWOT satellite, which can measure the amount of water flowing through a stream, delivers data in 6.2 mile (10 km) increments, as does THORR. Researchers at the USGS, meanwhile, have developed a dataset of lake surface temperature across the continental U.S. based on Landsat data. They’re currently developing a similar dataset for rivers.
While the Columbia River Basin was the testing ground for THORR, the methodology used could be expanded to other river systems. The code and data are publicly available so anyone can use satellite data to monitor Earth’s freshwater.