Chapter 6: Electromagnetics
Page One | Page Two | Page Three | Page Four | Page Five | Page Six
Radio Frequencies
Abbreviations such as kHz and GHz are all listed in the Glossary and are also treated under Units of Measure (see the Table of Contents menu).
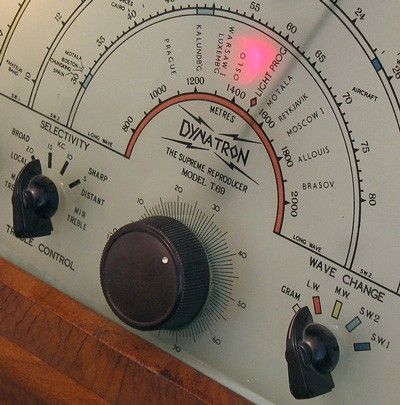
Electromagnetic radiation with frequencies between about 10 kHz and 100 GHz are referred to as radio frequencies (RF). Radio frequencies are divided into groups that have similar characteristics, called "bands," such as "S-band," "X-band," etc. The bands are further divided into small ranges of frequencies called "channels," some of which are allocated for the use of deep space telecommunications. Many deep-space vehicles use channels in the S-band and X-band range which are in the neighborhood of 2 to 10 GHz. These frequencies are among those referred to as microwaves, because their wavelength is short, on the order of centimeters. The microwave oven takes its name from this range of radio frequencies. Deep space telecommunications systems are being developed for use on the even higher frequency K-band.
This table lists some RF band definitions for illustration. Band definitions may vary among different sources and according to various users. These are "ballpark" values, intended to offer perspective, since band definitions have not evolved to follow any simple alphabetical sequence. For example, notice that while "L-Band" represents lower frequencies than "S-Band," "Q-Band" represents higher frequencies than "S-Band."
| Band | Approx. Range of Wavelengths (cm) | Approximate Frequencies |
|---|---|---|
| UHF | 100 - 10 | 300 - 3000 MHz |
| L | 30 - 15 | 1 - 2 GHz |
| S | 15 - 7.5 | 2 - 4 GHz |
| C | 7.5 - 3.75 | 4 - 8 GHz |
| X | 3.75 - 2.4 | 8 - 12 GHz |
| K | 2.4 - 0.75 | 12 - 40 GHz |
| Q | 0.75 - 0.6 | 40 - 50 GHz |
| V | 0.6 - 0.4 | 50 - 80 GHz |
| W | 0.4 - 0.3 | 80 - 90 GHz |
| Within K-band, spacecraft may operate communications, radio science, or radar equipment at Ku-band in the neighborhood of 15 to 17 GHz and Ka-band around 20 to 30 GHz. | ||
The Whole Spectrum
Bring up this page to study a table of the entire electromagnetic spectrum. The table shows frequency and wavelength, common names such as "light" and "gamma rays," size examples, and any attenuation effects in Earth's environment as discussed below.
Atmospheric Transparency
Because of the absorption phenomenon, observations are impossible at certain wavelengths from the surface of Earth, since they are absorbed by the Earth's atmosphere. There are a few "windows" in its absorption characteristics that make it possible to see visible light and receive many radio frequencies, for example, but the atmosphere presents an opaque barrier to much of the electromagnetic spectrum.
Even though the atmosphere is transparent at X-band frequencies, there is a problem when liquid or solid water is present. Water exhibits noise at X-band frequencies, so precipitation at a receiving site increases the system noise temperature, and this can drive the SNR too low to permit communications reception.
Radio Frequency Interference
Spectroscopy
In addition to the natural interference that comes from water at X-band, there may be other sources of noise, such as human-made radio interference. Welding operations on an antenna produce a wide spectrum of radio noise at close proximity to the receiver.
Many Earth-orbiting spacecraft have strong downlinks near the frequency of signals from deep space. Goldstone Solar System Radar (described further in this chapter) uses a very powerful transmitter, which can interfere with reception at a nearby station. Whatever the source of radio frequency interference (RFI), its effect is to increase the noise, thereby decreasing the SNR and making it more difficult, or impossible, to receive valid data from a deep-space craft.
The study of the production, measurement, and interpretation of electromagnetic spectra is known as spectroscopy. This branch of science pertains to space exploration in many different ways. It can provide such diverse information as the chemical composition of an object, the speed of an object's travel, its temperature, and more -- information that cannot be gleaned from photographs or other means.
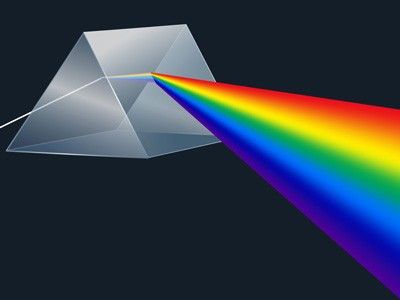
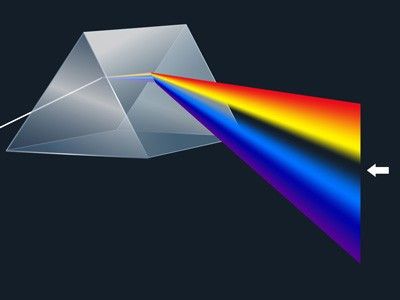
For purposes of introduction, imagine Sunlight passing through a glass prism, creating a rainbow, called the spectrum. Each band of color visible in this spectrum is actually composed of a very large number of individual wavelengths of light which cannot be individually discerned by the human eye, but which are detectable by sensitive instruments such as spectrometers and spectrographs.
Suppose instead of green all you find is a dark "line" where green should be. You might assume something had absorbed all the "green" wavelengths out of the incoming light. This can happen. By studying the brightness of individual wavelengths from a natural source, and comparing them to the results of laboratory experiments, many substances can be identified that lie in the path from the light source to the observer, each absorbing particular wavelengths, in a characteristic manner.
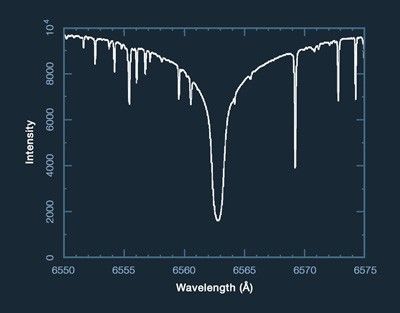
Dark absorption lines in the Sun's spectrum and that of other stars are called Fraunhofer lines after Joseph von Fraunhofer (1787-1826) who observed them in 1817. The image below shows a segment of the solar spectrum, in which many such lines can be seen. The prominent line above the arrow results from hydrogen in the Sun's atmosphere absorbing energy at a wavelength of 6563 Angstroms. This is called the hydrogen alpha line.
On the other hand, bright lines in a spectrum (not illustrated here) represent a particularly strong emission of radiation produced by the source at a particular wavelength.
Spectroscopy is not limited to the band of visible light, but is commonly applied to infrared, ultraviolet, and many other parts of the whole spectrum of electromagnetic energy.
In 1859, Gustav Kirchhoff (1824-1887) described three laws of spectral analysis:
- A luminous (glowing) solid or liquid emits light of all wavelengths (white light), thus producing a continuous spectrum.
- A rarefied luminous gas emits light whose spectrum shows bright lines (indicating light at specific wavelengths), and sometimes a faint superimposed continuous spectrum.
- If the white light from a luminous source is passed through a gas, the gas may absorb certain wavelengths from the continuous spectrum so that those wavelengths will be missing or diminished in its spectrum, thus producing dark lines.
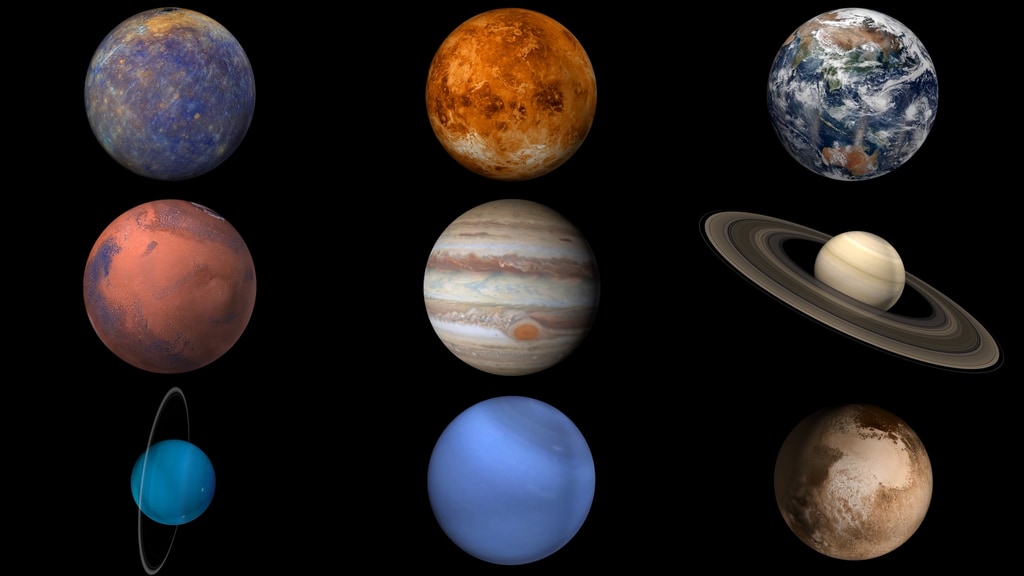
By studying emission and absorption features in the spectra of stars, in the spectra of Sunlight reflected off the surfaces of planets, rings, and satellites, and in the spectra of starlight passing through planetary atmospheres, much can be learned about these bodies. This is why spectral instruments are flown on spacecraft.
Historically, spectral observations have taken the form of photographic prints showing spectral bands with light and dark lines.
Modern instruments (discussed again under Chapter 12) produce their high-resolution results in the form of X-Y graphic plots, whose peaks and valleys reveal intensity (brightness) on the vertical axis versus wavelength along the horizontal. Peaks of high intensity on such a plot represent bright spectral lines (not seen in this illustration), and troughs of low intensity represent the dark lines.
Spectral observations of distant supernovae (exploding stars) provide data for astrophysicists to understand the supernova process, and to categorize the various supernova types. Supernovae can be occasionally found in extremely distant galaxies. Recognizing their spectral signature is an important step in measuring the size of the universe, based on knowing the original brightness of a supernova and comparing that with the observed brightness across the distance.

