Chapter 8: Experiments
Chapter Objectives
Upon completion of this chapter you will be able to identify what is referred to as the scientific community, describe the typical background of principal investigators involved with space flight, and describe options for gathering science data. You will be aware of radio science's special capabilities, and you will be able to describe avenues for disseminating the results of science experiments.
Obtaining scientific information is the primary reason for launching and operating a robotic deep-space mission. Information is obtained by conducting experiments under controlled conditions to collect data. After the experimenters have had a chance to examine their data, and to perform extensive analysis, that information is made available to the larger science community for peer review, and generally at that time to the public at large.
Sometimes, however, because of great public interest in a landing or encounter, JPL's Public Information Office releases imaging and other data to the media shortly after it arrives on Earth, before investigators have had much chance to perform their analysis and invite peer review.
The Scientific Community
The scientific community involved in JPL's experiments is worldwide and typically is composed of PhD-level scientific professionals tenured in academia, and their graduate students, as well as similar-level professional scientists and their staff from industry, scientific institutions, and professional societies.
Gathering Scientific Data
Some experiments have a dedicated instrument aboard the spacecraft to measure a particular physical phenomenon, and some do not. A designated principal investigator (PI) or in many cases, a team, determines or negotiates the experiment's operation and decides who will analyze its data and publish the scientific results. Members of these teams may have been involved in the design of the instrument. Some examples of this kind of experiment are...
- the Radar Sensor on the Magellan spacecraft and the associated Radar Investigation Group of 26 scientists worldwide headed by a Principal Investigator, or PI, at MIT;
- the Low Energy Charged Particle experiment on the Voyager spacecraft and the associated PI and team;
- the Photopolarimeter experiment on the Voyager spacecraft and the PI at JPL;
- the Solid State Imaging experiment on the Galileo spacecraft and the imaging team headed by a PI at the University of Arizona.
Details of typical individual instruments aboard spacecraft which are used to gather data for these experiments appear in Chapter 12.
Other experiments are undertaken as opportunities arise to take advantage of a spacecraft's special capabilities or unique location or other circumstance. Some examples of this kind of experiment are...
- the gravitational wave search using the DSN and telecommunications transceivers aboard the Ulysses, Mars Observer, Galileo, and Cassini spacecraft (the PIs are at Stanford University and the University of Rome);
- the UV spectral observations of various astronomical sources using the Voyager UV spectrometer by various members of the astronomical community; and
- Venus atmospheric density studies using the attitude reaction wheels aboard the Magellan spacecraft by the PI at the NASA Langley Research Center.
- Solar corona studies conducted by a PI at JPL using DSN's radio link with various interplanetary spacecraft as they pass behind the Sun.
Science and Engineering Data
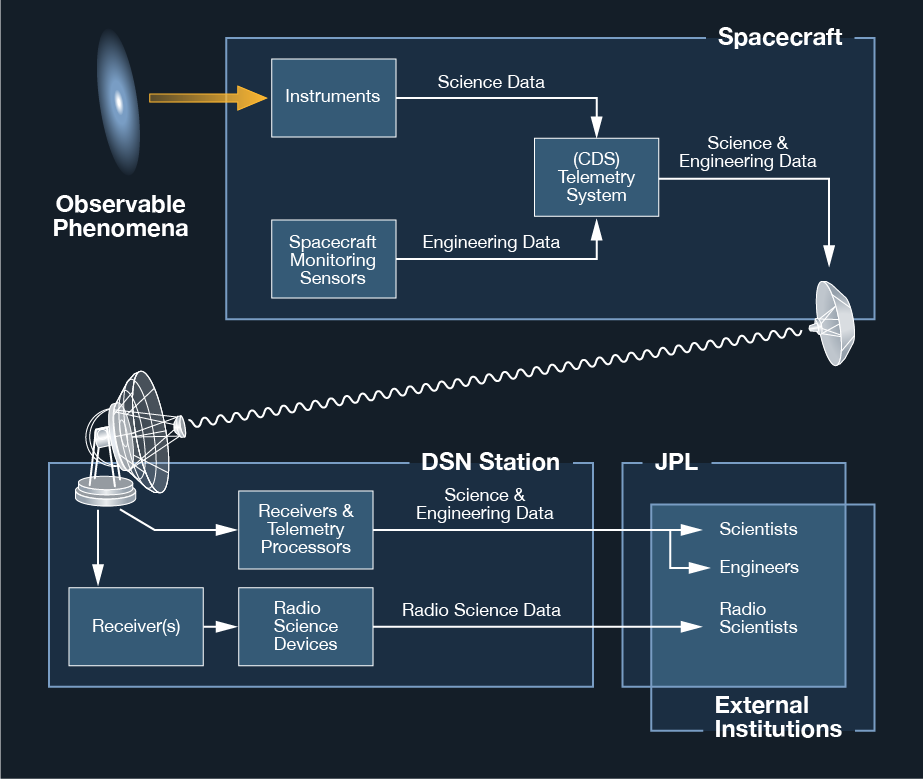
Data acquired by the spacecraft's scientific instruments and telemetered to Earth, or acquired by ground measurements of the spacecraft's radio signal in the case of Radio Science, in support of scientific experiments, is referred to as science data. (Please see the editorial page for discussion of collective vs. plural "data.") Science data is the reason for flying a spacecraft.
The other category of data telemetered from a spacecraft, its health and status data such as temperatures, pressures, voltages, and computer states, is referred to as engineering data. This is normally of a more repetitive nature, and if some is lost, the same measurement of pressure or temperature can be seen again in a short time.
Except in cases of spacecraft anomalies or critical tests, science data is always given a higher priority than engineering data, because it is a mission's end product. Engineering data is used in carrying out spacecraft operations involved in obtaining the science data.
The Science Data Pipeline
Science data from on-board instruments, once received at the antennas of the DSN, flows through a string of computers and communications links known collectively as the Deep Space Mission System (DSMS), formerly called the Ground Data System (GDS). The functions of the DSMS can be viewed as generally divided into two high-level segments: front-end and back-end.
Front-end processing consists of frame-synchronizing the data stream (discussed further in Chapter 18), restoring the data formats that were created by the spacecraft computers, and providing real-time visibility of engineering and tracking data for engineering analysts and science instrument teams. Back-end processing consists of data management to provide complete and catalogued data sets, production of data products such as images, and use of tools to access the data storage and cataloguing systems.
While there is typically some front-end visibility into some of the science data in real time, it is mainly through the back end systems that science teams (for whom the missions are flown) formally have access to complete sets of their science data.
Data Gaps
When science data is first received and stored by the data management system, it is common for some segments to be missing. A data management team or individual determines what gaps exist and whether or not they're recoverable.
- Data that is easily recoverable has reached the ground and was stored either at a DSN station or at some intermediate subsystem in the DSMS front end. The data may have been missing from the back end due to some failure in the pipeline. Once identified and located recovered data can be transferred to the data management system storage and integrated with data received earlier. This is typically a highly automated protocol or process.
- The problem is more complicated if DSN station problems or sudden rain over a station prevented reception of the data. In such cases, if it is of great value, the project may be able to recover it by commanding the spacecraft to replay a specific portion from its on-board storage subsystem before it gets overwritten.
Final science data products usually consist of time-ordered, gap-controlled sets of instrument-specific data records known as Experiment Data Records (EDRs). Other products that support analysis of the science data include collections of DSN monitor data which indicates the performance of DSN receivers, tracking and telemetry equipment, selected spacecraft engineering data, spacecraft ephemeris and pointing data. These are known as Supplementary Experiment Data Records (SEDRs) or the equivalent. SEDRS track the history of instrument pointing (discussed in Chapter 12), detailing the instrument's "footprint" on the object being imaged.
Spacecraft, Planet, Instruments, C-matrix, and Events (SPICE) kernels (files) provide spacecraft and planetary ephemerides, instrument mounting alignments, spacecraft orientation, spacecraft sequences of events, data needed for certain time conversions, etc. SPICE kernels are produced by the JPL Navigation and Ancillary Information Facility (NAIF) and are archived by the PDS NAIF Node. Related files include the Spacecraft and Planet ephemeris data Kernel (SpK), and the Planet Physical and Cartographic Constraints PcK Kernel.
Science data products have historically been produced within the Data Management Systems of flight projects. Cassini uses an example of a new, more distributed plan that calls for its diverse science teams to produce most or all the science data products after compilation and analysis. Cassini's small Data Management Team performs only those data management functions needed to deliver complete data sets to the science teams.
Radio Science
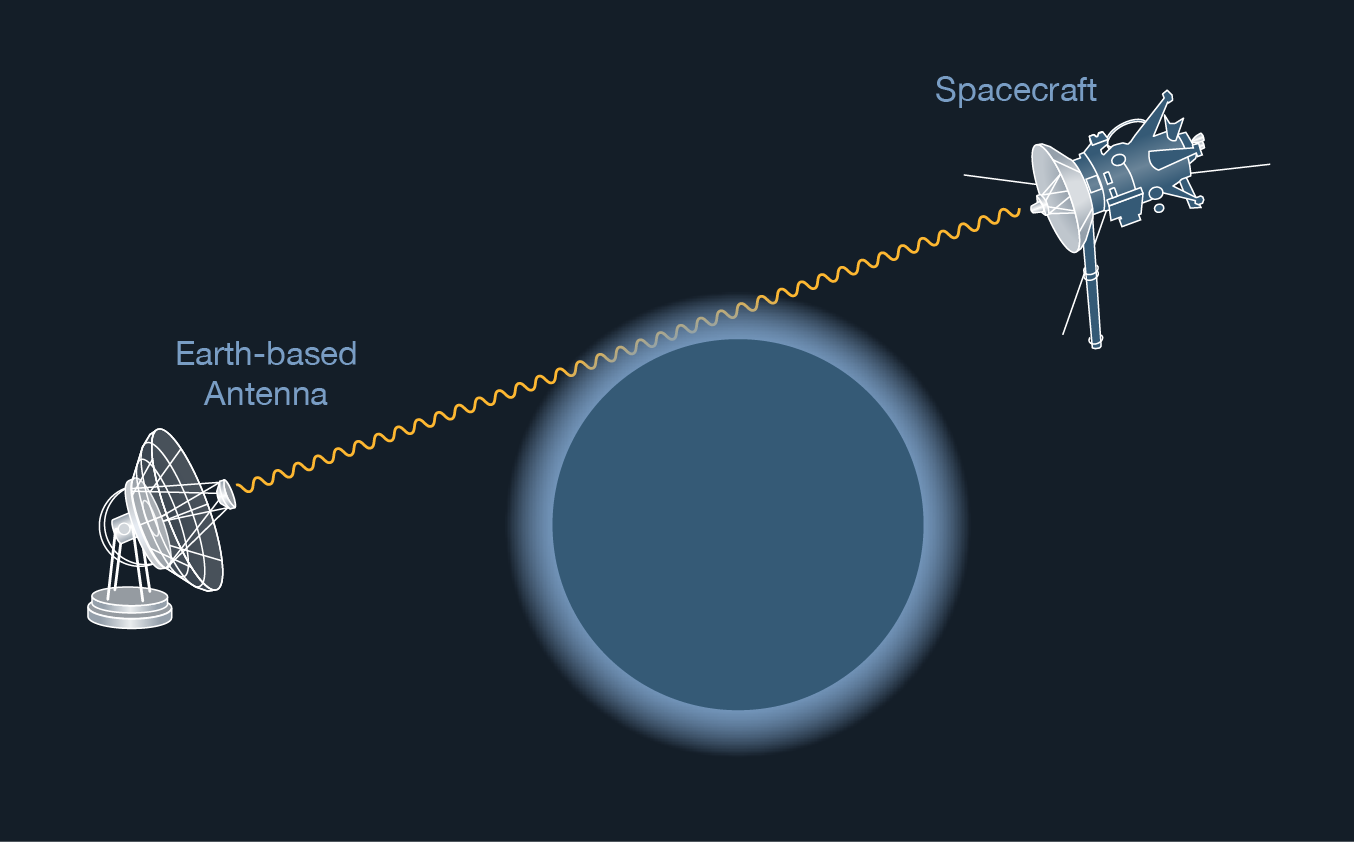
Radio science (RS) experiments use the spacecraft radio and the DSN together as their instrument, rather than using only an instrument aboard the spacecraft. They record the attenuation, scintillation, refraction, rotation, Doppler shifts, and other direct modifications of the radio signal as it is affected by the atmosphere of a planet, moons, or by structures such as planetary rings or gravitational fields. From these kinds of data, radio scientists are able to derive a great deal of information such as the structure and composition of an atmosphere and particle sizes in rings.
Occultations
One RS experiment can take place when a spacecraft passes behind a ring system. The spacecraft keeps its radio signal trained on Earth, and effects of ring particles can be detected in the signal. Passing behind a planet or a planet's atmosphere, the spacecraft may be commanded to rotate so that its radio signal remains trained on the "virtual Earth," the point where refraction makes the signal bend toward Earth.
Solar Corona
The "atmosphere" of the Sun is another target of great interest which can be observed by Radio Science when a spacecraft is near superior conjunction. The solar corona causes scintillation, rotation, and other effects on the spacecraft's radio signal which can be measured while a spacecraft is within a few tens of degrees from the Sun as viewed from Earth. This data is useful for investigating the nature and behavior of the solar corona.
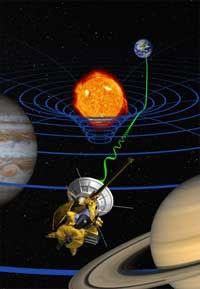
Also when a spacecraft is near superior conjunction, Radio Science experiments may be conducted to quantify the general-relativistic gravitational bending (also called gravitational lensing) imposed on the spacecraft's radio link as it grazes the Sun. Such bending results in a slight increase in the apparent distance to the spacecraft. This predicted GR effect was first confirmed in 1919 during a solar eclipse by observing the shift in the apparent positions of stars in the Hyades cluster visible near the eclipsed solar disc.
Gravitational Waves
Another RS experiment is the gravitational wave search, or gravitational wave experiment (GWE). Gravitational waves are predicted by general relativity, but as of early 2013 they have never been detected directly. Measuring minute Doppler shifts of a spin-stabilized spacecraft or a reaction-wheel-stabilized spacecraft in interplanetary space over long periods of time might yield the discovery. Spacecraft such as Voyager, which are stabilized by thruster bursts, cannot participate. The spacecraft's distance would be observed to increase and then decrease on the order of millimeters as a gravitational wave passes through the solar system. Even if these gravitational wave searches have negative results, this information is scientifically useful because it places limits on the magnitude of long-wavelength gravitational waves. Dedicated observatories on Earth and in space are being readied to participate in the search for gravitational radiation.
Celestial Mechanics
Another RS experiment can determine the mass of an object like a planet or satellite. When nearing the body, the experiment measures the minute acceleration its gravitation exerts on the spacecraft. This acceleration is translated into a measurement of the body's mass. Once the mass is known, by the way, the object's density can be determined if images are available that show the body's size. Knowing the density provides powerful clues to a body's composition.
Gravity Field Surveys
Another science experiment, like radio science but not strictly classified as such, does not use an instrument aboard the spacecraft.
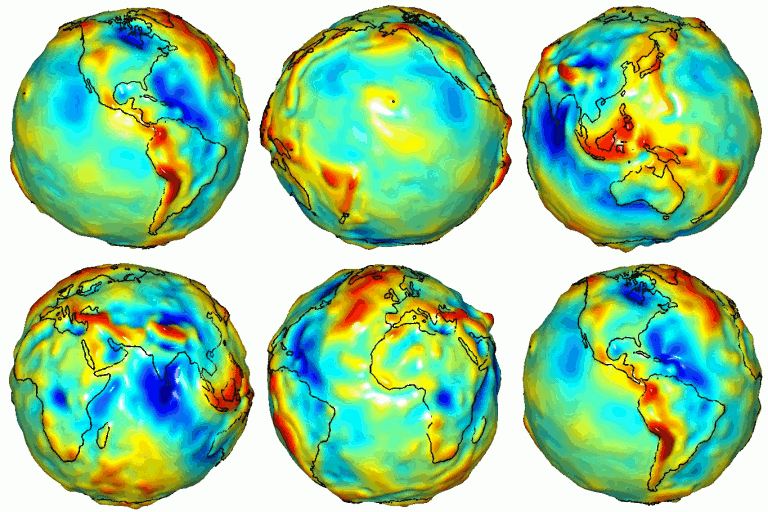
Gravity field surveys (not to be confused with gravitational wave searches) use the spacecraft's radio and the DSN to measure minute Doppler shifts of a vehicle in planetary orbit. After subtracting out the Doppler shifts induced by planetary movement, the spacecraft's primary orbital motion, and small force factors such as the solar wind and atmospheric friction, the residual Doppler shifts are indicative of small spacecraft accelerations and decelerations.
These are evidence for variations in the planet's gravity field strength associated with high and low concentrations of mass at and below the planet's surface. Mapping the planet's mass distribution in this way yields information that complements other data sets such as imaging or altimetry in the effort to understand geologic structure and processes at work on the planet. A prime example of Gravity Field Surveys was the 2012 GRAIL mission, which yielded high-resolution data for the Moon. Gravity field surveying is further described in Chapter 16.
Dissemination of Results
Publication of the results of the experiments takes place in the literature of the scientific community, notably the journals Science (American Association for the Advancement of Science, AAAS), Nature, the International Weekly Journal of Science, JGR(Journal of Geophysical Research, a publication of the American Geophysical Union), and Icarus, an official publication of the Division for Planetary Sciences of the American Astronomical Society.
Experimenters whose instruments ride aboard JPL spacecraft make presentations at virtually every periodic convention of the various scientific organizations, such as those mentioned above. If an operations person has an opportunity to attend one or more, it would be very worthwhile. The news media and several magazines keep a close eye on all of these journals and proceedings and report items of discovery from them. The thin weekly magazine Science News is a notable example, as is the amateur astronomers' monthly Sky & Telescope magazine. Splendid photography from JPL's missions occasionally appears in National Geographic magazine, and many a JPL mission has enjoyed very good treatment in public television's science series Nova and documentaries on cable TV's Discovery channel.
Regional Planetary Imaging Data Facilities (RPIF) are operated by NASA's Planetary Data System (PDS) at over a dozen sites around the United States and overseas. Each maintains a complete photographic library of images from NASA's lunar and planetary missions. They are open to members of the public by appointment for browsing, and their staff can assist individuals in selecting and ordering materials. All of NASA's planetary imaging data is made available for researchers who are funded by NASA, in photographic format and digital data format, via the PDS.
Educators may obtain a wide variety of materials and information from NASA's flight projects through the network of Educator Resource Centers (ERC) in cooperation with educational institutions around the country. ERCs also support a center for distribution of multimedia resource materials for the classroom, called Central Operation of Resources for Educators (CORE). JPL's Education website offers more information about various avenues for information dissemination.


