


Nitrogen Dioxide and Sulfur Dioxide Over Canadian Oil Sands
Data from the Ozone Monitoring Instrument (OMI) show distinct enhancements in nitrogen dioxide (NO2) and sulfur dioxide (SO2) over a region of surface mining in the Canadian oil sands.
The oil sands are located in the north-east corner of the province of Alberta, Canada and contain the second largest reserve (after Saudi Arabia) of oil globally.
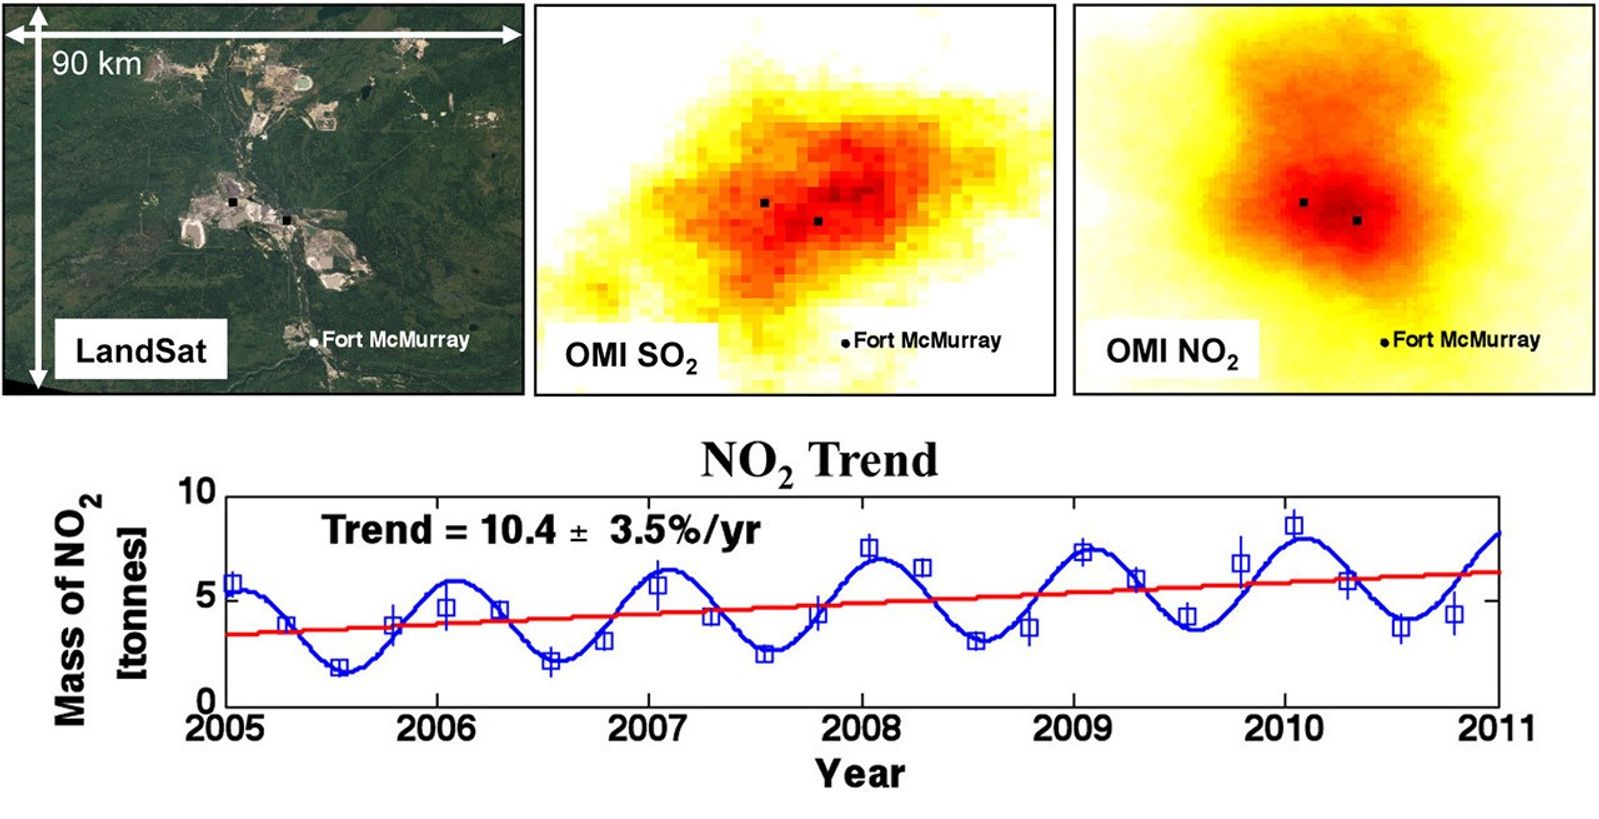
It is expected that oil production will double and annual capital investments will reach $20B by 2020 further highlighting the need for monitoring pollution in this area. These results make use of improved mapping techniques able to resolve detail down to 10 km. These are the first satellite-based results of pollution over the oil sands.
Significance: This is a first study of the abundance of NO2 and SO2 over the Canadian oil sands, based on UV/visible nadir-viewing satellite instruments. A trend in the mass of the NO2 enhancement-the quantity most representative of NO2 emissions-of 10.4±3.5%/yr (2005-2010) was found to result from increases in both the maximum pollution levels and the total area of the enhancement. SO2 pollution values over the oil sands are similar as those of large power plants. This highlights the importance of satellite observations in providing a macroscopic or comprehensive view.
Relevance for future science: Aura OMI will continue monitoring anthropogenic NO2 and SO2 pollution sources from space to detect trends in aerosol and ozone precursors to provide an overlap with ESA Sentinel-5 precursor mission (TropOMI) planned to launch in 2015. The Decadal Survey recommended the Geostationary Coastal and Air Pollution Events (GEO-CAPE) tier 2 mission, which is planned to launch after 2020. It will allow more frequent monitoring of anthropogenic NO2 and SO2 pollution over N. America, including the oil sands region.
A next generation, OMI-like sensor is being considered by the Canadian Space Agency for inclusion on the Polar Communication and Weather (PCW) mission scheduled for launch in 2018. It would monitor SO2 pollution over the Arctic and sub-Arctic regions.
Data Source:
- Operational PBL SO2 data from the Dutch/Finnish Ozone Monitoring Instrument (OMI) on board the NASA Aura satellite.
- NASA LandSat image obtained from Earth Observatory.
Reference: McLinden, C.A., V. Fioletov, K. F. Boersma, N. Krotkov, C. E. Sioris, J. P.Veefkind, and K. Yang, Air quality over the Canadian oil sands: A first assessment using satellite observations (2011), Geophysical Research Letters, in press, 2011GL050273R. Boersma, K. F., et al. (2011), An improved tropospheric NO2 column retrieval algorithm for the Ozone Monitoring Instrument, Atmos. Meas. Tech., 4, 1905- 1928, doi:10.5194/amt-4-1905-2011. Krotkov, N.A., S. A. Carn, A. J. Krueger, P. K. Bhartia, and K. Yang (2006), Band residual difference algorithm for retrieval of SO2 from the Aura Ozone Monitoring Instrument (OMI), IEEE Trans. Geosci. Remote Sens., 44, 1259-1266.
McLinden, C., et al., (2012), Geophysical Research Letters, in press
02.07.2012
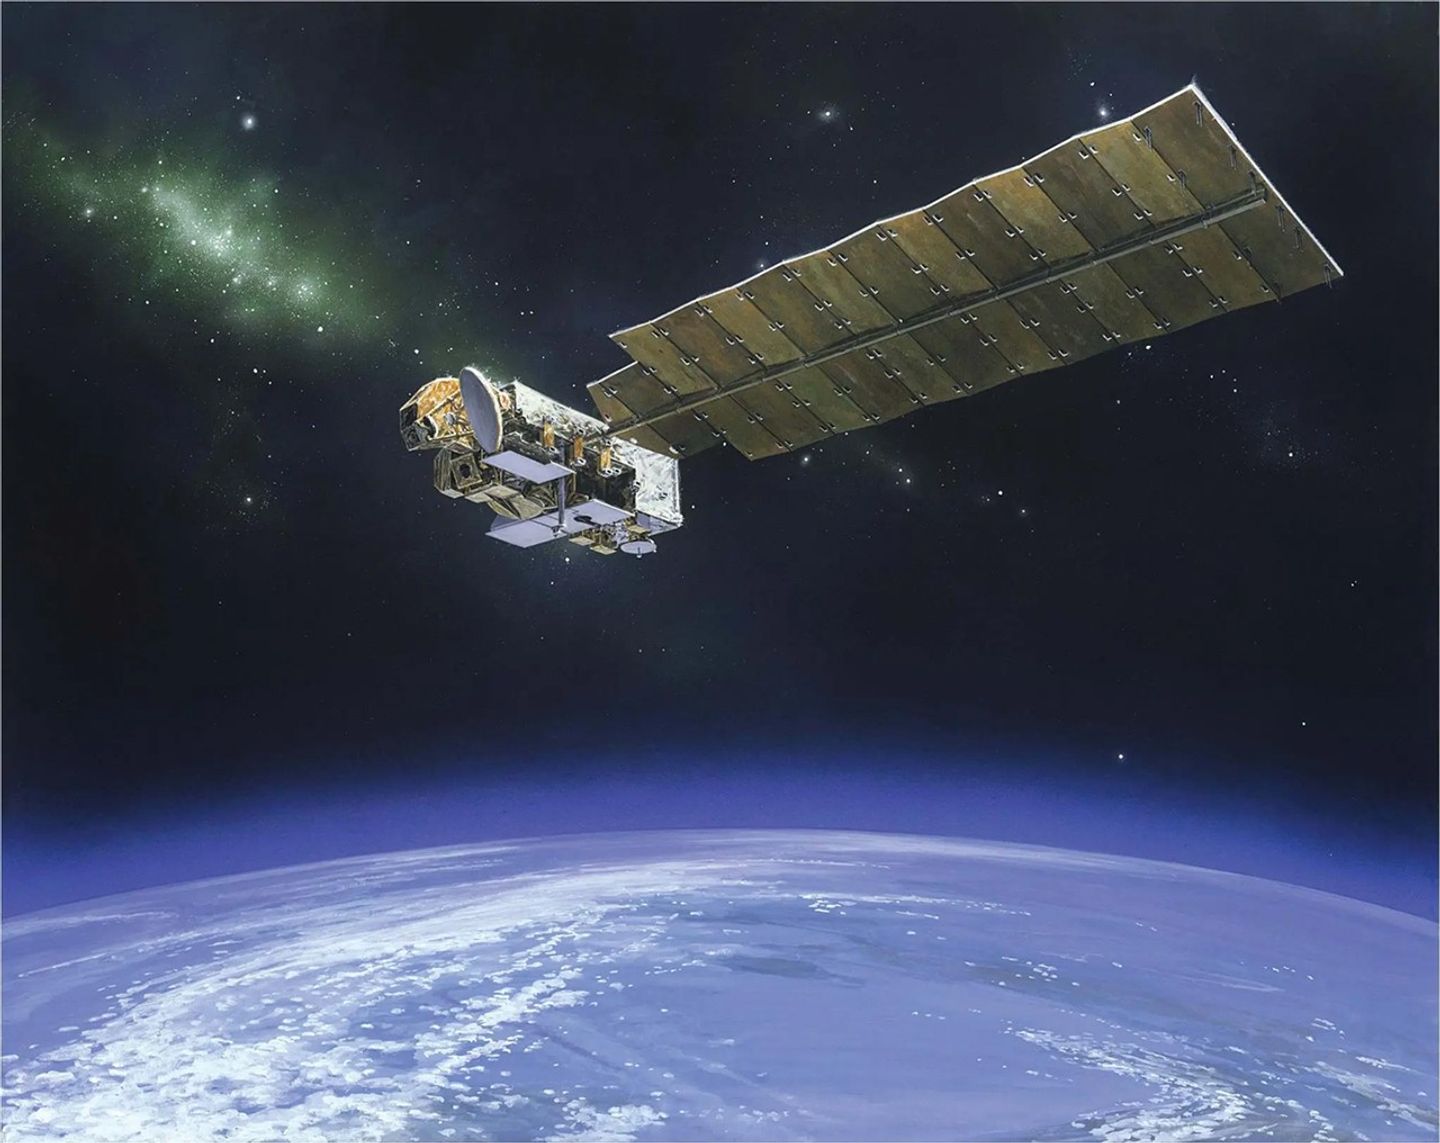
OMI
Aura’s Ozone Monitoring Instrument (OMI) instrument can distinguish between aerosol types, such as smoke, dust, and sulfates, and measures cloud pressure and coverage, which provides data to derive tropospheric ozone.…
Learn More