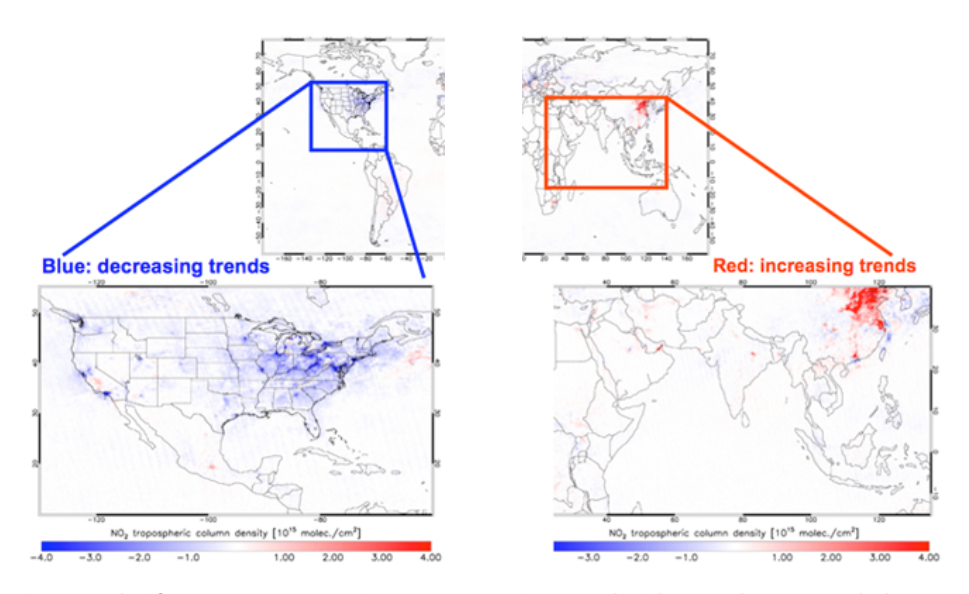
Nitrogen Dioxide Trends
Nitrogen dioxide (NO2) is an Environmental Protection Agency (EPA) criteria pollutant. It contributes to the formation of ground-level ozone. Anthropogenic sources of NO2 include power plants and transportation. Aura's Ozone Monitoring Instrument (OMI) instrument observe the trends in nitrogen dioxide.
Nitrogen dioxide in Southern California is more concentrated in more densely populated urban areas. NO2 forms quickly from emissions from cars, trucks and buses, power plants, and off-road equipment. In addition to contributing to the formation of ground-level ozone, and fine particle pollution, NO2 is linked with a number of adverse effects, particularly affecting the respiratory system.
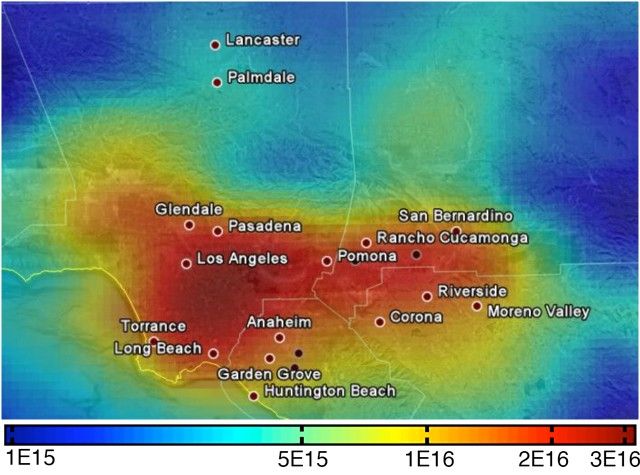
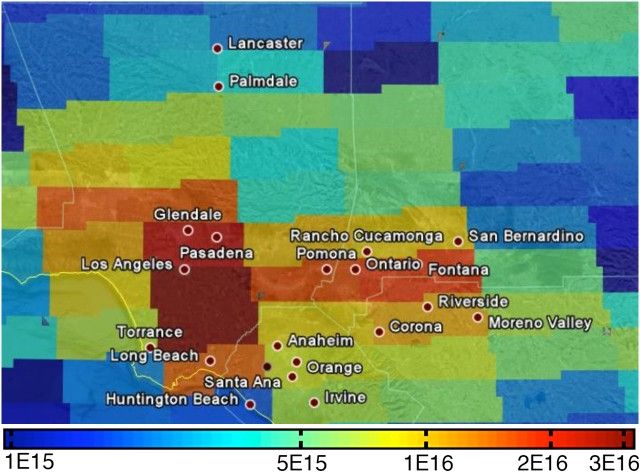
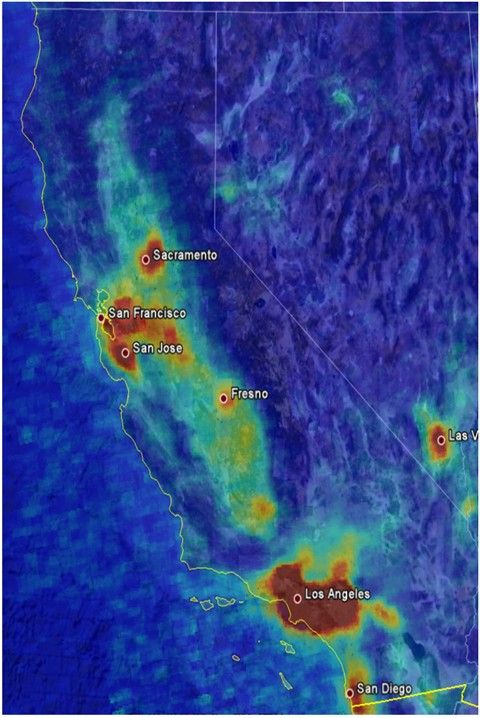


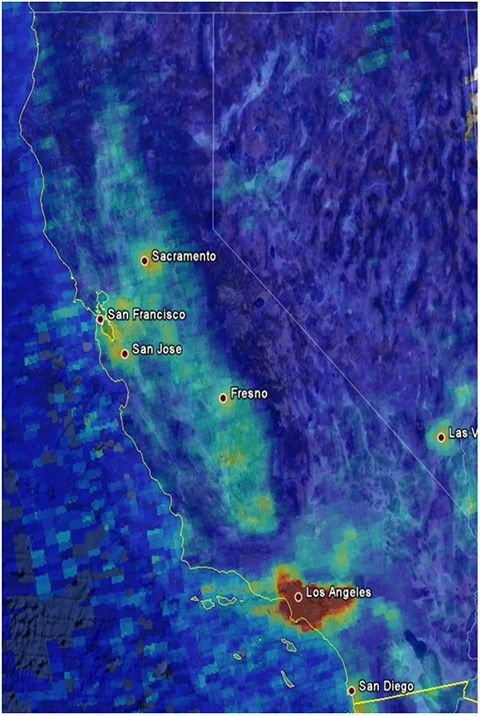
Before and After
Emission Reductions Show Results
Weekday and Weekend Comparison
Air Pollution Controls for Summer Surface Ozone
Ozone Monitoring Instrument (OMI) measurements of formaldehyde (HCHO) and nitrogen dioxide (NO2), and the ratio of HCHO to NO2 show how the data can be used to develop effective strategies to improve air quality.
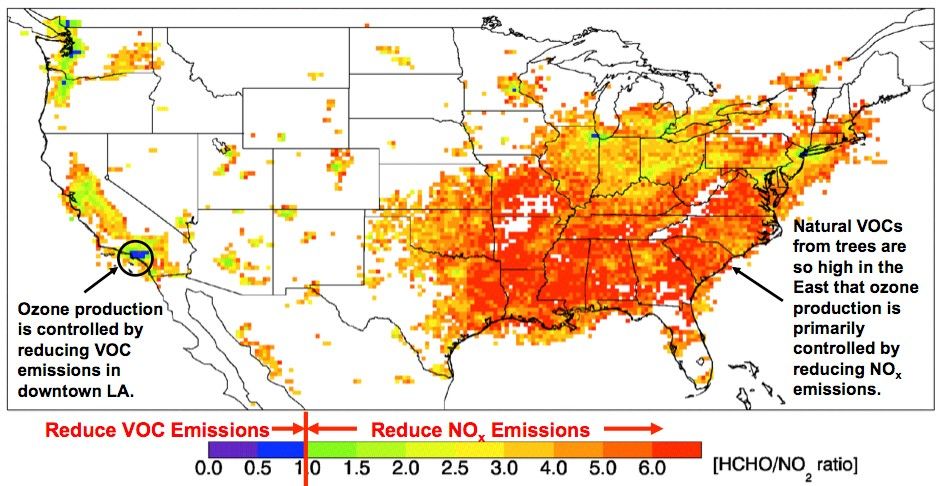
Harmful levels of surface ozone can form through a complex series of reactions involving volatile organic compounds (VOCs) and nitrogen oxides (NOx) in the presence of sunlight. If the ratio HCHO/NO2 is less than 1 (e.g., Los Angeles, Chicago), ozone will decrease when emissions of anthropogenic VOCs are reduced. If the ratio is greater than 2, ozone will decrease when NOx emissions are reduced. Natural VOCs from trees are so high in the eastern United States that reducing NOx emissions is the effective strategy to improve air quality.
10.2009
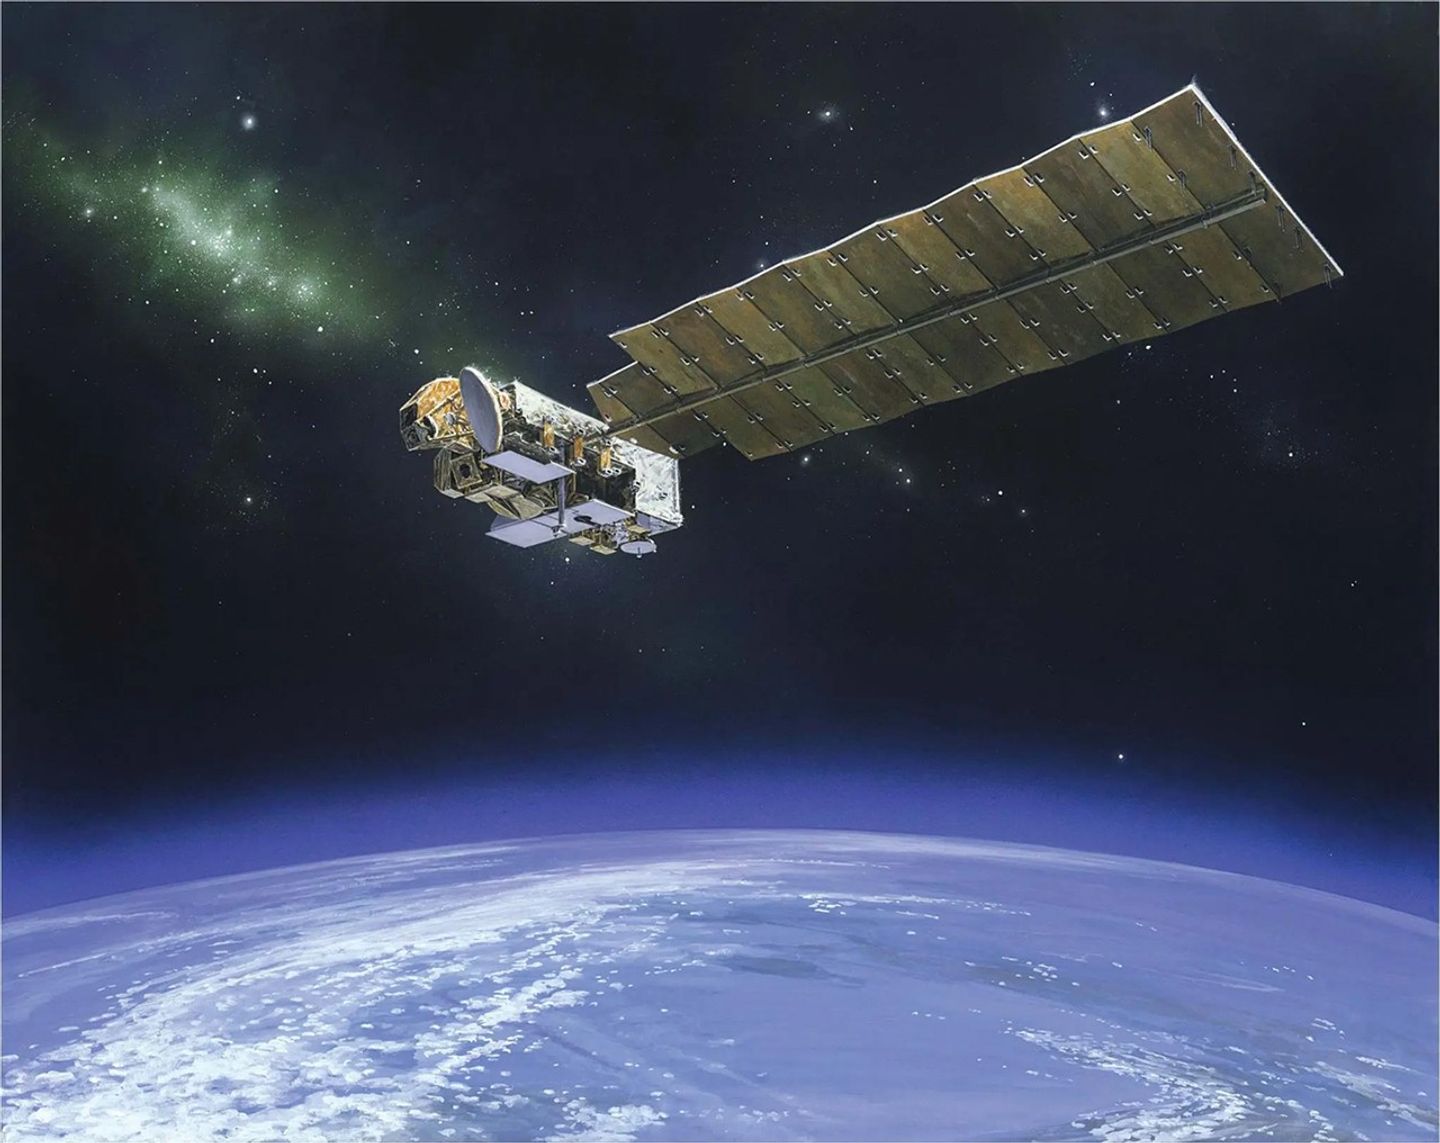
OMI
Aura’s Ozone Monitoring Instrument (OMI) instrument can distinguish between aerosol types, such as smoke, dust, and sulfates, and measures cloud pressure and coverage, which provides data to derive tropospheric ozone.…
Learn More