Quick Facts
Mid-Infrared Instrument (MIRI)
The Mid-Infrared Instrument (MIRI) has both a camera and a spectrograph that sees light in the mid-infrared region of the electromagnetic spectrum. As the only mid-infrared instrument, astronomers rely on MIRI to study cooler objects like debris disks, which emit most of their light in the mid-infrared, and extremely distant galaxies whose light has been shifted into the mid-infrared over time, newly forming stars, and faintly visible comets as well as objects in the Kuiper Belt. MIRI's camera provides wide-field, broadband imaging that continues the breathtaking astrophotography that has made Hubble so universally admired. The spectrograph enables medium-resolution spectroscopy, providing new physical details of the distant objects it observes.
Technical Description
The Mid-Infrared Instrument (MIRI) provides JWST observers with coverage of mid-infrared wavelengths from 4.9 to 28.8 μm. Imaging can be obtained with 9 broad-band filters covering the wavelength ranges from 5.6μm to 25.5 μm. Spectroscopy can be obtained with a low spectral resolving power mode from 5 to 12 μm that includes both slitted and slitless options, or with a medium spectral resolving power integral field unit from 4.9 μm to 28.8 μm. MIRI also contains one Lyot and three 4-quadrant phase mask coronagraphs that are optimized to the mid-infrared spectral region.
Components
- Camera: captures two-dimensional images of regions of space.
- Spectrograph : spreads light out into a spectrum so that the brightness of each individual wavelength can be measured.
- Coronagraph : opaque disks used to block the bright light of stars in order to detect the much fainter light of planets and debris disks orbiting the star.
- Integral Field Unit (IFU): is a combination of camera and spectrograph used to capture and map spectra across a field of view in order to understand variation over space.
Wavelength
MIRI is designed to capture light ranging in wavelength from 4.9 to 28.8 microns (mid-infrared).
Field of View
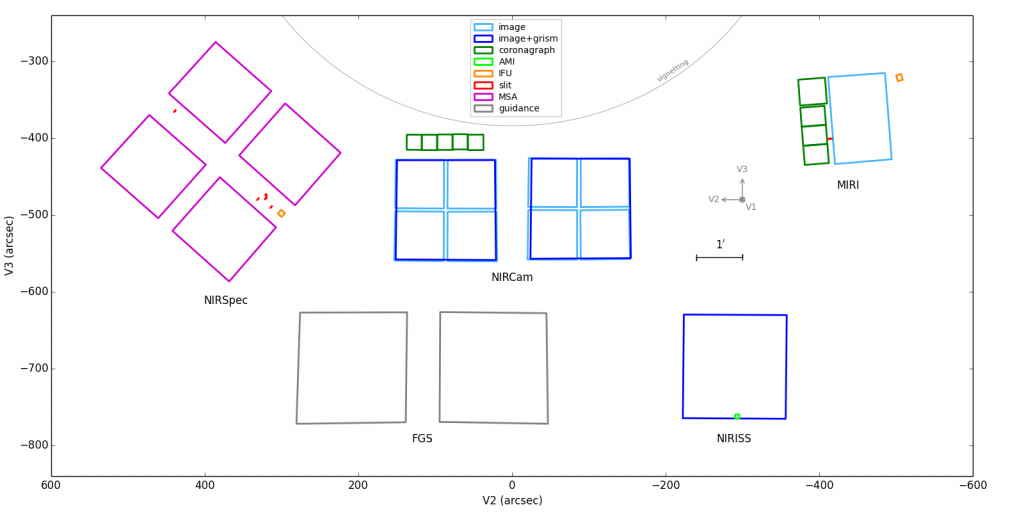
An instrument’s field of view is the amount of sky that it can observe at any given point in time. (The actual area that can be observed depends on the distance of the object being observed.) In this graphic, a Hubble Space Telescope image of the Whirlpool Galaxy (M51) is shown for scale. The image covers an area of 9.6 × 6.6 arcminutes. (The full Moon has a diameter of about 31 arcminutes across the sky.) MIRI’s main field of view is 1.2 × 1.9 arcminutes. The fields of view of its coronagraphs and IFU are smaller.
Imaging Modes
- Standard Imaging: is the equivalent to basic digital photography and involves capturing pictures of a wide variety of objects and materials in space that emit or reflect infrared light.
- Coronagraphic Imaging: (sometimes called high-contrast imaging) involves using a coronagraph to block the light of a star in order to reveal the much dimmer light of nearby objects, such as exoplanets and debris disks.
- Time-series Imaging: involves capturing a series of images at regular intervals in order to measure changes over time. Time-series can be used to track changes in the brightness of a star or can be combined with coronagraphic imaging to track the motion of a planet.
Spectroscopy Modes
- Single-Object Slitless Spectroscopy : involves capturing the spectrum of a single bright object like a star in a field of view.
- Slitted Spectroscopy: provides the ability to capture the spectrum of a single object—a single star, a single exoplanet, or a single distant galaxy—in a wide field of view. Single slit spectroscopy is also used to analyze the spectrum of a small area of an object that is large in the field of view, such as a galaxy or planet.
- Integral Field Unit Spectroscopy (IFU): involves a combination of imaging and spectroscopy. During an IFU observation, the instrument captures an image of the field of view along with individual spectra of each pixel in the field of view. IFU observations allow astronomers to investigate how properties—such as composition, temperature, and motion—vary between different objects such as stars in a crowded star field, or from place to place over a large region of space such as a galaxy or nebula.
- Time-series Spectroscopy: involves capturing the spectrum of an object or region of space at regular intervals in order to observe how the spectrum changes over time. Time-series spectroscopy is used to study planets as they transit their stars.
MIRI Development Gallery
Gallery of the development, testing and commissioning of the MIRI in reverse chronological order.
The image below is a SLIDESHOW. Hover over the image to see the image title and controls. Click the image to go to a detail page with more info and the ability to download the image at various resolutions (click downward arrow in lower right corner).
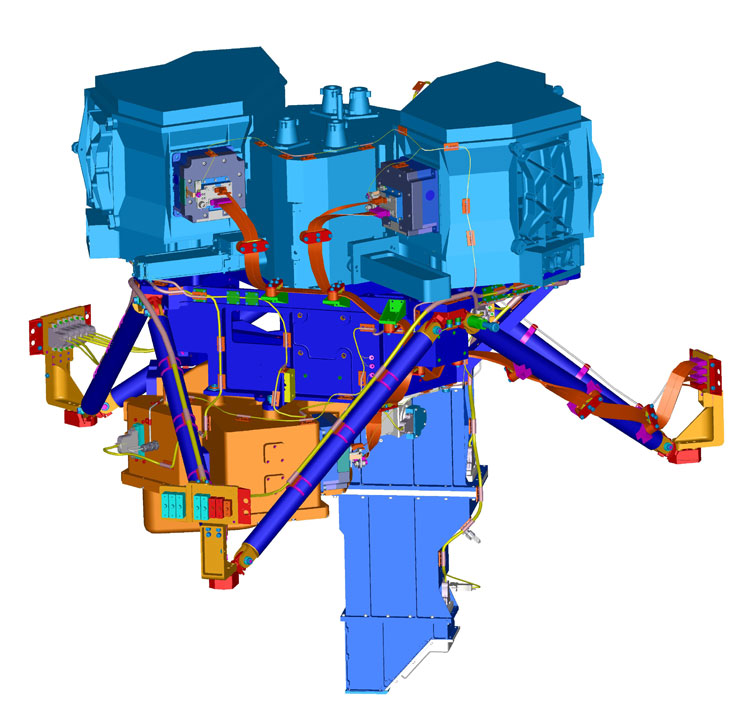
Video: MIRI 3d Diagram Rotation
MIRI Development Team
MIRI was developed by an international collaboration of NASA and ESA including a European Consortium (EC), the Jet Propulsion Laboratory (JPL) and an international science team. The EC constructed and delivered the MIRI optical system and JPL was responsible for the detectors (three 1024 X 1024 Si:As IBC devices), data chain, and flight software. The European MIRI Principal Investigator is Gillian Wright (UK Astronomy Technology Centre), and the U.S. Principal Investigator is George Rieke (University of Arizona). The MIRI Instrument Scientists are Alistair Glasse at UKATC and Michael Ressler at JPL.
James Webb Space Telescope's Mid-Infrared Instrument (or MIRI) in the
giant clean room at NASA's Goddard Space Flight Center in Greenbelt, Md. and gave it
a clean bill of health after its transatlantic journey from the U.K. Credit: NASA/Chris Gunn

