


Spectroscopy 101 – How Absorption and Emission Spectra Work
Why do different elements have different spectral patterns?
Let’s go back to simple absorption and emission spectra. We can use a star’s absorption spectrum to figure out what elements it is made of based on the colors of light it absorbs. We can use a glowing nebula’s emission spectrum to figure out what gases it is made of based on the colors it emits. We can do both of these because each element has its own unique spectrum.
| An element’s spectrum is like its fingerprint, its autograph, its barcode. |
|---|
| Why is this? Let’s take a look at hydrogen, the most abundant element in the universe. |
Absorption of Light by Hydrogen
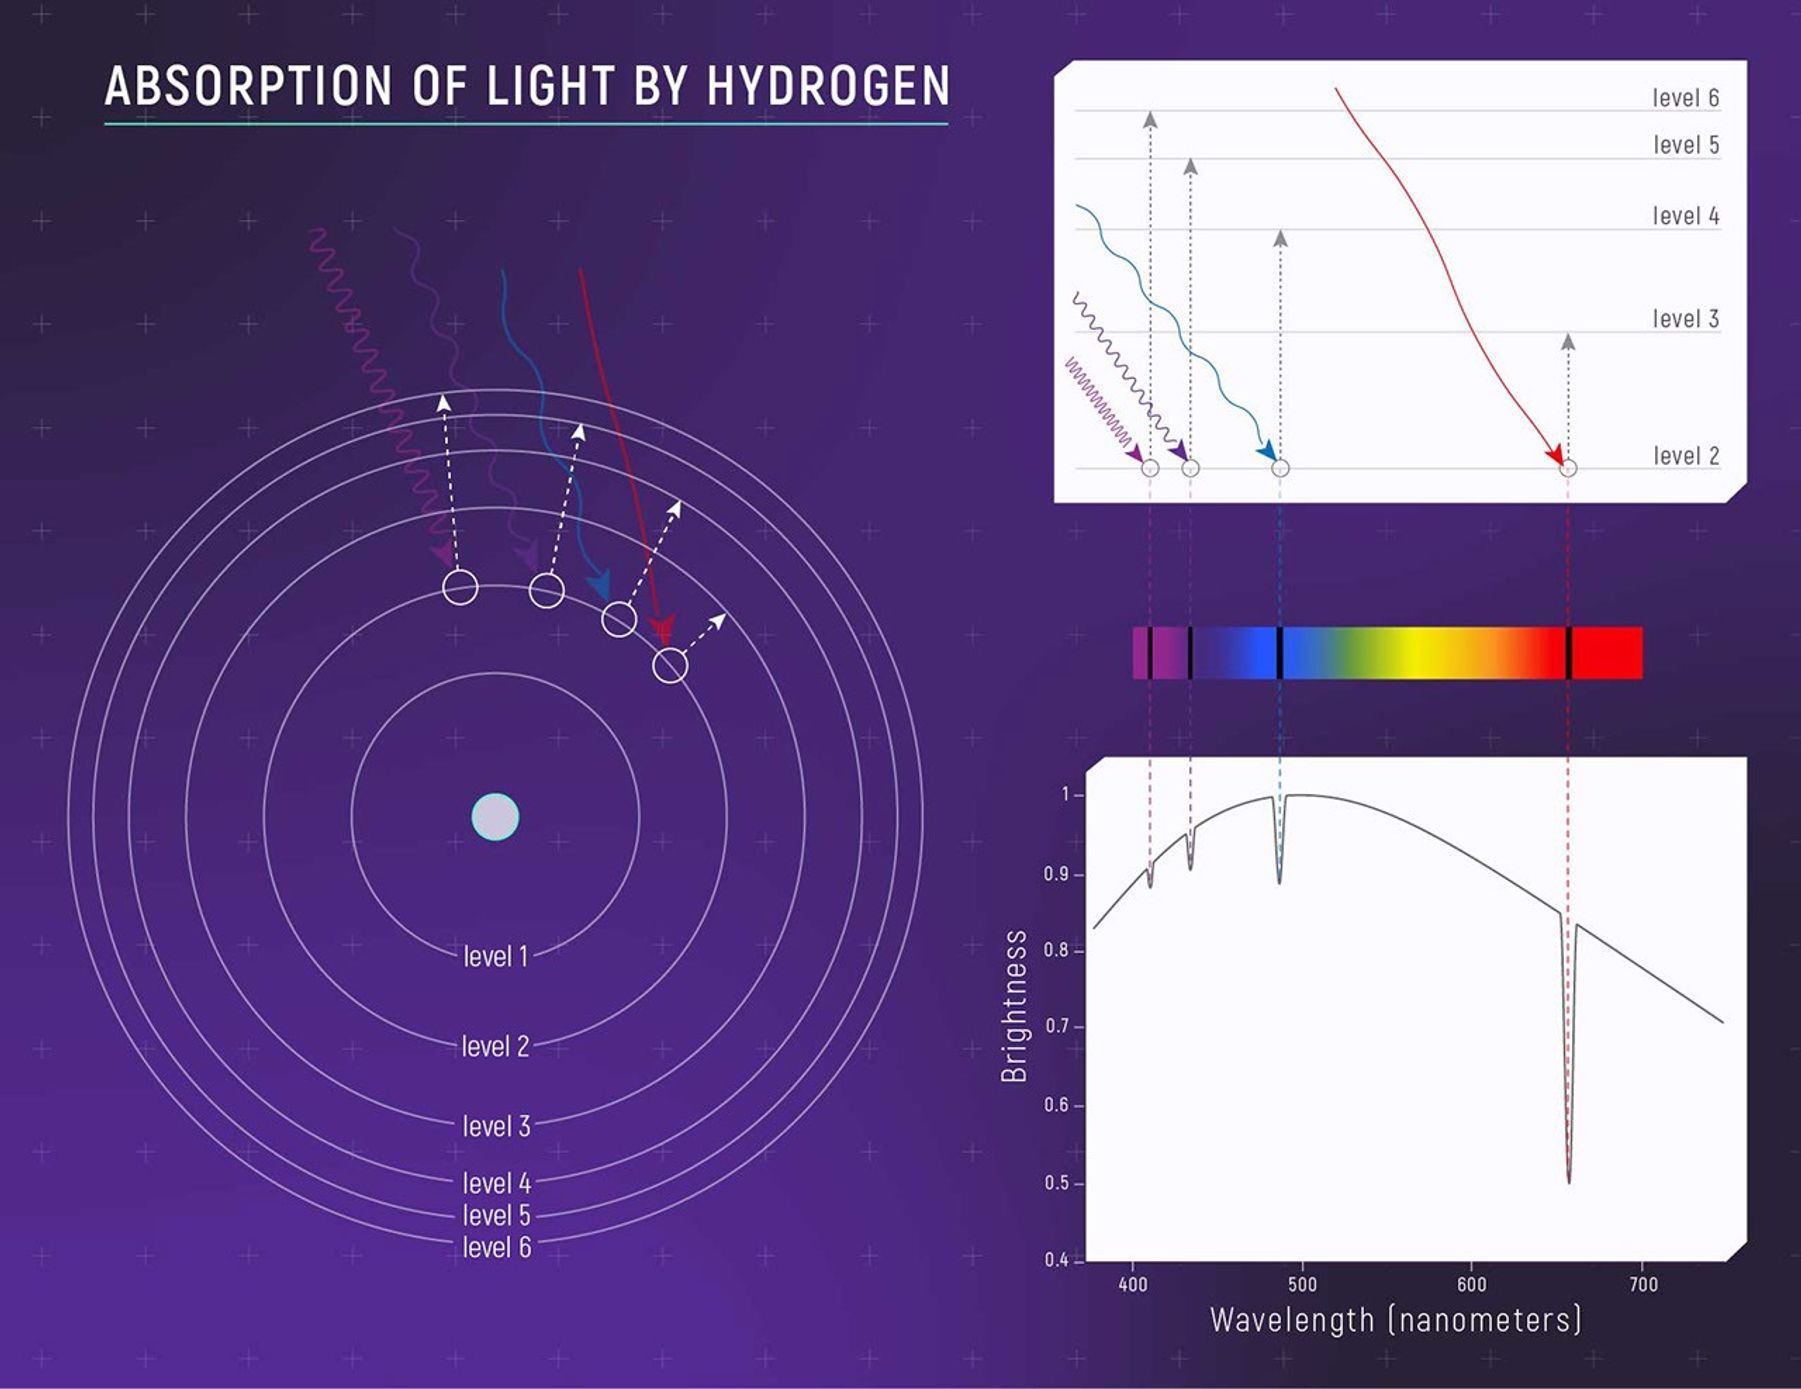
A hydrogen atom is very simple. It consists of a single proton in the nucleus, and one electron orbiting the nucleus. When a hydrogen atom is just sitting around without much energy, its electron is at the lowest energy level. When the atom absorbs light, the electron jumps to a higher energy level (an “excited state”). It can jump one level or a few levels depending on how much energy it absorbs.
The interesting thing is that the electron can move only from one energy level to another. It can’t go partway between levels. In addition, it takes a very discrete amount of energy—no more, no less—to move the electron from one particular level to another.
The energy that an electron needs in order to jump up to a certain level corresponds to the wavelength of light that it absorbs. Said in another way, electrons absorb only the photons that give them exactly the right energy they need to jump levels. (Remember when we said that photons only carry very specific amounts of energy, and that their energy corresponds to their wavelength?)
The absorption spectrum of hydrogen shows the results of this interaction. In the visible part of the spectrum, hydrogen absorbs light with wavelengths of 410 nm (violet), 434 nm (blue), 486 nm (blue-green), and 656 nm (red). Each of the absorption lines corresponds to a specific electron jump. The shortest wavelength/highest energy light (violet 410 nm) causes the electron to jump up four levels, while the longest wavelength/lowest energy light (red 656 nm) causes a jump of only one level.
Emission of Light by Hydrogen
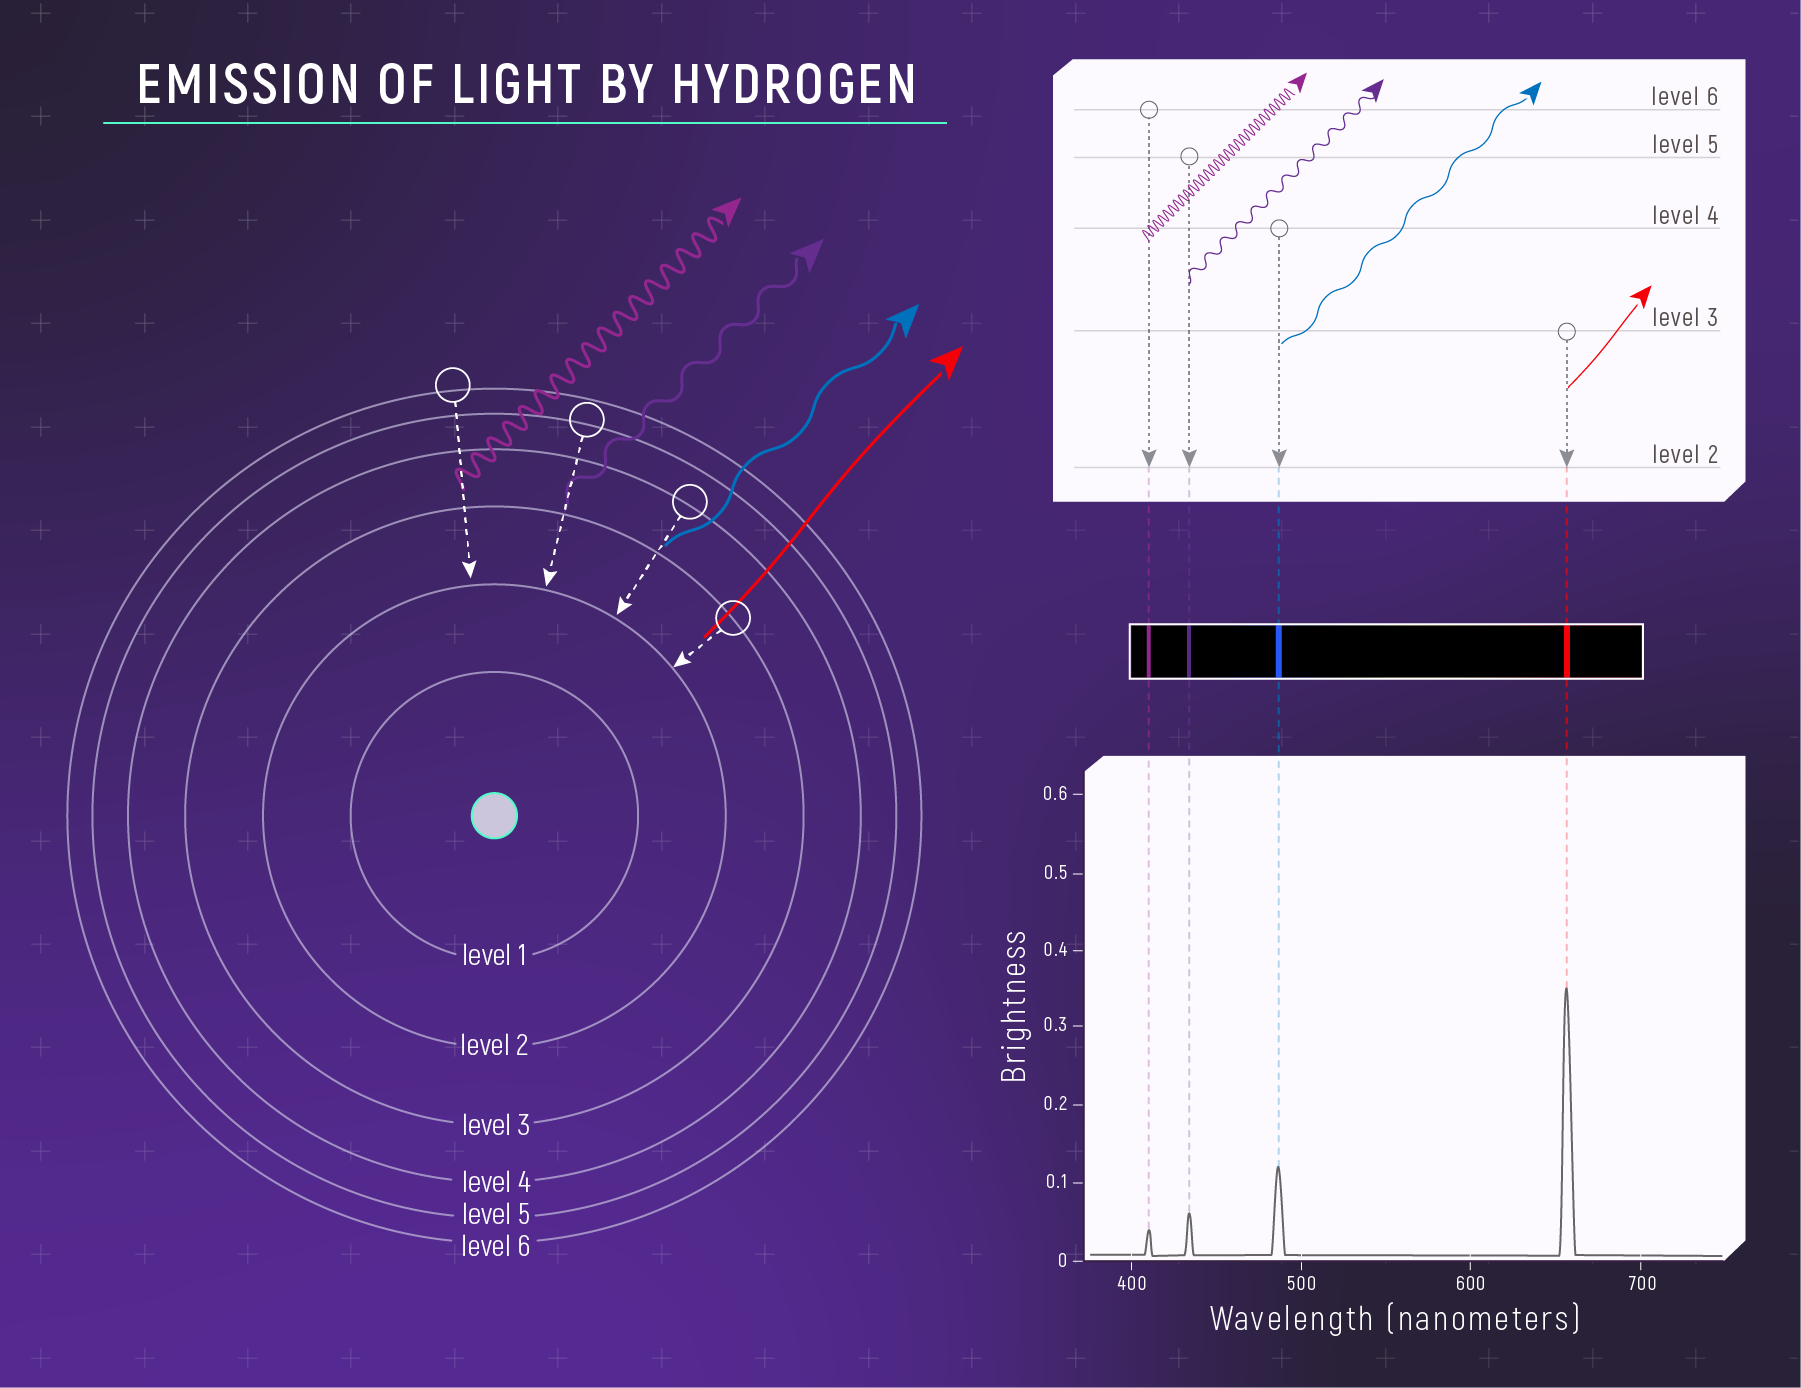
Electrons can also lose energy and drop down to lower energy levels. When an electron drops down between levels, it emits photons with the same amount of energy—the same wavelength—that it would need to absorb in order to move up between those same levels. This is why hydrogen’s emission spectrum is the inverse of its absorption spectrum, with emission lines at 410 nm (violet), 434 nm (blue), 486 nm (blue-green), and 656 nm (red). The highest energy and shortest wavelength light is given off by the electrons that fall the farthest.
Other Atoms and Molecules
Different elements have different spectra because they have different numbers of protons, and different numbers and arrangements of electrons. The differences in spectra reflect the differences in the amount of energy that the atoms absorb or give off when their electrons move between energy levels.
Molecules, like water, carbon dioxide, and methane, also have distinct spectra. Although it gets a bit more complicated, the basic idea is the same. Molecules can absorb specific bands of light, corresponding to discrete changes in energy. In the case of molecules, these changes in energy can be related to electron jumps, but can also be related to rotations and vibrations of the molecules.