


Spectroscopy 101 – Introduction
What is spectroscopy, anyway?
Know what you’re looking for? Jump ahead in the series!
- Part 2: Light and Matter
- Part 3: Types of Spectra and Spectroscopy
- Part 4: How Absorption and Emission Spectra Work
- Part 5: Beyond Temperature and Composition
- Part 6: Invisible Spectroscopy
Astronomers have figured out a lot of very, very specific details about the universe.
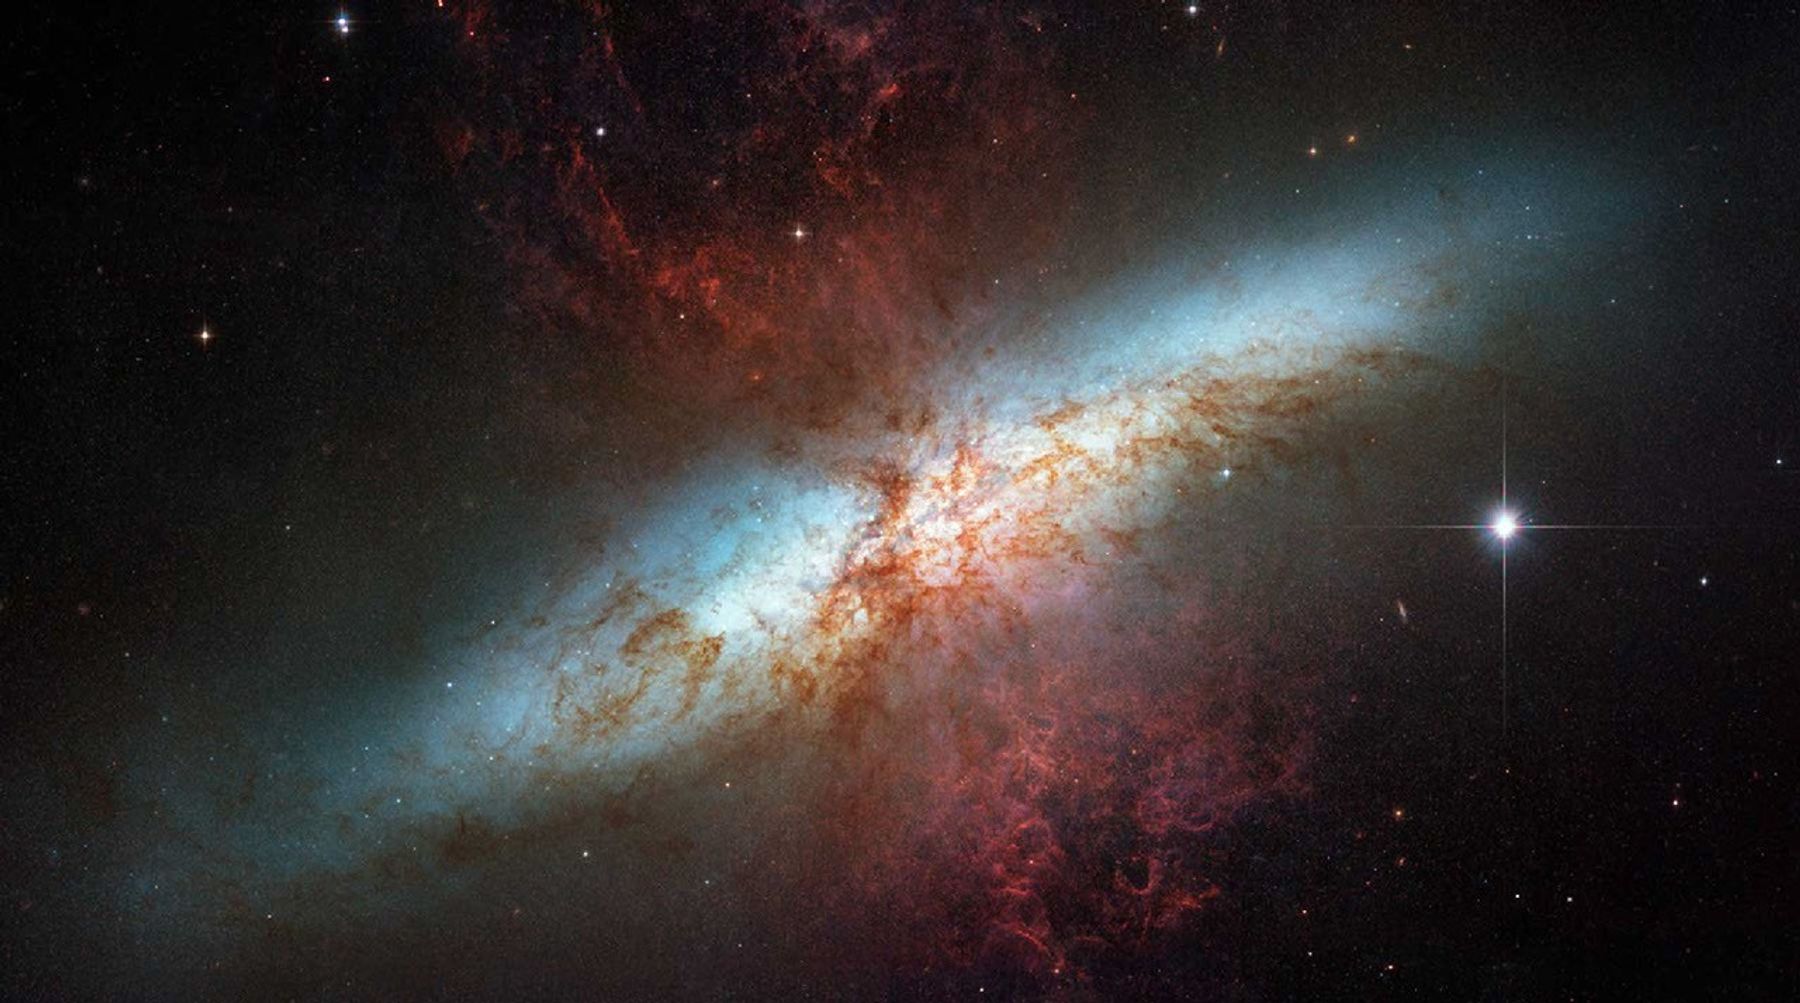
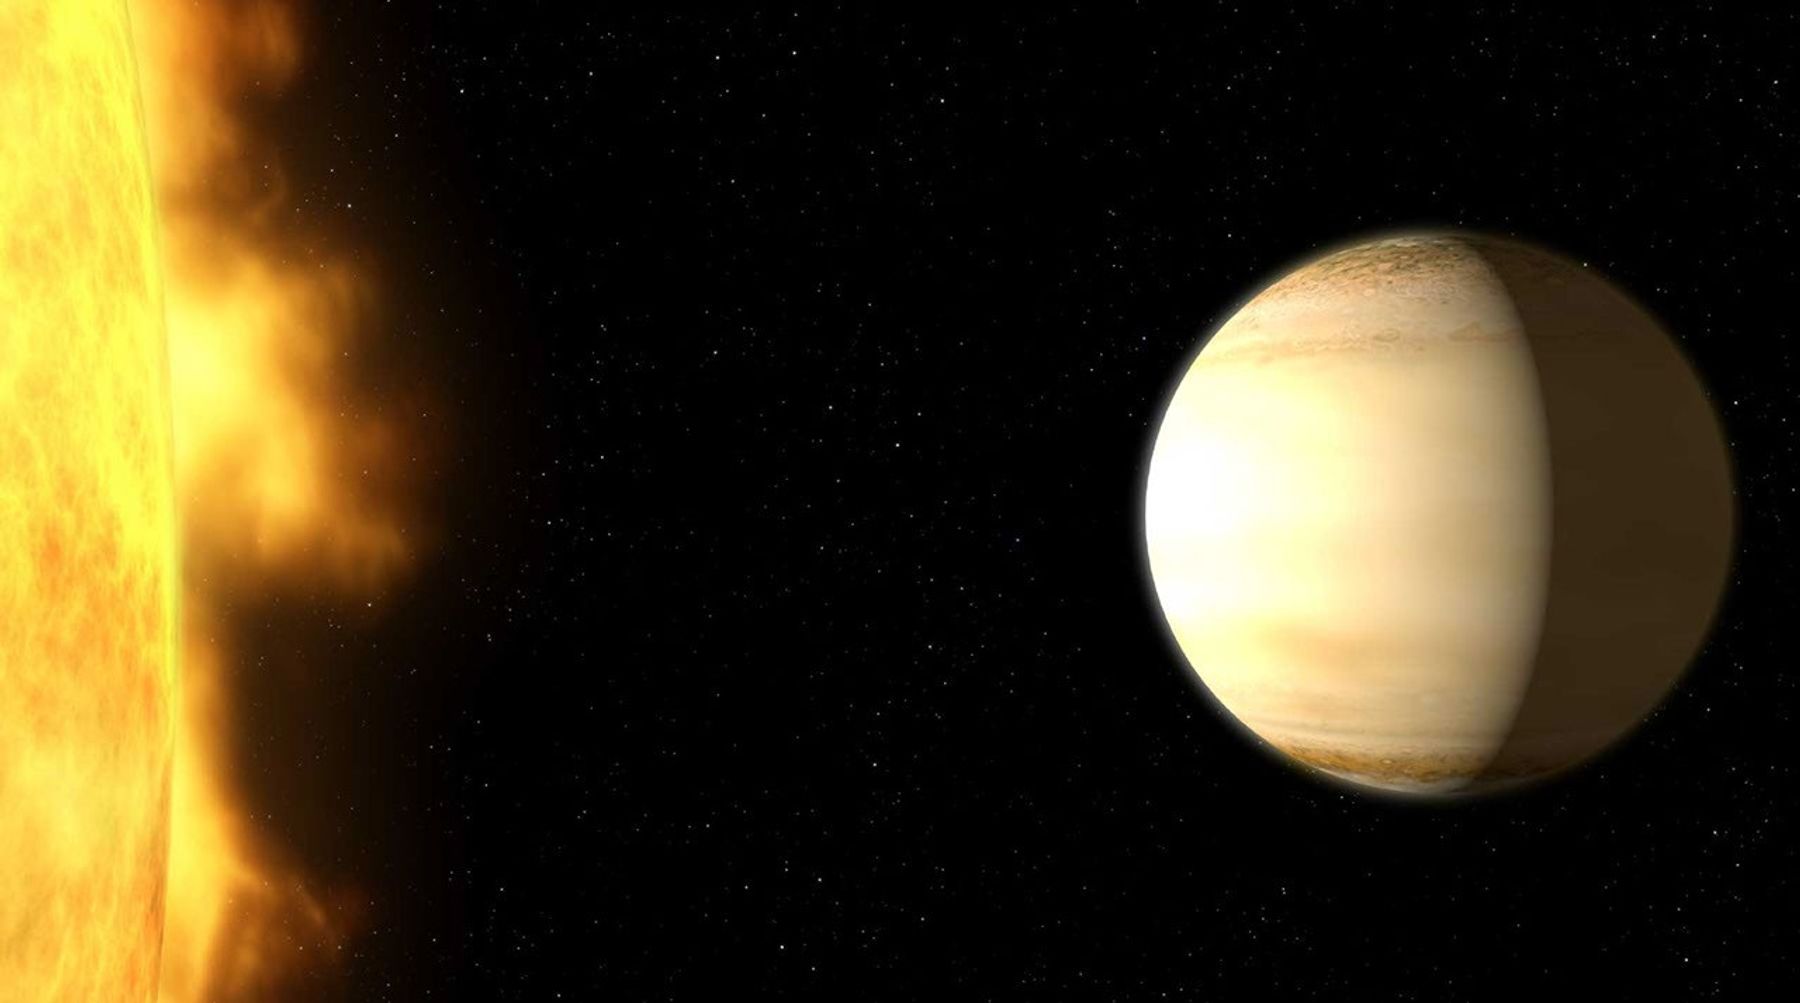
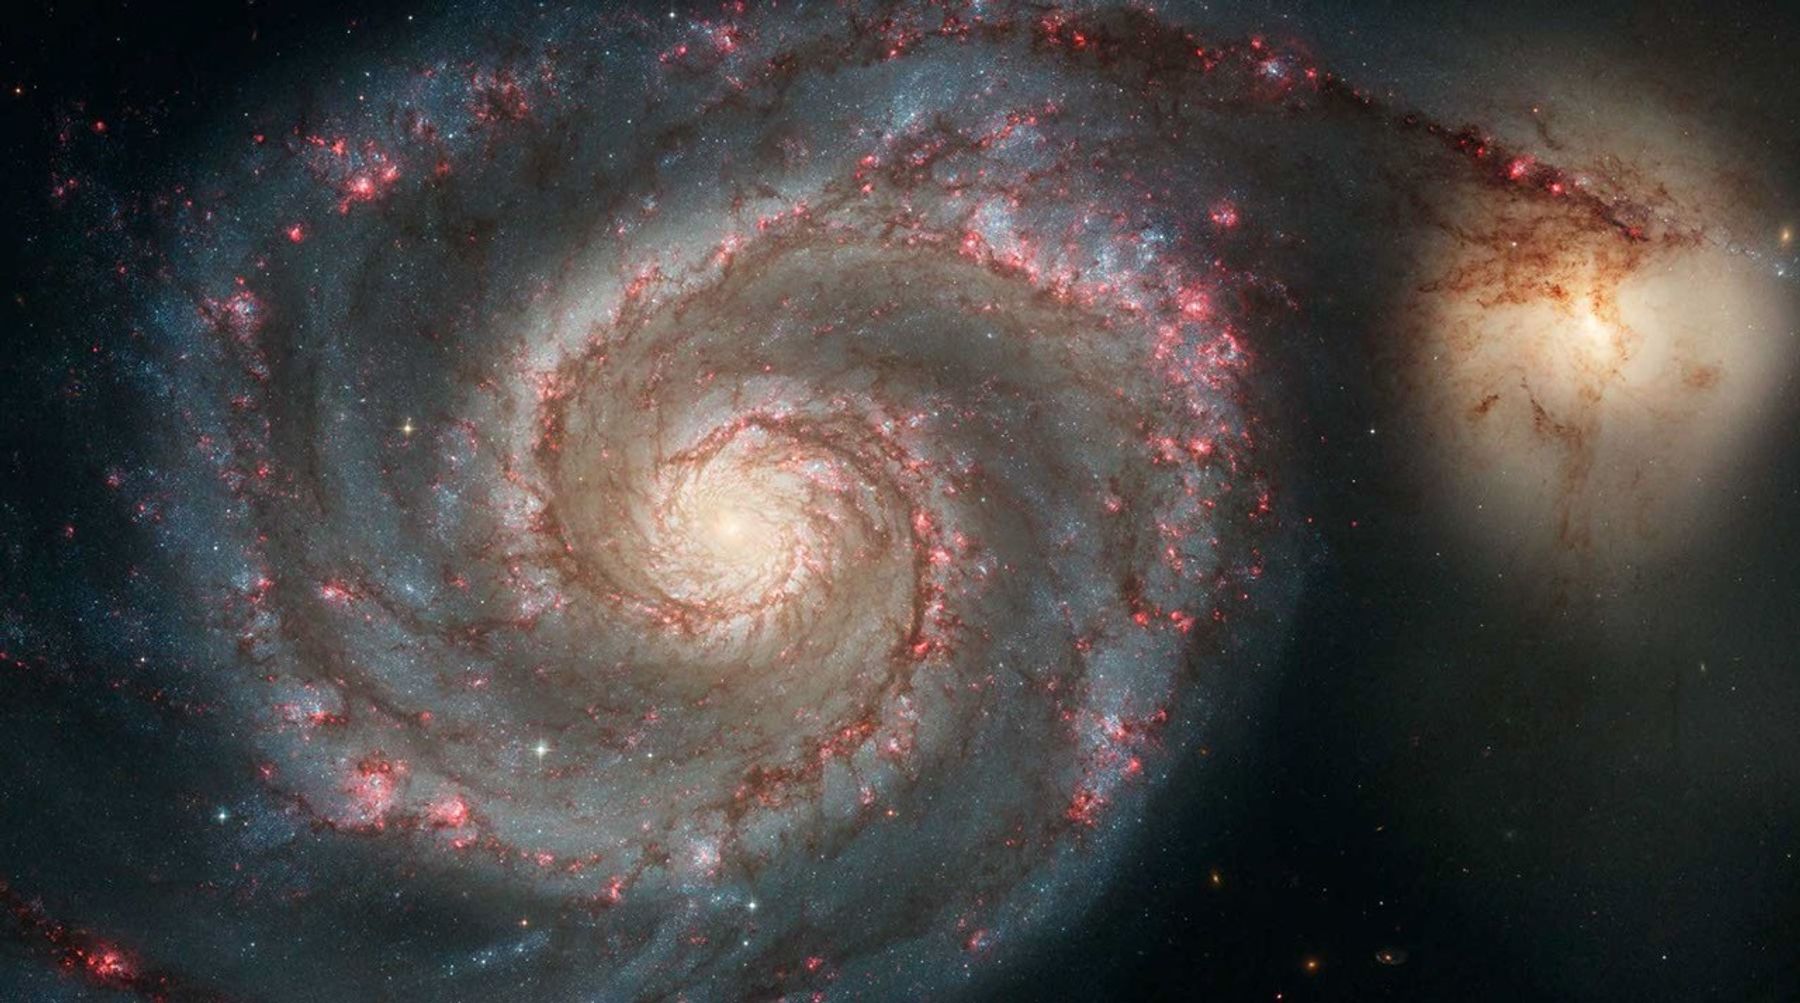
We know, for example, that 91.2% of the atoms in the Sun are hydrogen. We know there is water vapor in the atmosphere of WASP-39 b, a distant planet 700 light-years away. We know that the gas at the center of galaxy M82 is 80,000,000 degrees Celsius (150 million degrees Fahrenheit). And that the Whirlpool Galaxy is moving away from us at a rate of 460 kilometers (285 miles) every second.
Astronomy articles are filled with exact compositions, temperatures, and speeds of things that are too far to visit, impractical to probe, and in some cases impossible to observe directly. How is it possible to get such detailed measurements like these?
The answer is spectroscopy.
- Spectroscopy is a scientific method of studying objects and materials based on detailed patterns of colors (wavelengths).
- Spectroscopy is used to figure out what things are made of, how hot they are, how dense they are, and how fast they are moving in space.
- Spectroscopy works because light and matter interact with each other in very specific and predictable ways.
- Different materials give off and interact with different colors of light in different ways, depending on properties like temperature, composition, and motion.
What is Spectroscopy?
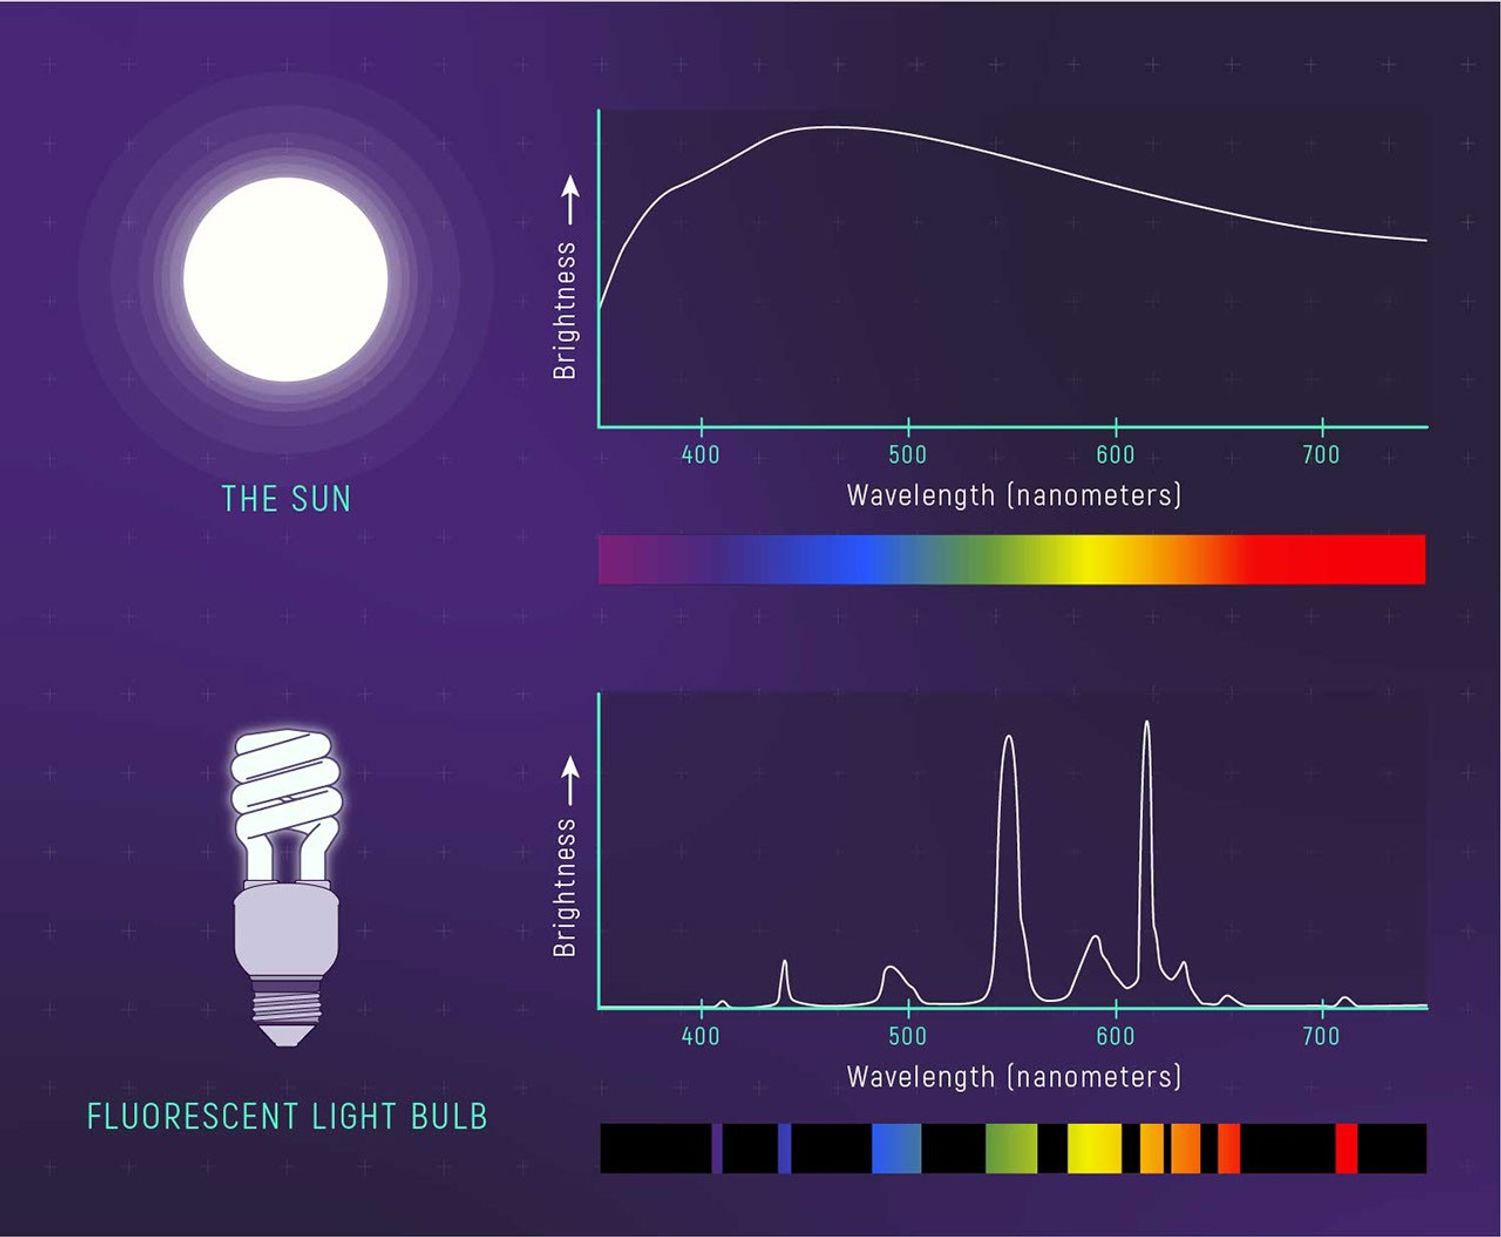
While it might sound a bit like an unpleasant medical procedure, at its most basic, spectroscopy is simply a scientific method of studying objects and materials based on color. More specifically, spectroscopy involves analyzing spectra: the detailed patterns of colors (wavelengths) that materials emit, absorb, transmit, or reflect.
Along with imaging (i.e., photography), spectroscopy is one of the most common and useful techniques in astronomy. While images provide information about the size, shape, and structure of matter in space, spectra provide key details such as temperature, composition, and motion.
Spectroscopy is also used in a wide variety of fields outside astronomy, including materials science, Earth science, medicine, forensics, national security, and food safety.
If you are not already familiar with spectroscopy, it is probably because spectra (which are commonly displayed in graph form) don’t typically have a lot of aesthetic appeal. But while they don’t seem to get much press, spectra are in fact humbly hanging out behind the scenes of some of the most intriguing headlines in astronomy.
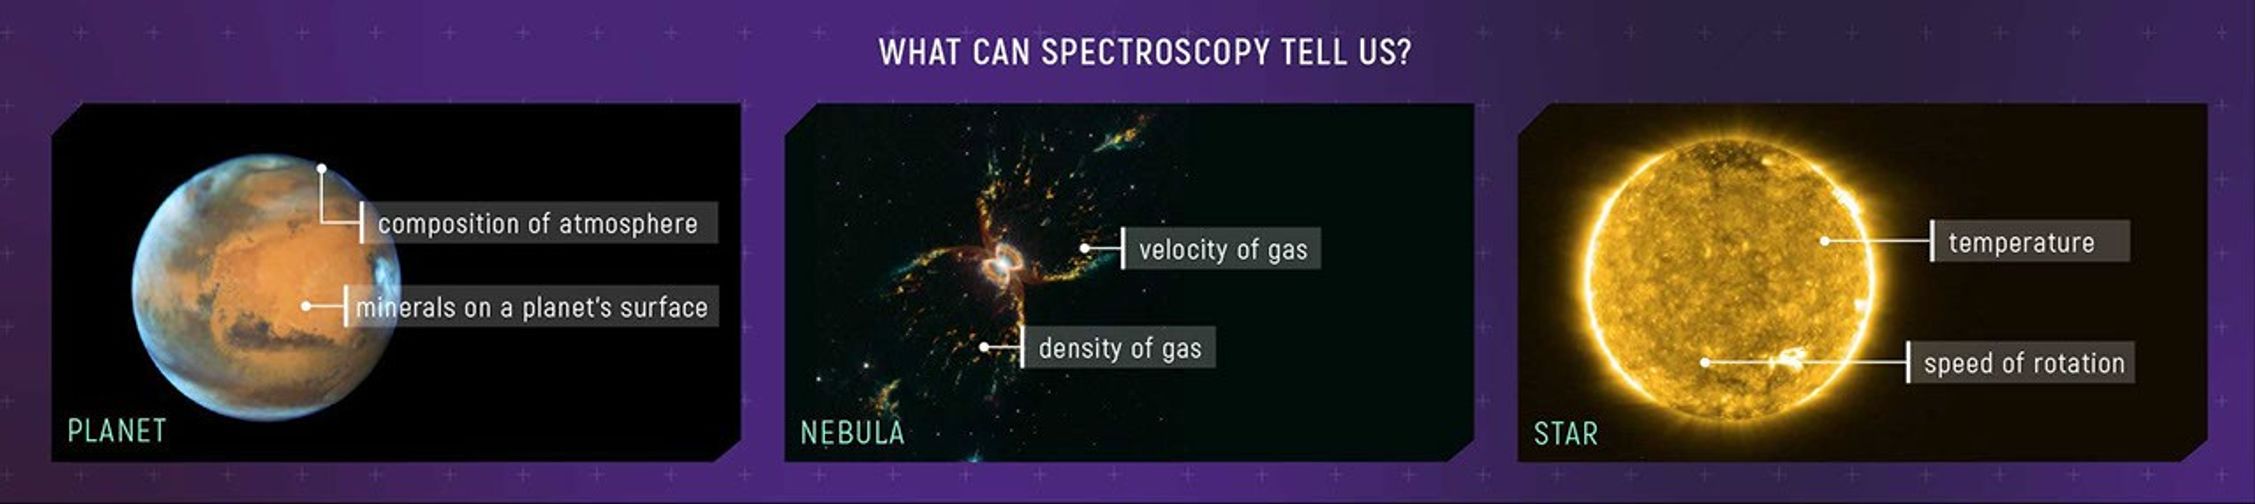
Spectroscopy allows us to identify gases in planetary atmospheres and minerals on planetary surfaces; figure out what stars are made of and how fast they are rotating; detect and characterize planets orbiting distant stars; measure the temperature and speed of gases in the center of an active galaxy; infer the presence of black holes and dark matter; unravel interactions between colliding galaxies; and help calculate the expansion rate and age of the universe.