


Webb’s Impact on Exoplanet Research
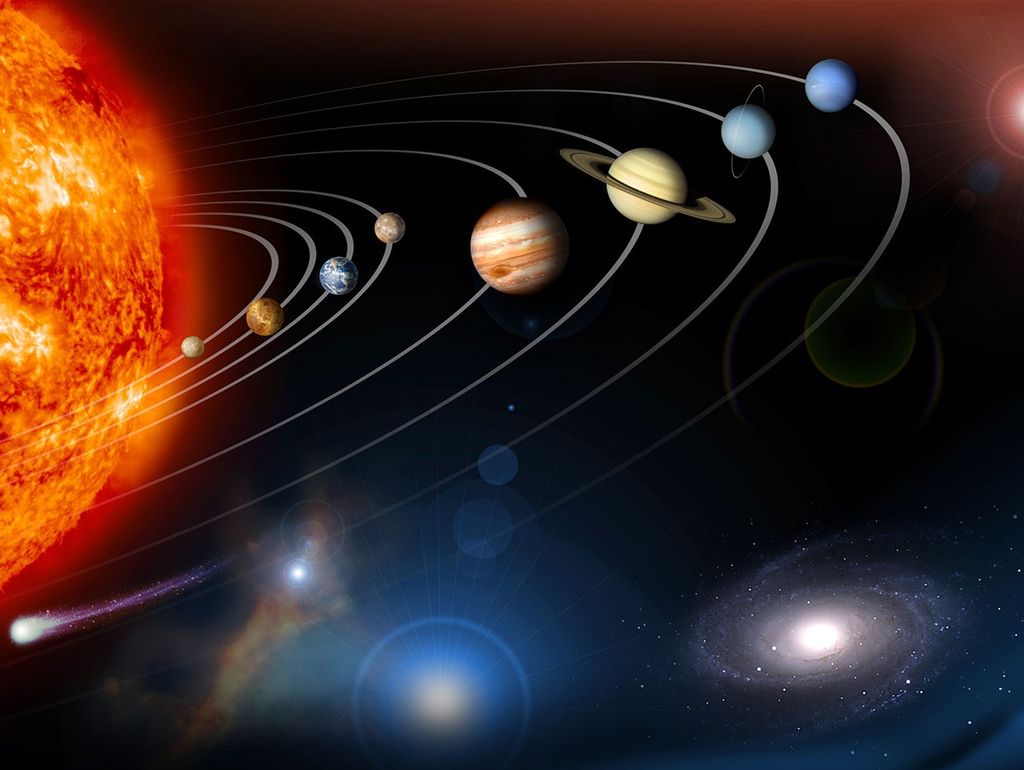
What are planets around other stars like? What are they made of? How did they form? How different are they from each other and the planets in our solar system?
Building on the legacy of NASA’s Hubble Space Telescope, Spitzer Space Telescope, and other ground- and space-based observatories, the James Webb Space Telescope is expanding our understanding of exoplanet atmospheres. A few are highlighted below.
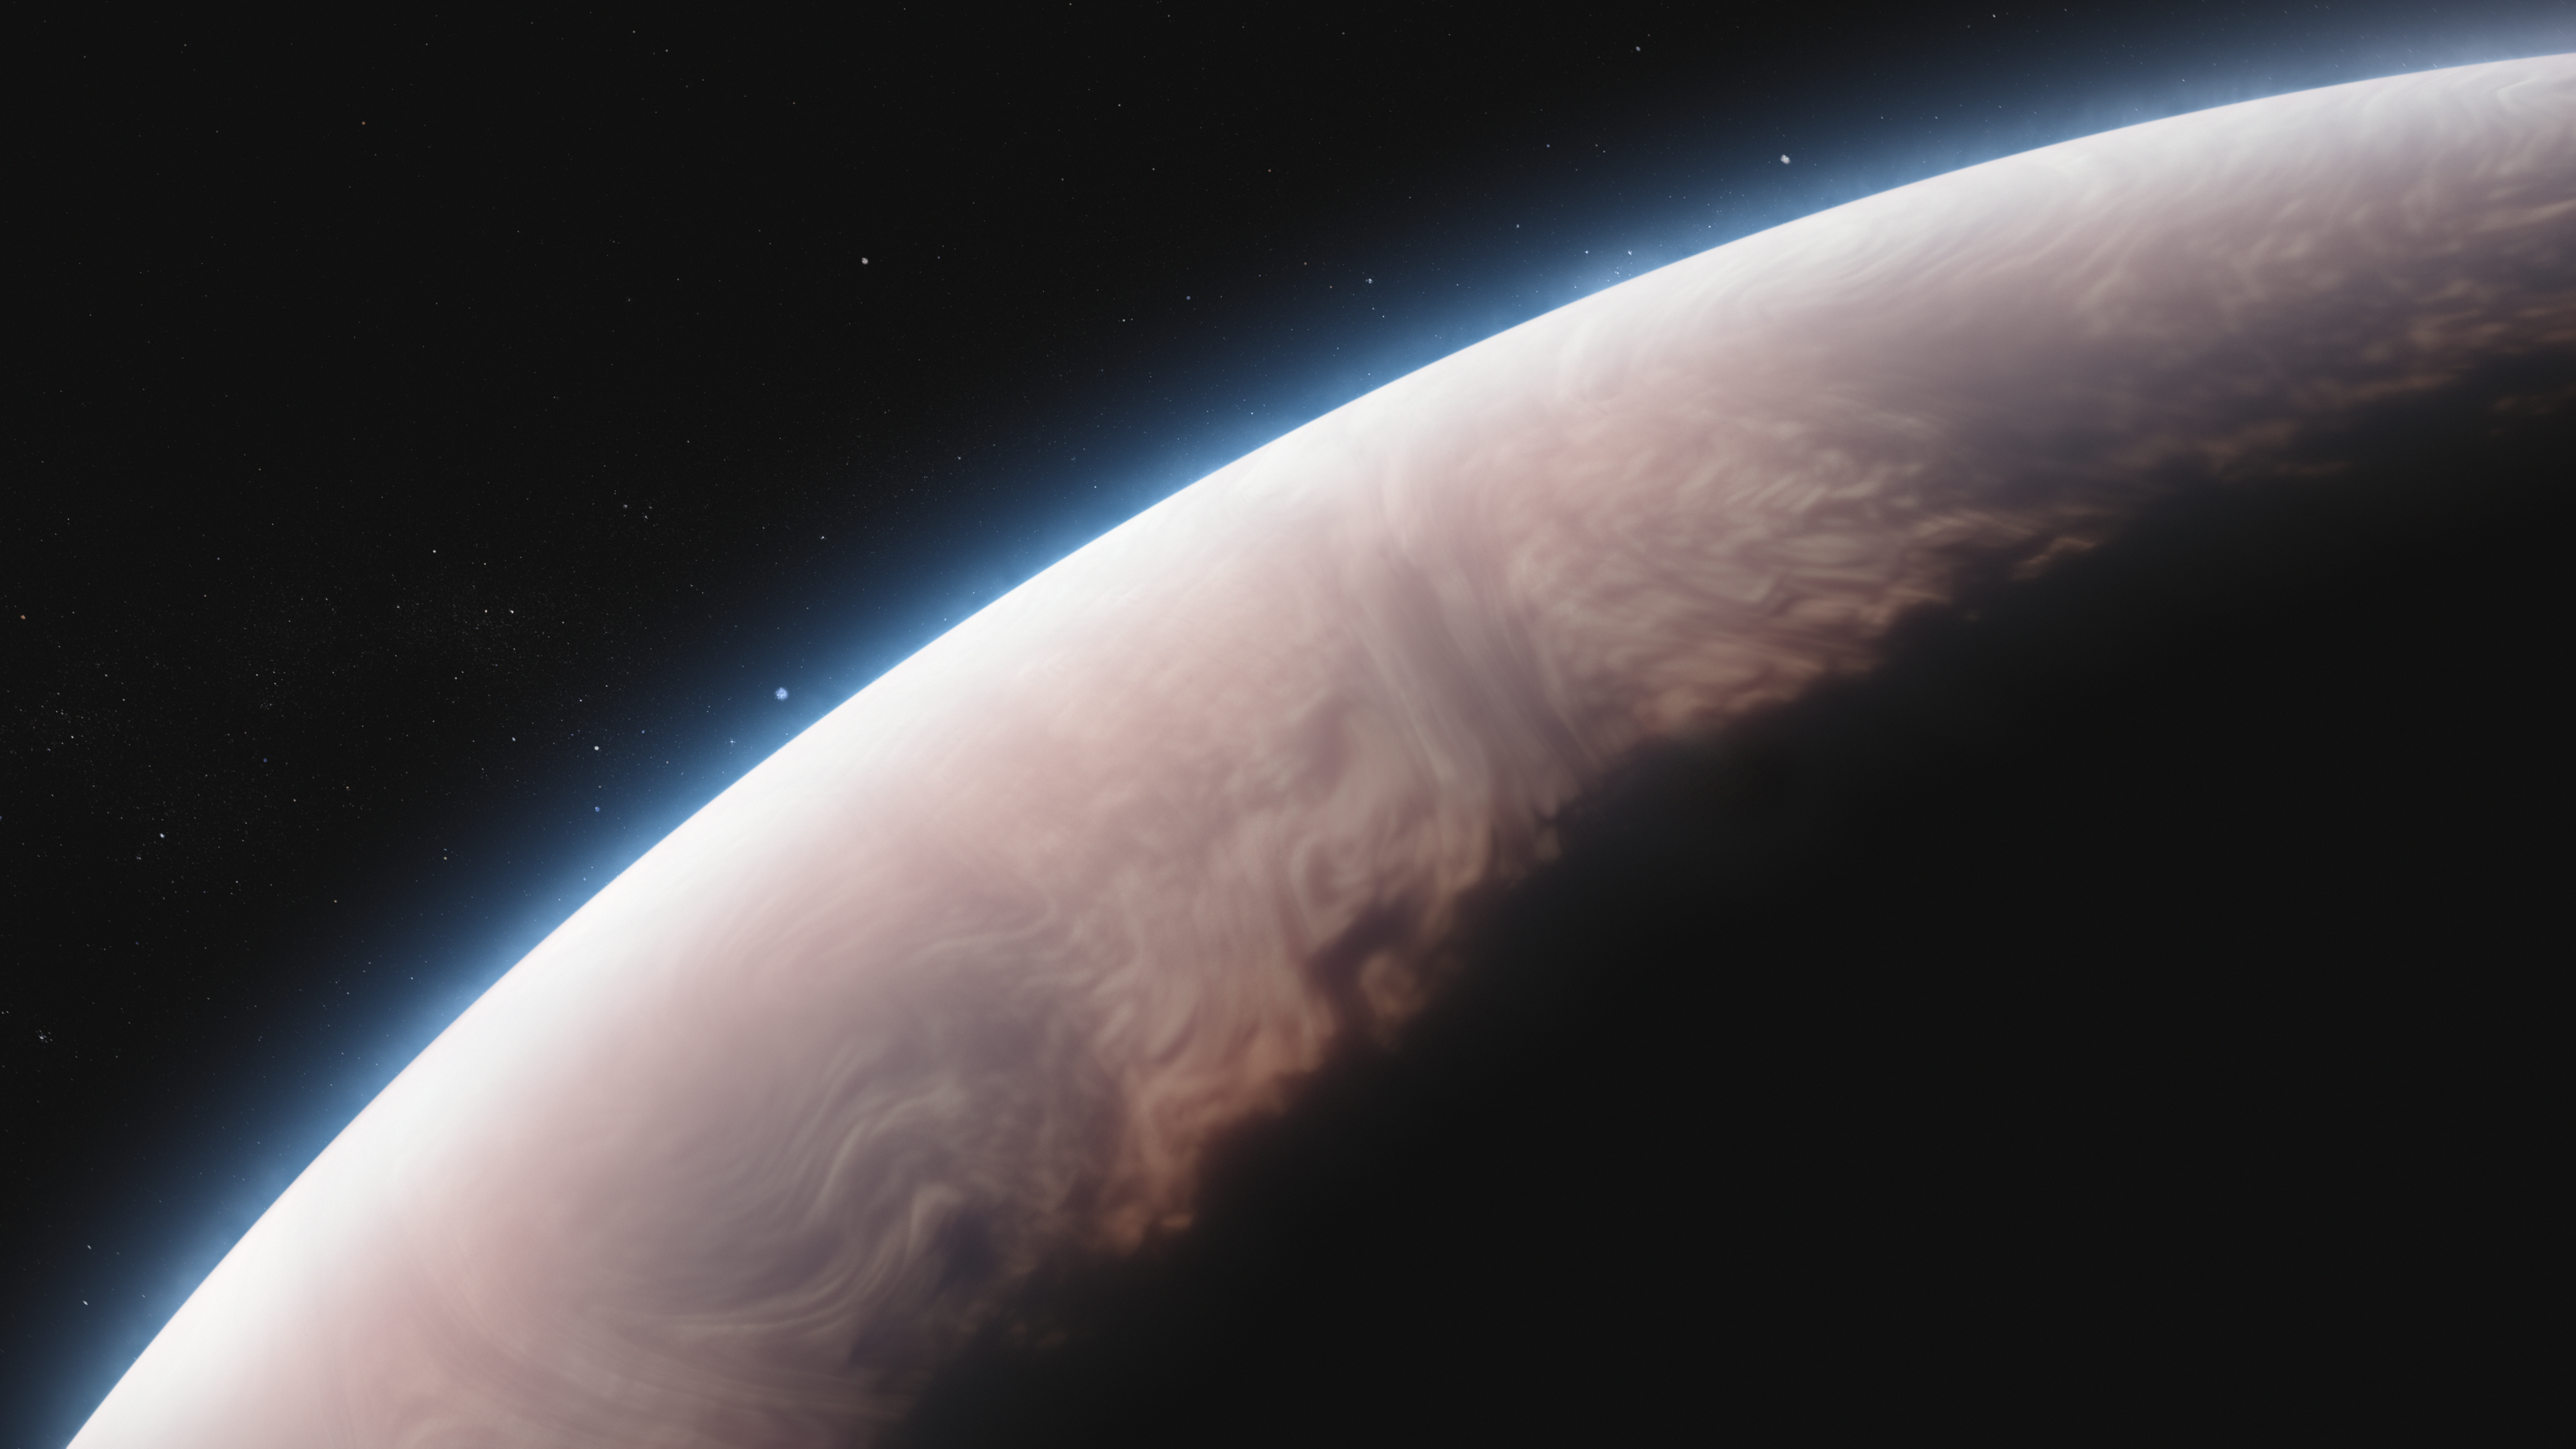
- WASP-96 b: The first exoplanet transmission spectrum collected by Webb showed clear signs of water vapor that previous spectra only hinted at. It is the first transmission spectrum that includes wavelengths longer than 1.6 microns with high resolution and accuracy, and the first to cover the entire wavelength range from 0.6 microns (visible red light) to 2.8 microns (near-infrared) in a single shot. WASP-96 b is a gas giant exoplanet.
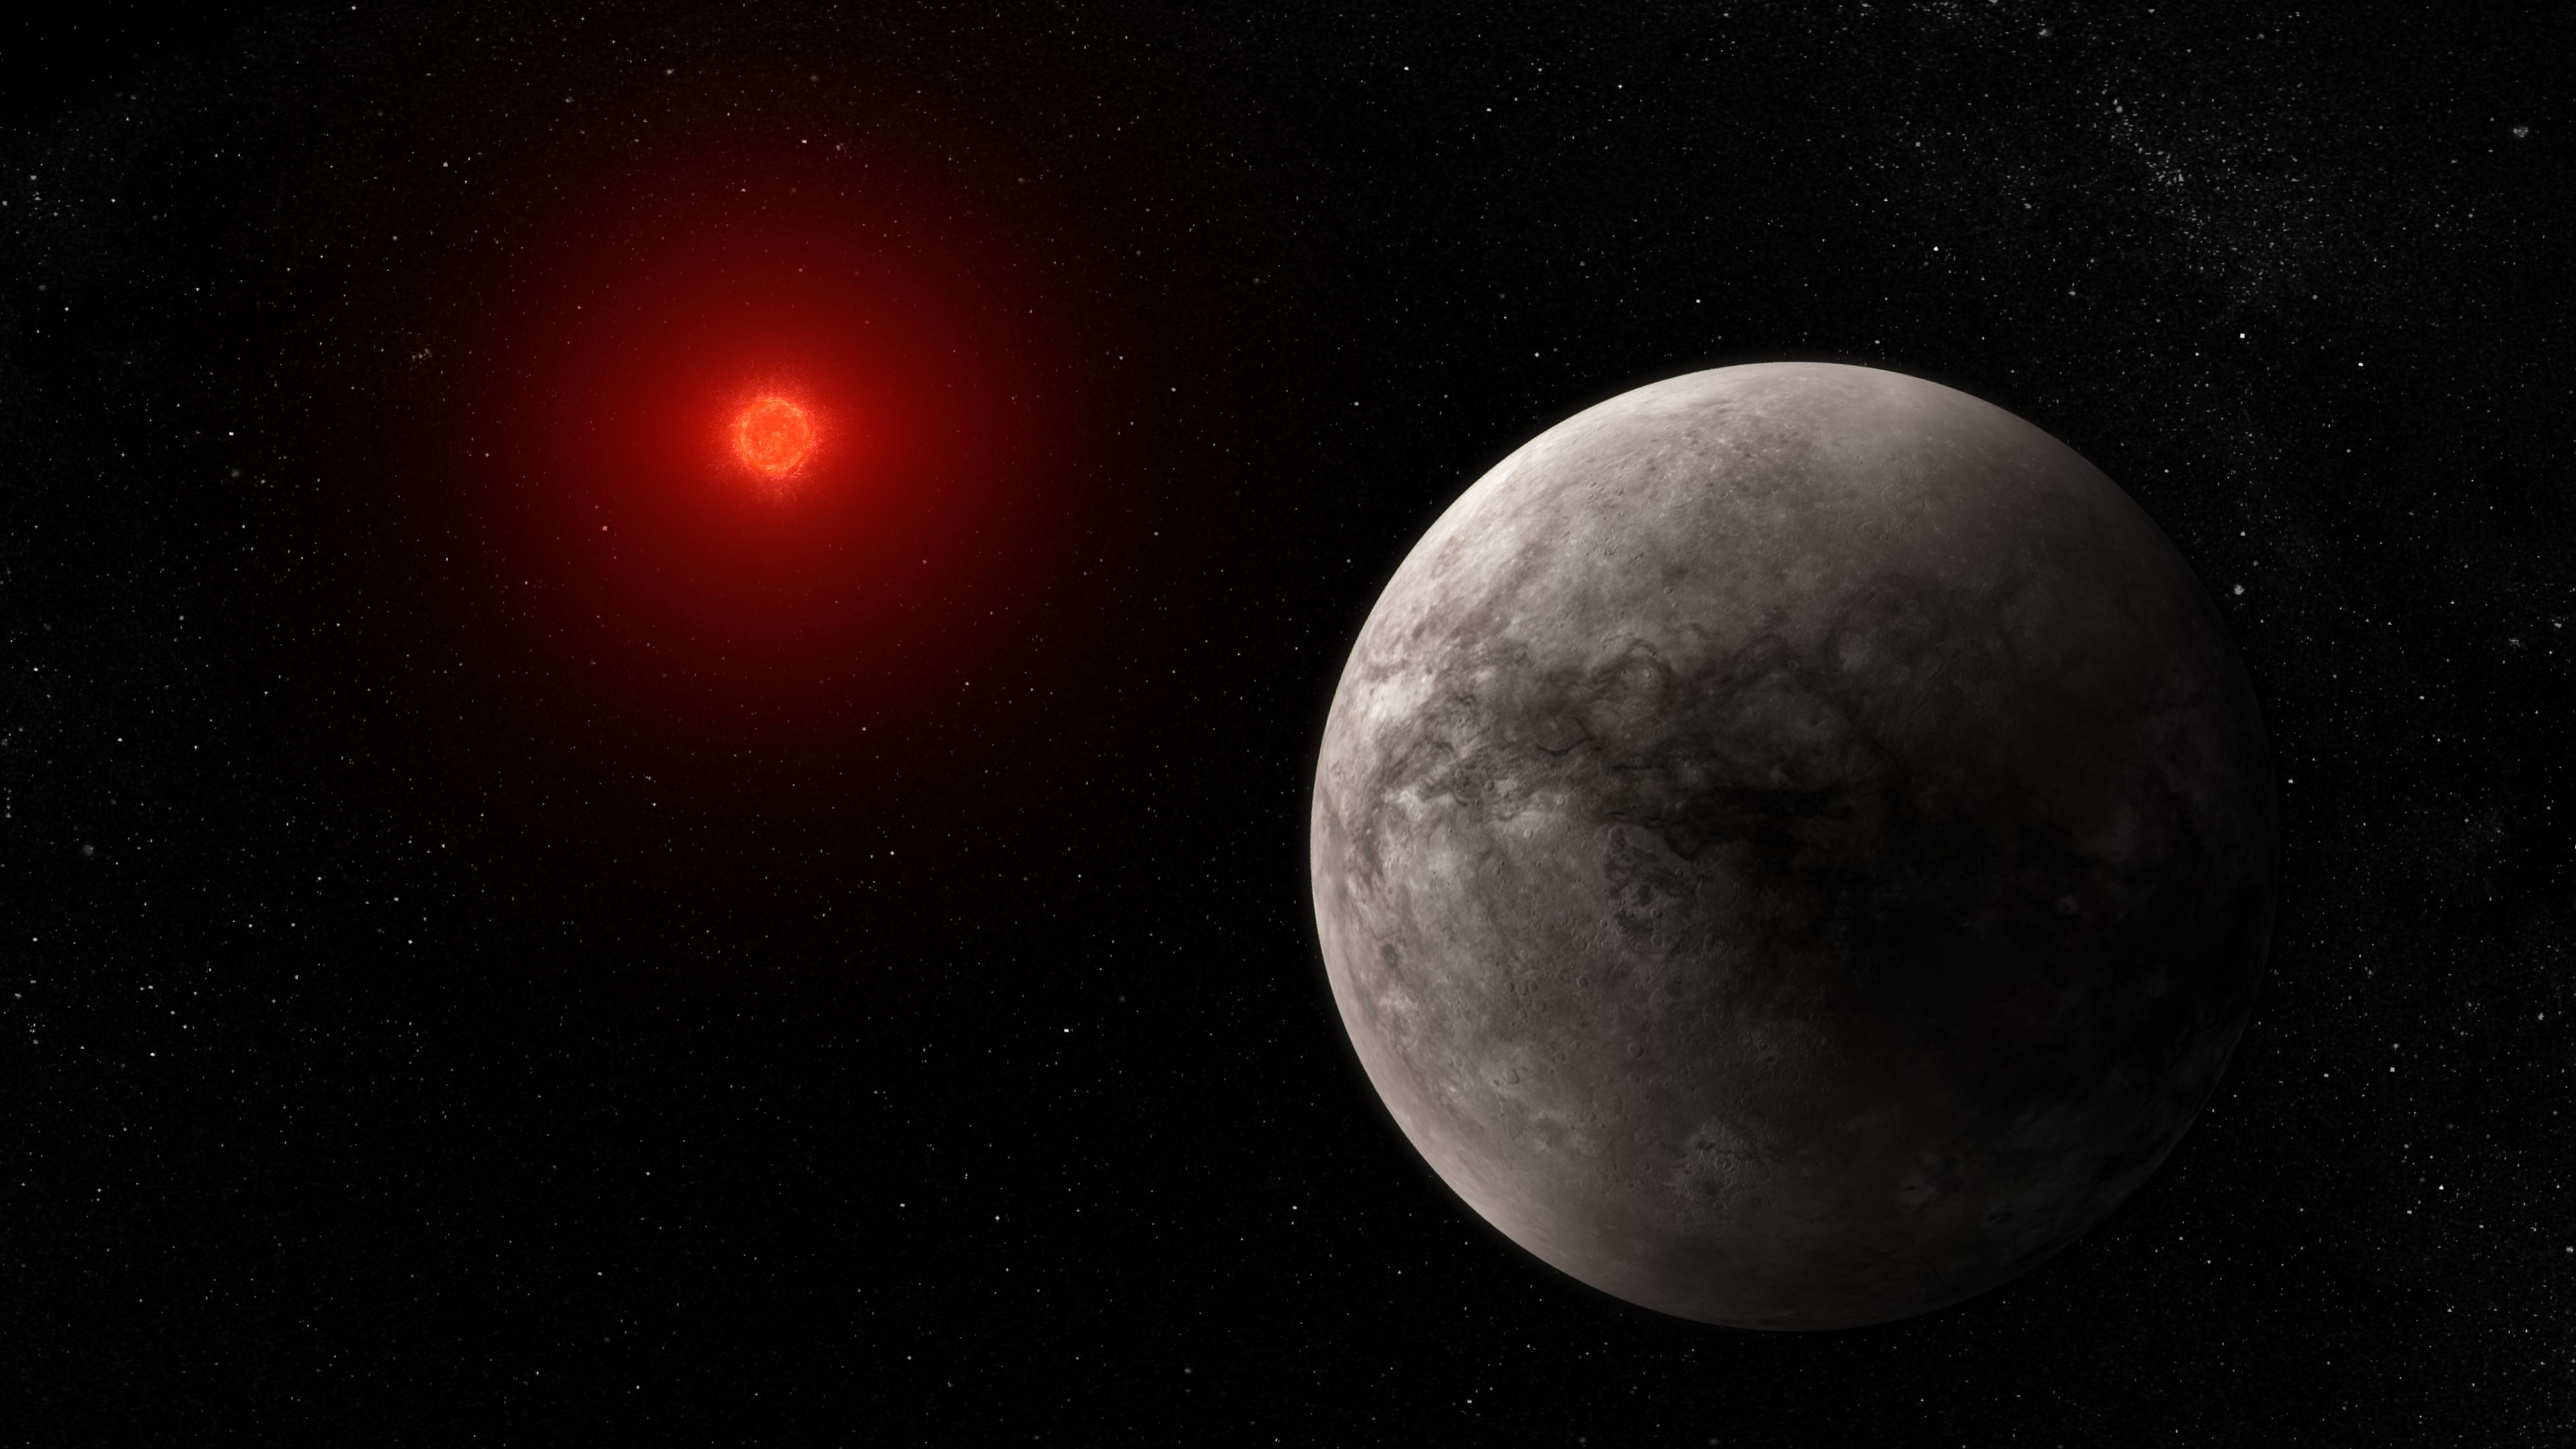
- TRAPPIST-1 b: Webb performed the first thermal emission observation on any planet as small as Earth and as cool as the rocky planets in our solar system. These observations suggest that the planet does not have a significant atmosphere.
- WASP-39 b: Webb detected carbon dioxide and sulfur dioxide in the atmosphere of a gas giant exoplanet for the first time. The detection of sulfur dioxide in the atmosphere of this “hot Saturn” provides evidence of photochemistry – chemical reactions initiated by energetic stellar light.
Exoplanet Types: From Small and Rocky to Gas Giant
Between the early 1990s, when the first exoplanets were discovered, and the beginning of Webb’s observations in 2022, more than 5,000 exoplanets had been detected in the Milky Way, with more discovered every year. Over the past three decades, researchers have identified a wide range of exoplanets, including rocky planets orbiting within the so-called "habitable zones" of their stars; have observed the planet-forming disks that surround young stars; and have detected molecules in exoplanet atmospheres.
In its first 18 months, Webb has begun to expand our knowledge through successful observations of a wide variety of exoplanets.

How Webb Observes Exoplanets
Since Webb's first exoplanet observations in June 2022, Webb’s unique sensitivity and precision have allowed researchers to study the details of gas giant atmospheres, hints about the properties of small, rocky exoplanets, and even how some exoplanets might have formed.
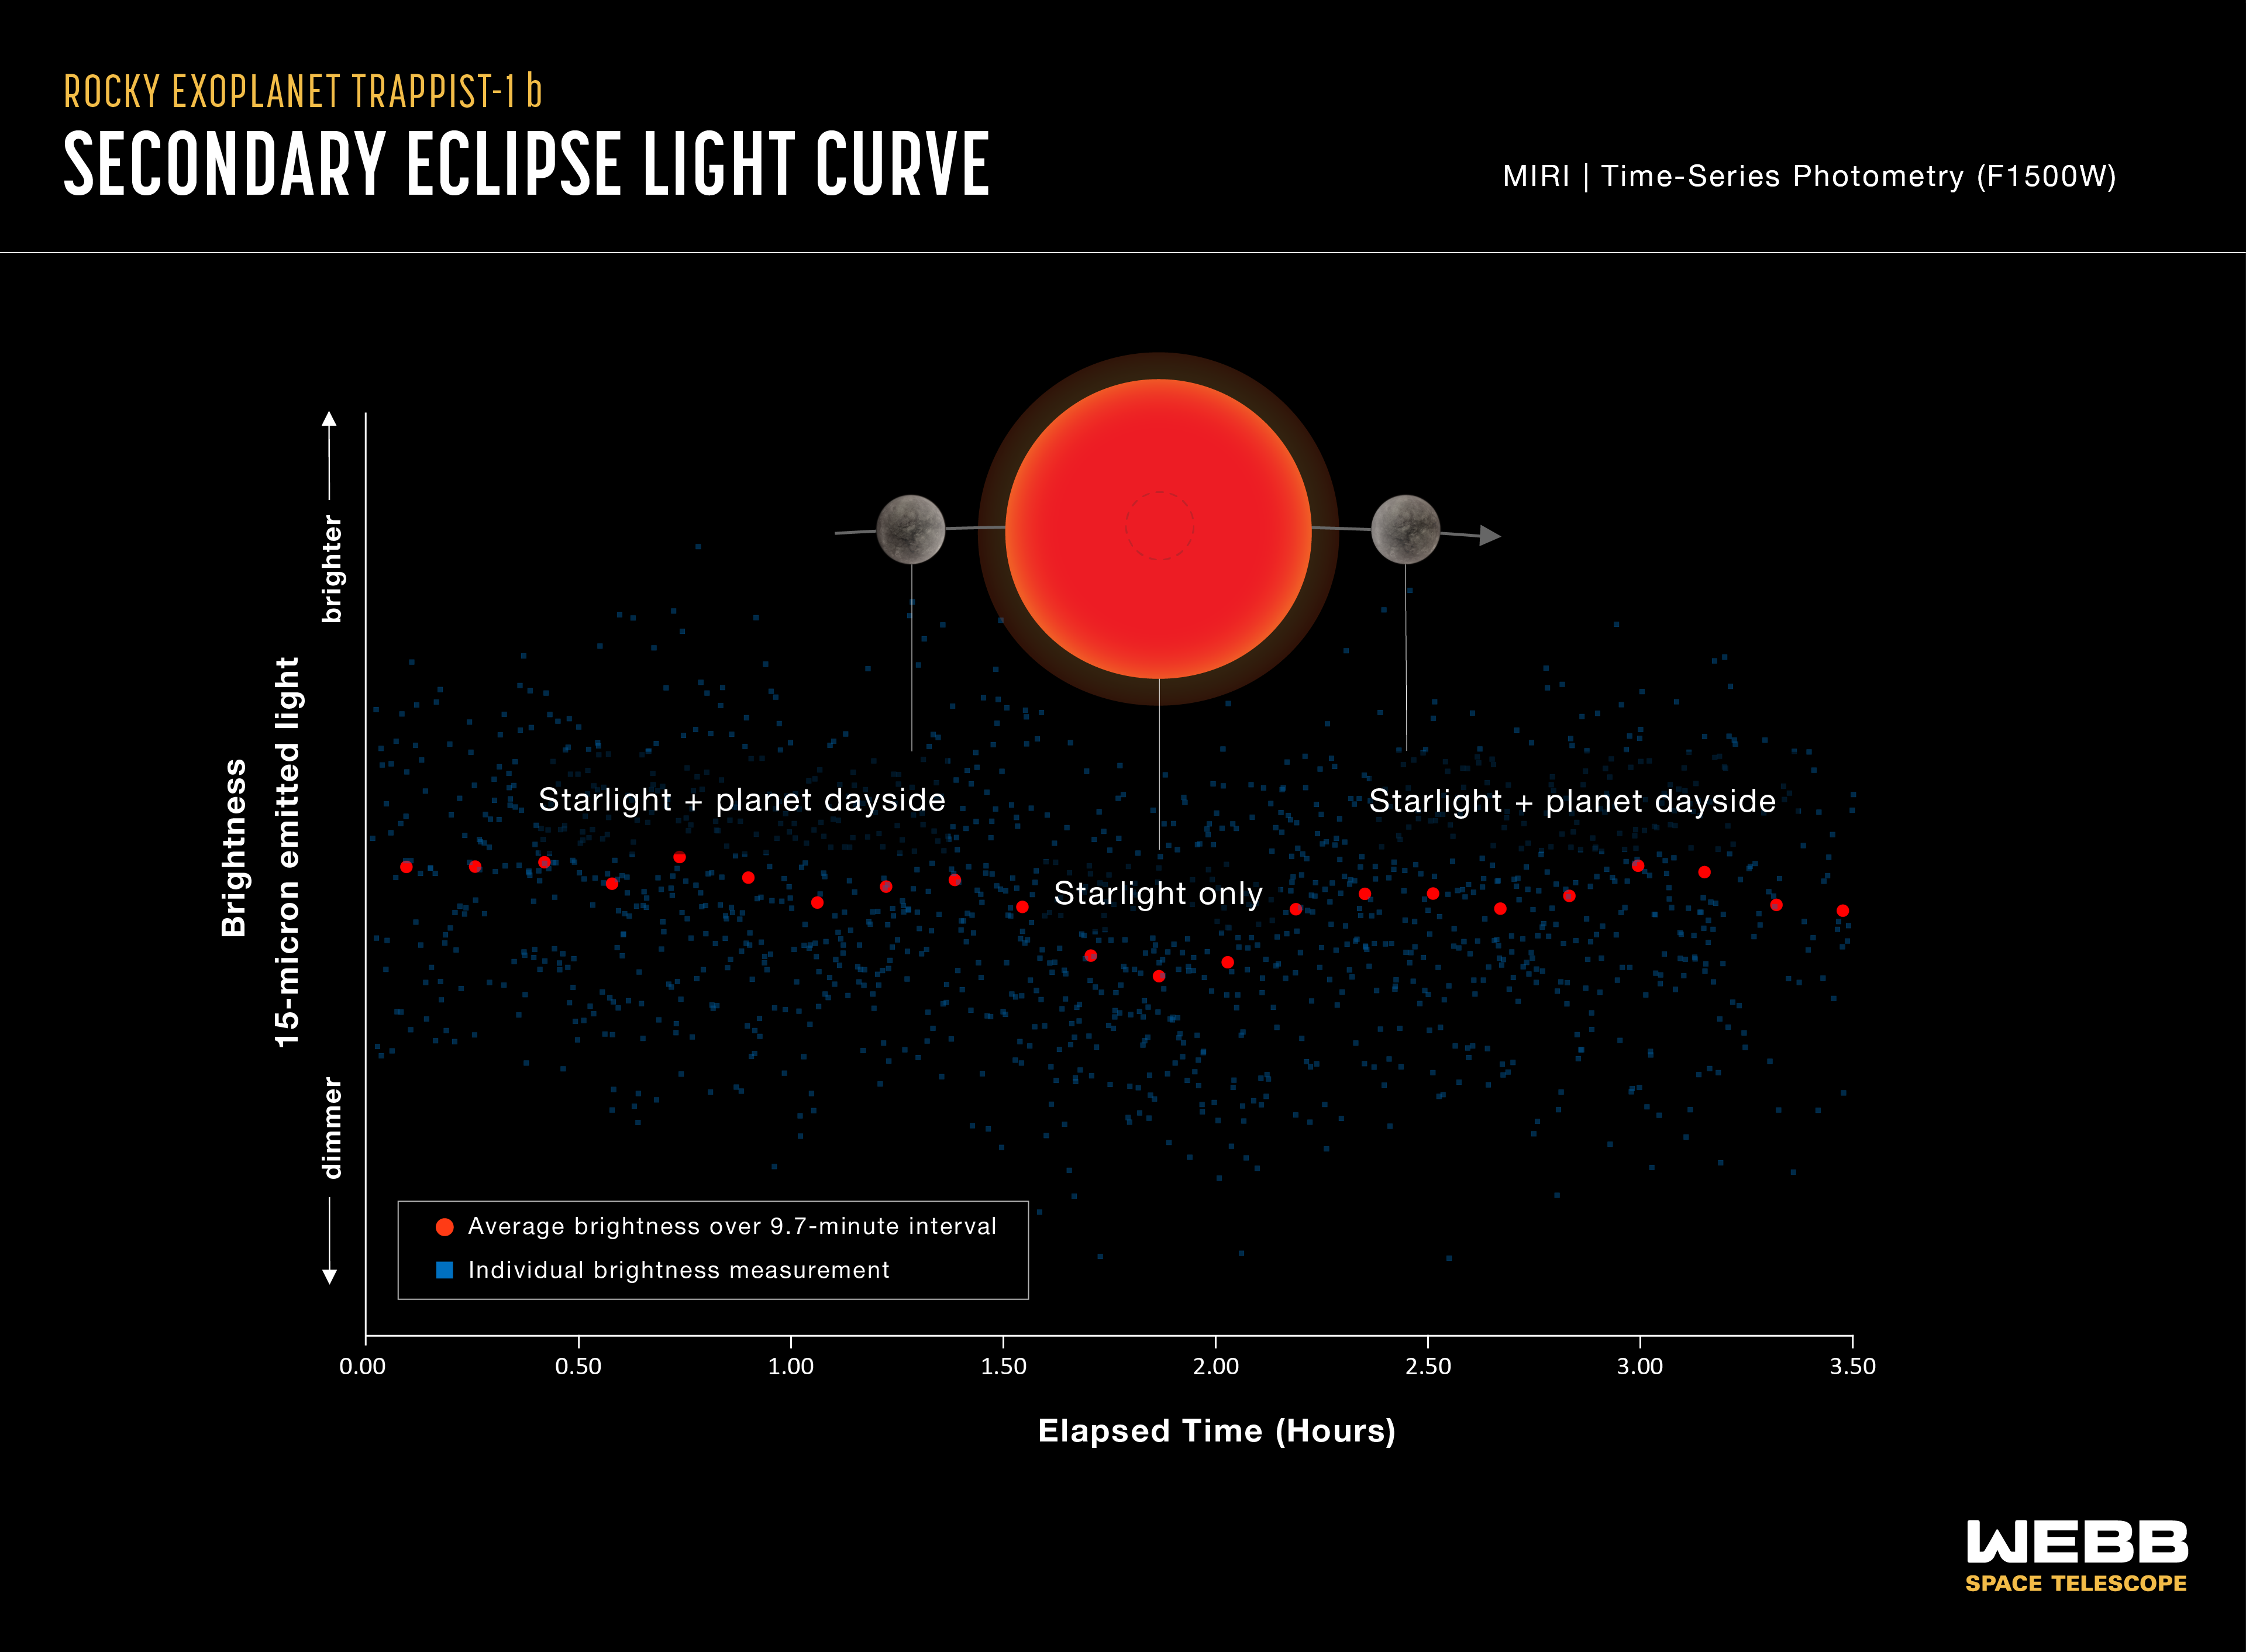
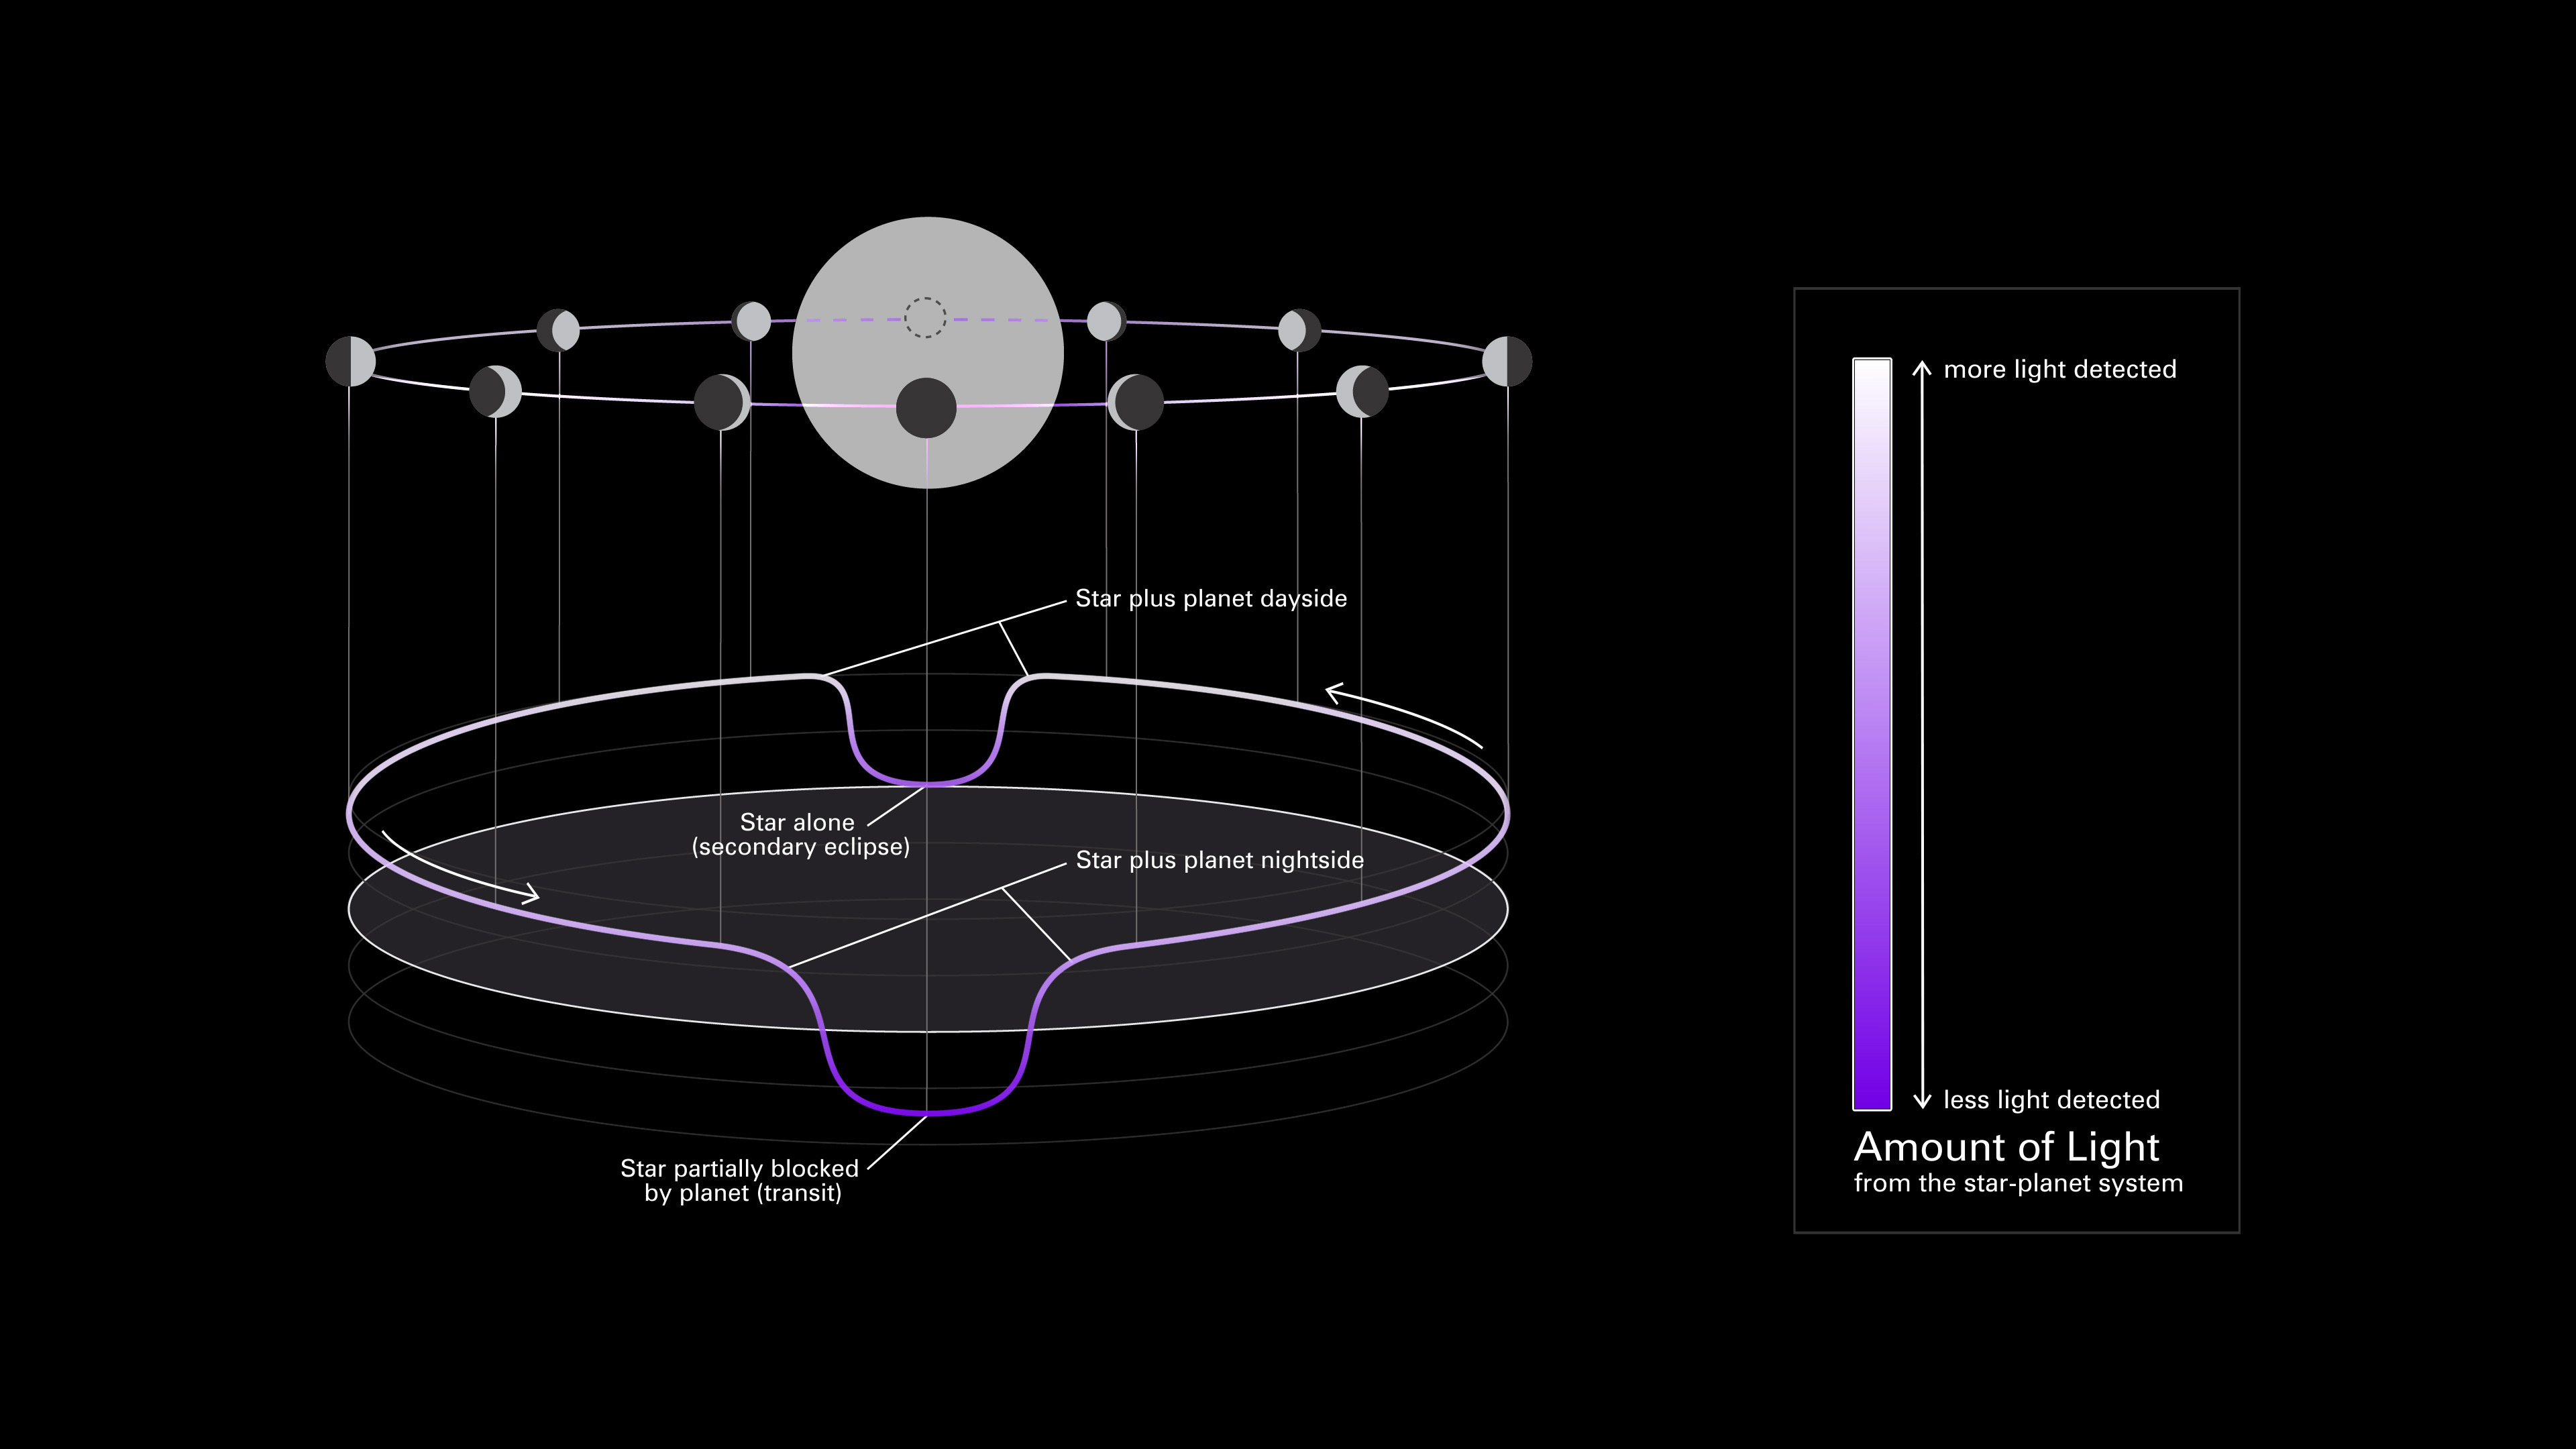
Directly observing planets that are close to their stars is difficult for Webb, due to the stars’ overwhelming brightness. However, while stars are much brighter, both stars and planets glow in infrared light. As a planet passes in front of its star from our perspective, it blocks a small amount of starlight, decreasing the total amount of light we observe from the system. This is known as a transit. Conversely, when a planet passes behind its star, the star blocks the planet’s light, creating a smaller dip in the light from the system, known as a secondary eclipse. Observing an exoplanet as it orbits and measuring these changes in brightness allows us to create what's known as a light curve.
Researchers captured a secondary eclipse light curve for TRAPPIST-1 b and TRAPPIST-1 c using MIRI's (Mid-Infrared Instrument) time-series photometry mode, which was able to measure the light emitted by both the star and the dayside of the planet over time.
By subtracting the brightness of the star from the combined brightness of the star and planet, astronomers were able to calculate how much infrared light is coming from the planet's dayside – its thermal emission. These data were then used to calculate the planet's temperature.
Webb’s observation of TRAPPIST-1 b marked the first thermal emission observation of any planet as small as Earth and as cool as the rocky planets in our solar system. Further, its observation of TRAPPIST-1 c's dayside temperature confirmed it as the coolest rocky exoplanet ever characterized, based on its thermal emission.
We can also observe the changes of brightness across the planet's entire orbit. These lead to a light curve known as a phase curve.
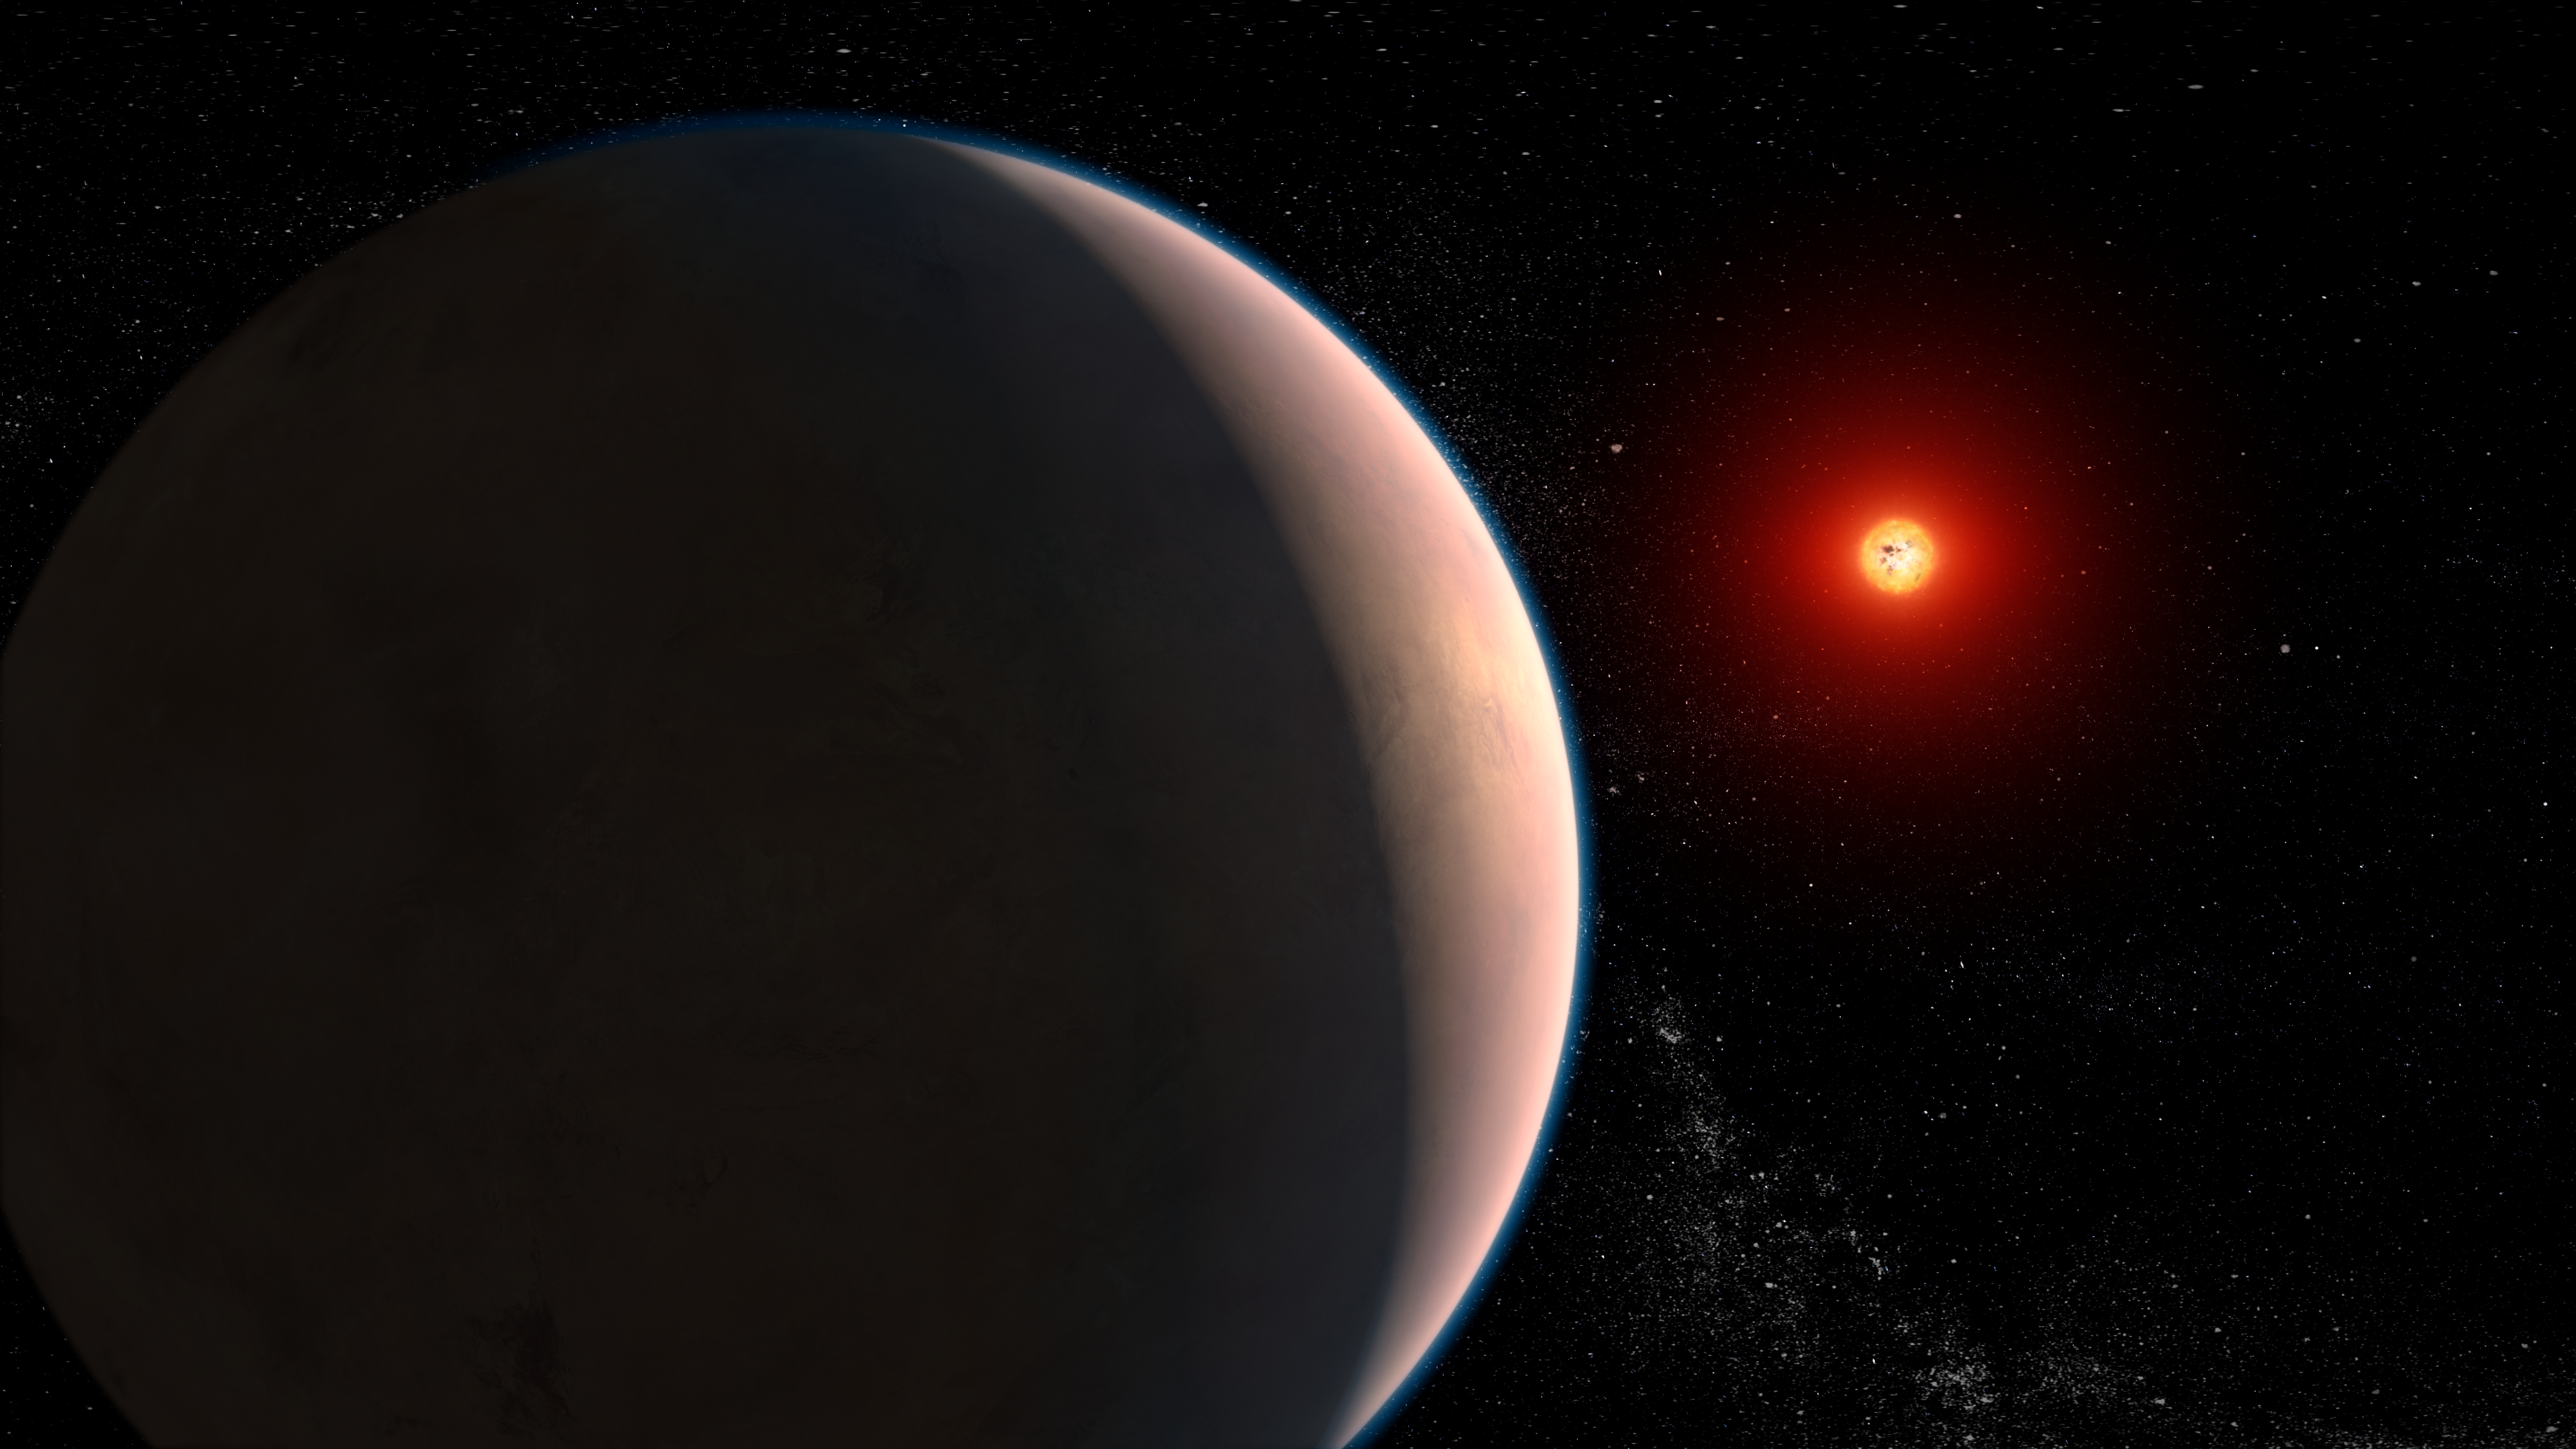
One of Webb's first phase curves came from observations of the sub-Neptune GJ 1214 b. The phase curve allowed researchers to map the planet's dayside and nightside temperatures, which revealed a shift from 535 degrees Fahrenheit on its day side to 326 on its night side (or from 279 to 165 degrees Celsius).
With these data, researchers were able to determine that the atmosphere of this planet must be made of heavier molecules, such as water or methane, since they tend to transfer heat more slowly than lighter molecules, like hydrogen. The data also point to clues about the formation of this planet. Researchers think it may have started with a hydrogen-rich atmosphere and lost that hydrogen over time, leaving heavier molecules behind or it was rich in heavier elements to begin with.
Transmission Spectroscopy: Measuring Exoplanet Atmospheres
Webb can use transmission spectroscopy to characterize the composition of an exoplanet's atmosphere. Transmission spectroscopy compares the light filtered through the exoplanet's atmosphere to the light coming from the parent star. Different types of chemicals in the atmosphere absorb different colors of the starlight spectrum, so the colors that are missing tell astronomers which atoms and molecules are present. By viewing infrared light with its sensitive spectrographs, Webb can pick up chemical fingerprints that can’t be detected in visible light.
Get video details and downloads in the Video gallery, or download video captions (VTT, 4 KB), and transcript of the audio description (Word Doc, 21 KB).
Example of Transmission Spectra
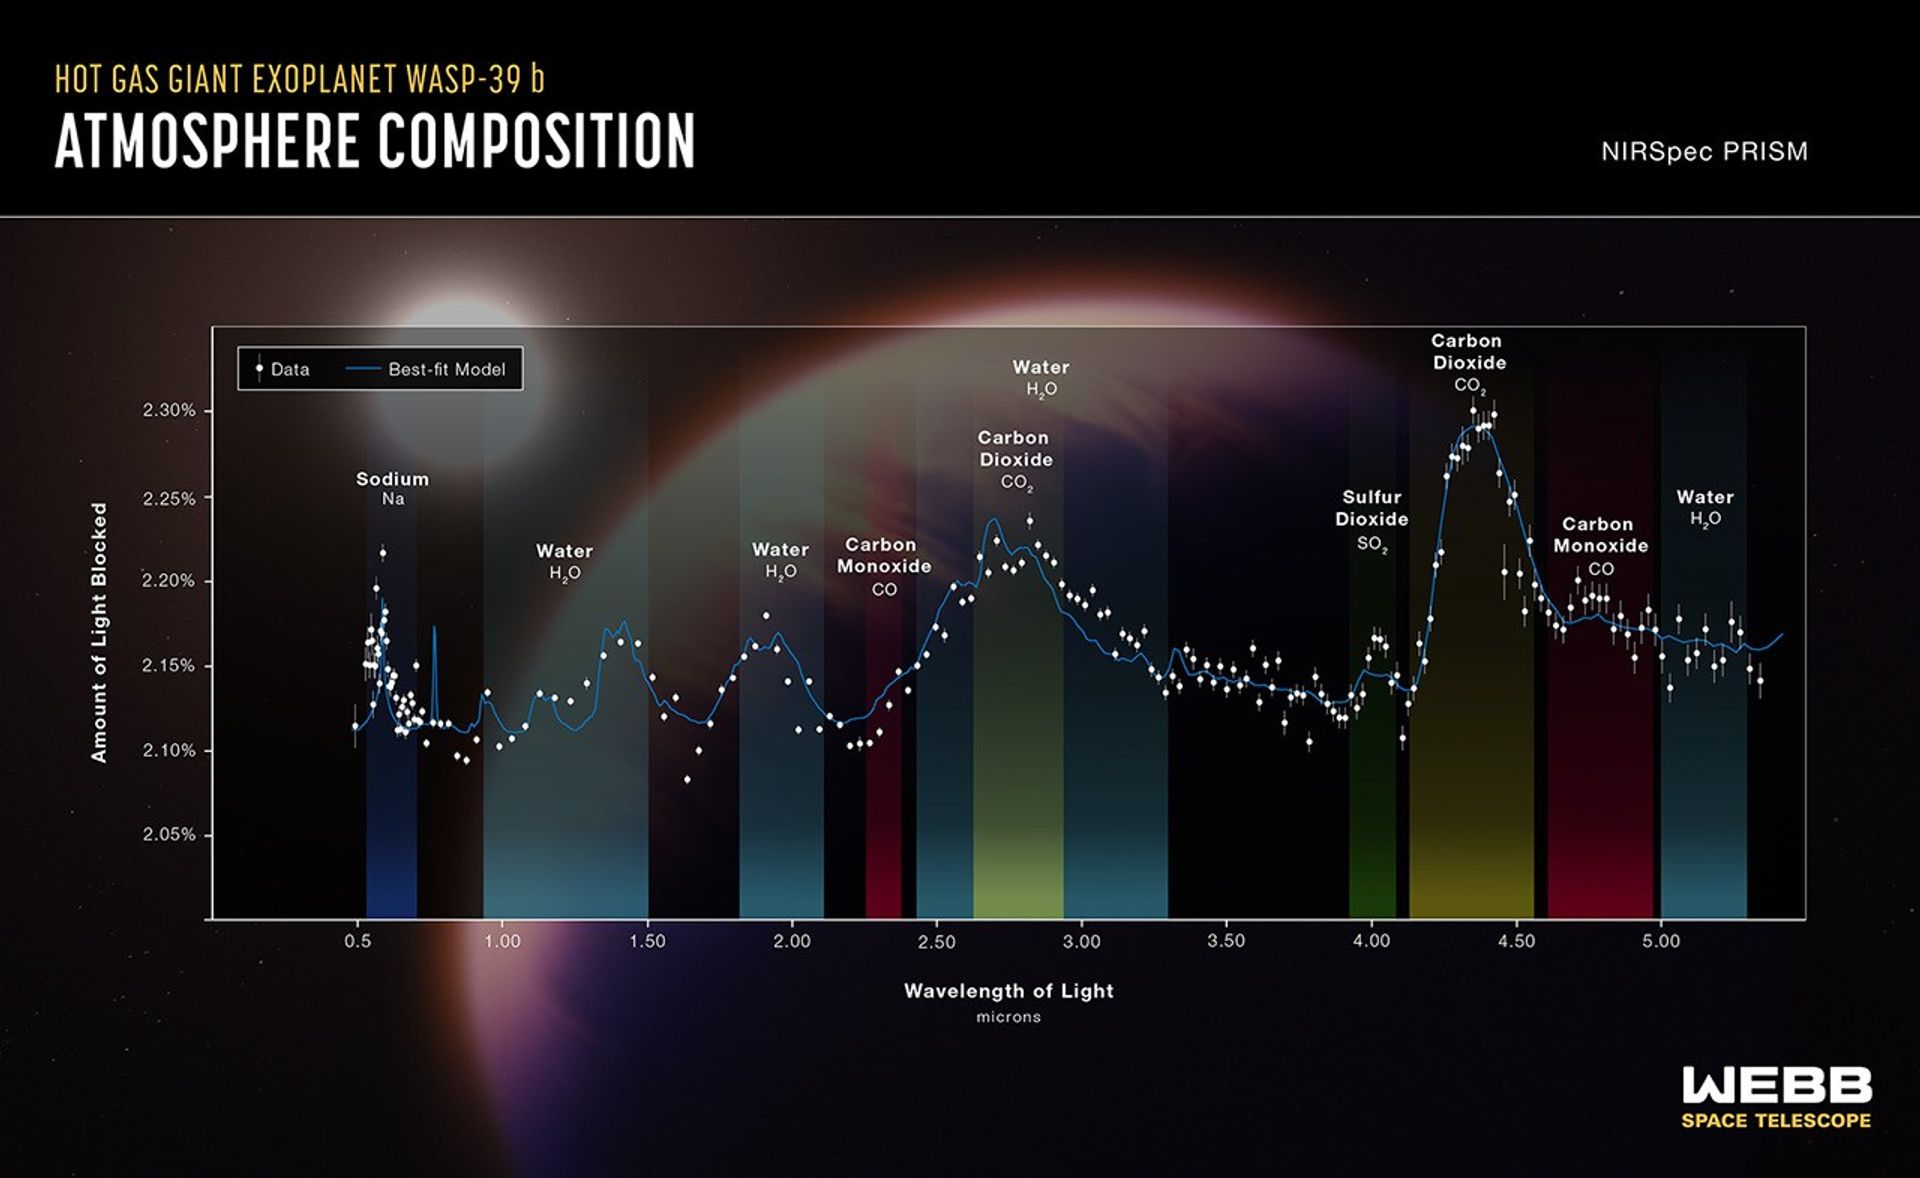
An example of these transmission spectra can be found from an observation of the WASP-39 system. Three of Webb’s instruments, NIRSpec (Near-Infrared Spectrograph), NIRISS (Near-Infrared Imager and Slitless Spectrograph), and NIRCam (Near-Infrared Camera), took transmission spectra of WASP-39 b, a gas giant, from 0.6 microns (visible red light) to 5.3 microns (near-infrared light).
The results show that this planet’s atmosphere contains several molecules of interest, which absorb starlight and appear on the spectrum in the form of peaks. In fact, this observation marks the first time sulfur dioxide and carbon dioxide have been detected in the atmosphere of an exoplanet. The presence of sulfur dioxide, a molecule produced from chemical reactions triggered by high-energy starlight, gave researchers the first evidence of photochemistry, or the chemical effects of light, in an exoplanet.
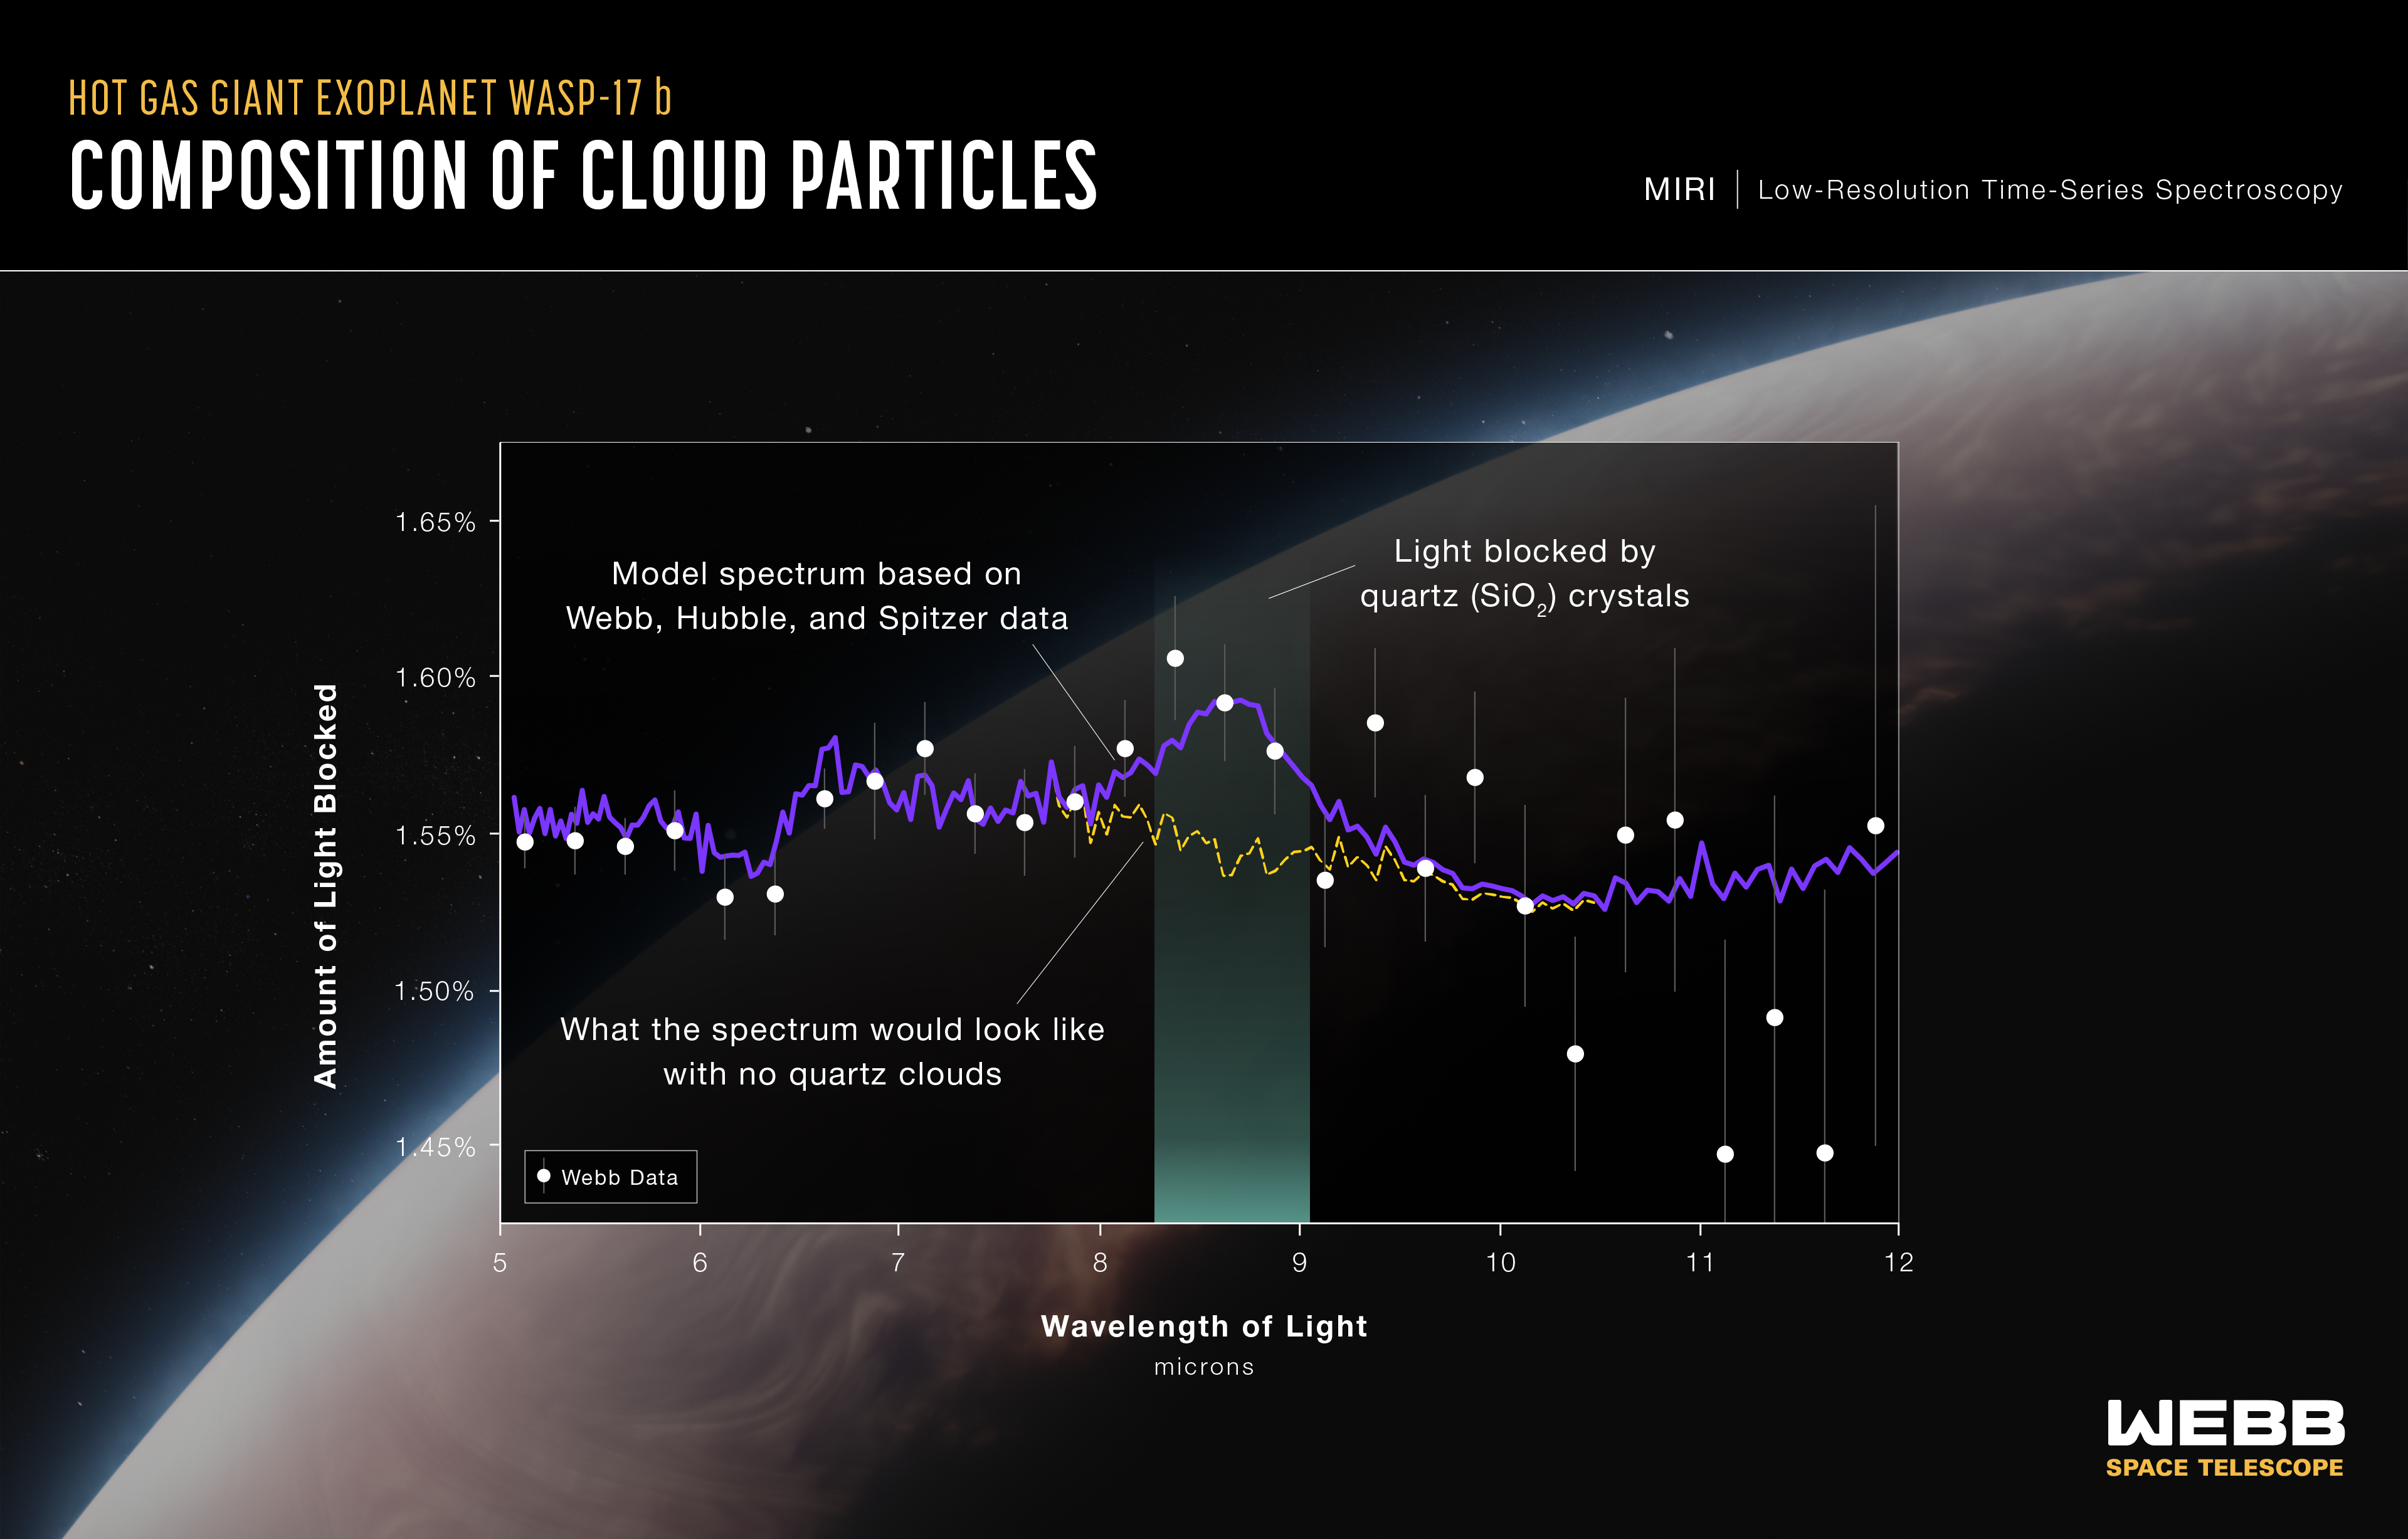
Using its time-series spectroscopy mode, MIRI observed WASP-17 b for ten hours, and captured a transmission spectrum that showed that its atmosphere contains clouds rich in nanoparticles of crystalline silica, better known as quartz. Silicates, like quartz, make up the bulk of Earth and other rocky objects in our solar system, including the Moon. However, silicate grains previously detected in the atmospheres of exoplanets were rich with magnesium, not quartz alone.
Direct Observation
Many of the "images" of exoplanets that you may see are actually artist's concepts. They are depictions of what a planet might look like based on scientific data. While it is possible to take pictures of some exoplanets, planets near bright stars are just too dim to image without blocking the starlight.
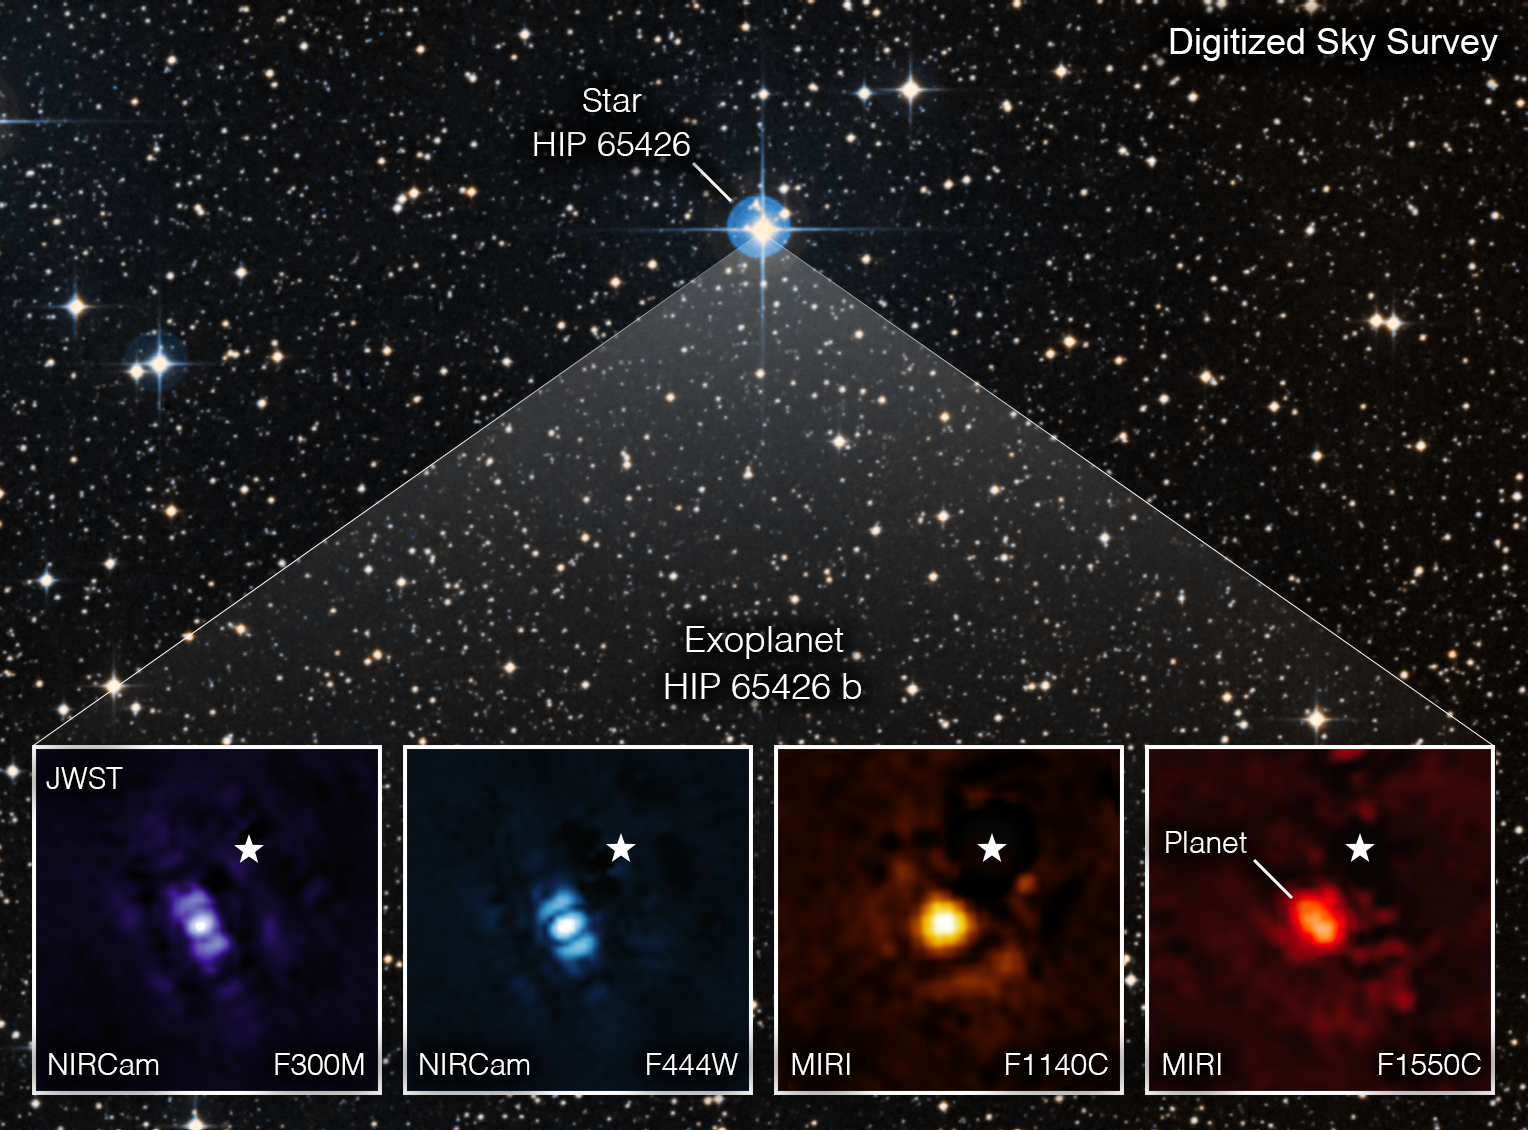
Despite this difficulty, Webb has successfully imaged exoplanets. Both of Webb's imagers, NIRCam (Near-Infrared Camera) and MIRI have devices known as coronagraphs, which are tiny masks that block out starlight so that we can see the planet. Other direct imaging modes require researchers to subtract the known shape of a point-like star as seen through Webb's mirrors and other optics to reveal the light from the faint planet.
Webb's first direct image of an exoplanet was taken of HIP 65426 b, a gas giant. It is about 100 times farther from its parent star than Earth is from the Sun. This distance makes it easy for Webb to separate the planet from the star using a coronagraph, which allowed Webb to take direct images of HIP 65426 b in multiple infrared wavelengths.
What's Next for Webb in Exoplanet Research?
The James Webb Space Telescope has ushered in a new era in exoplanet research. To learn about the diversity of exoplanets and their atmospheres, Webb is continuing to study a range of exoplanets, from hot Jupiters to small rocky planets. As Webb deepens our understanding of exoplanet systems, we are able to better understand our own solar system. This includes the details of how planetary atmospheres form and evolve over time, what separates gas giants from Neptune-like and rocky planets, and how the unique conditions of each planet and star system shape their physical and chemical properties.
Exciting discoveries of molecules such as methane on K2-18, further our discussions of potentially habitable worlds. Astronomers plan to use the full suite of Webb's instruments to study exoplanets like these, which are abundant in methane, carbon dioxide, and water, and may be promising places to search for evidence of habitability.
Hubble is also continuing to gather new data, obtaining ultraviolet and visible light images and spectra of the host stars, which will us understand how they affect their exoplanets. Further, NASA's upcoming Nancy Grace Roman Space Telescope, will help Webb and Hubble by surveying large swaths of sky to detect a wide-range of worlds, from the mysterious super-Earths and sub-Neptunes to familiar terrestrial planets perhaps similar to our own.
Keep Up to Date with Webb Science
Keep an eye on the news and follow Webb on Facebook, X, and Instagram.