Moon Essentials from NASA’s Scientific Visualization Studio
| Credit | NASA's Scientific Visualization Studio |
|---|---|
| Language |
|
See Earth's Moon from a new perspective with these NASA data visualizations:
Orbit
The visualization displays the shape and tilt of the Moon's orbit and the ways these change over the course of eight and a half years. Initially, we see the orbit edge-on, but this quickly moves to a view from above (or north of) the plane of the Earth's orbit around the Sun, called the ecliptic (here colored purple). The light blue ring represents the plane of the Moon's orbit, which is tilted about five degrees to the ecliptic. The darker half is below (south of) the ecliptic. The yellow arrow points toward the Sun.
Parallax
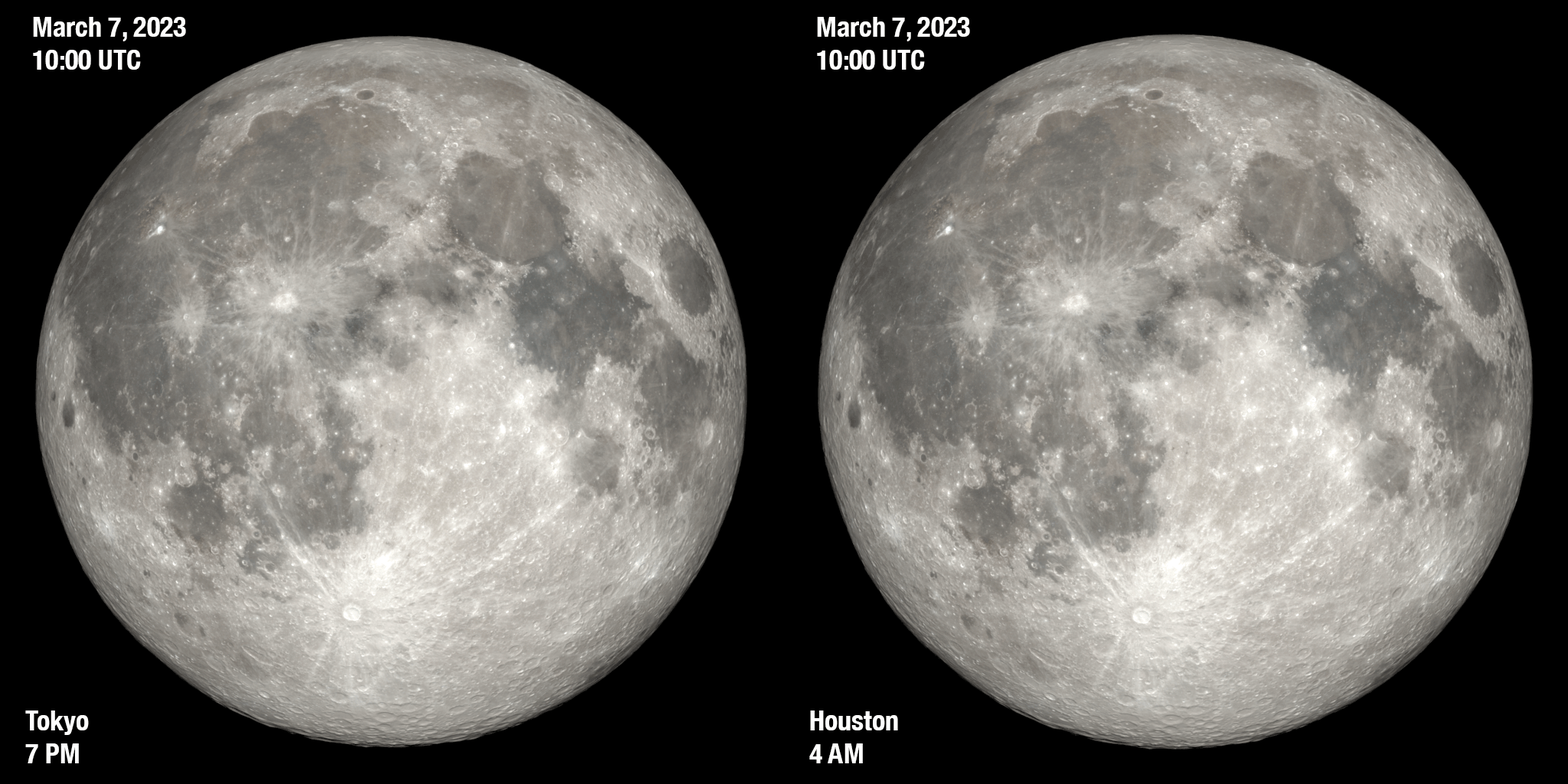
Parallax is the apparent shift in the position of an object when viewed from two locations. You can easily see this effect just by alternately closing your left and right eye. The effect is larger for objects closer to you and for observer locations that are farther apart. As the closest celestial object to the Earth, the Moon dramatically exhibits this effect when viewed from opposite sides of the globe.
The two-frame animated GIF compares views of the full Moon from Tokyo and from Houston at the same instant. The orientation and apparent size of the Moon are slightly different when viewed from the two locations.
Seasons at the Poles
The lunar South Pole will be the target of both robotic and human exploration missions in the coming years, and the timing of their arrival will be driven by, among other things, the seasonal ebb and flow of available sunlight there. Both the Earth and the Moon experience seasons caused by their axial tilt relative to the Sun.
In this visualization, the monthly rotation of the Moon has been frozen at full moon in order to highlight the small difference in axial tilt at South Pole summer and winter. The left half of the frame shows the western hemisphere of the Moon, including the Orientale basin on the terminator (day-night line). Only the lit half of this view is visible from Earth. The right half of the frame is an overhead view of the South Pole region, with the perfectly bowl-shaped Shackleton crater in the center. The near side (the side facing Earth) is up in this view.
Turntable Animation
In computer graphics, a turntable animation is a looping 360-degree view of a digital model that shows its shape and its interaction with light and the environment. The visualization is a turntable animation of a Moon model built from Lunar Reconnaissance Orbiter maps of the Moon's surface color and topography. Since the Moon rotates once per orbit, it's also a simplified view of the Moon's orientation relative to the Sun.
Libration in Latitude
Libration in latitude is an apparent north-south, up and down rotation of the Moon, as if the Moon were slowly nodding its head "yes."
The visualization shows how libration in latitude results mostly from the tilt of the Moon's orbit relative to its equator. In the first half of the animation, the Moon's orbit is tilted while its equator is nearly horizontal, supporting the notion that we are slightly above or below the Moon. But this is a matter of perspective. In the second half of the animation, the orbit is horizontal while the Moon's equator is tilted, giving the impression that the Moon's orientation and not our relative position is responsible for the polar reveals.
Libration in Longitude
Libration in longitude is an apparent east-west, side-to-side rotation of the Moon, as if the Moon were slowly shaking its head "no."
The visualization shows how libration in longitude is an effect of the Moon's orbital speed. The Moon spins on its axis at a slow, steady rate, turning once each orbit, which is why it always shows us more or less the same face. But it moves along its elliptical orbit at a speed that varies depending on how close it is to the Earth.
In the animation, the red dot marks the position of a fictitious moon moving in a circular orbit at a constant speed. The real Moon pulls ahead or lags behind the red dot as it moves past the nearest and farthest points in its orbit, called perigee and apogee.


