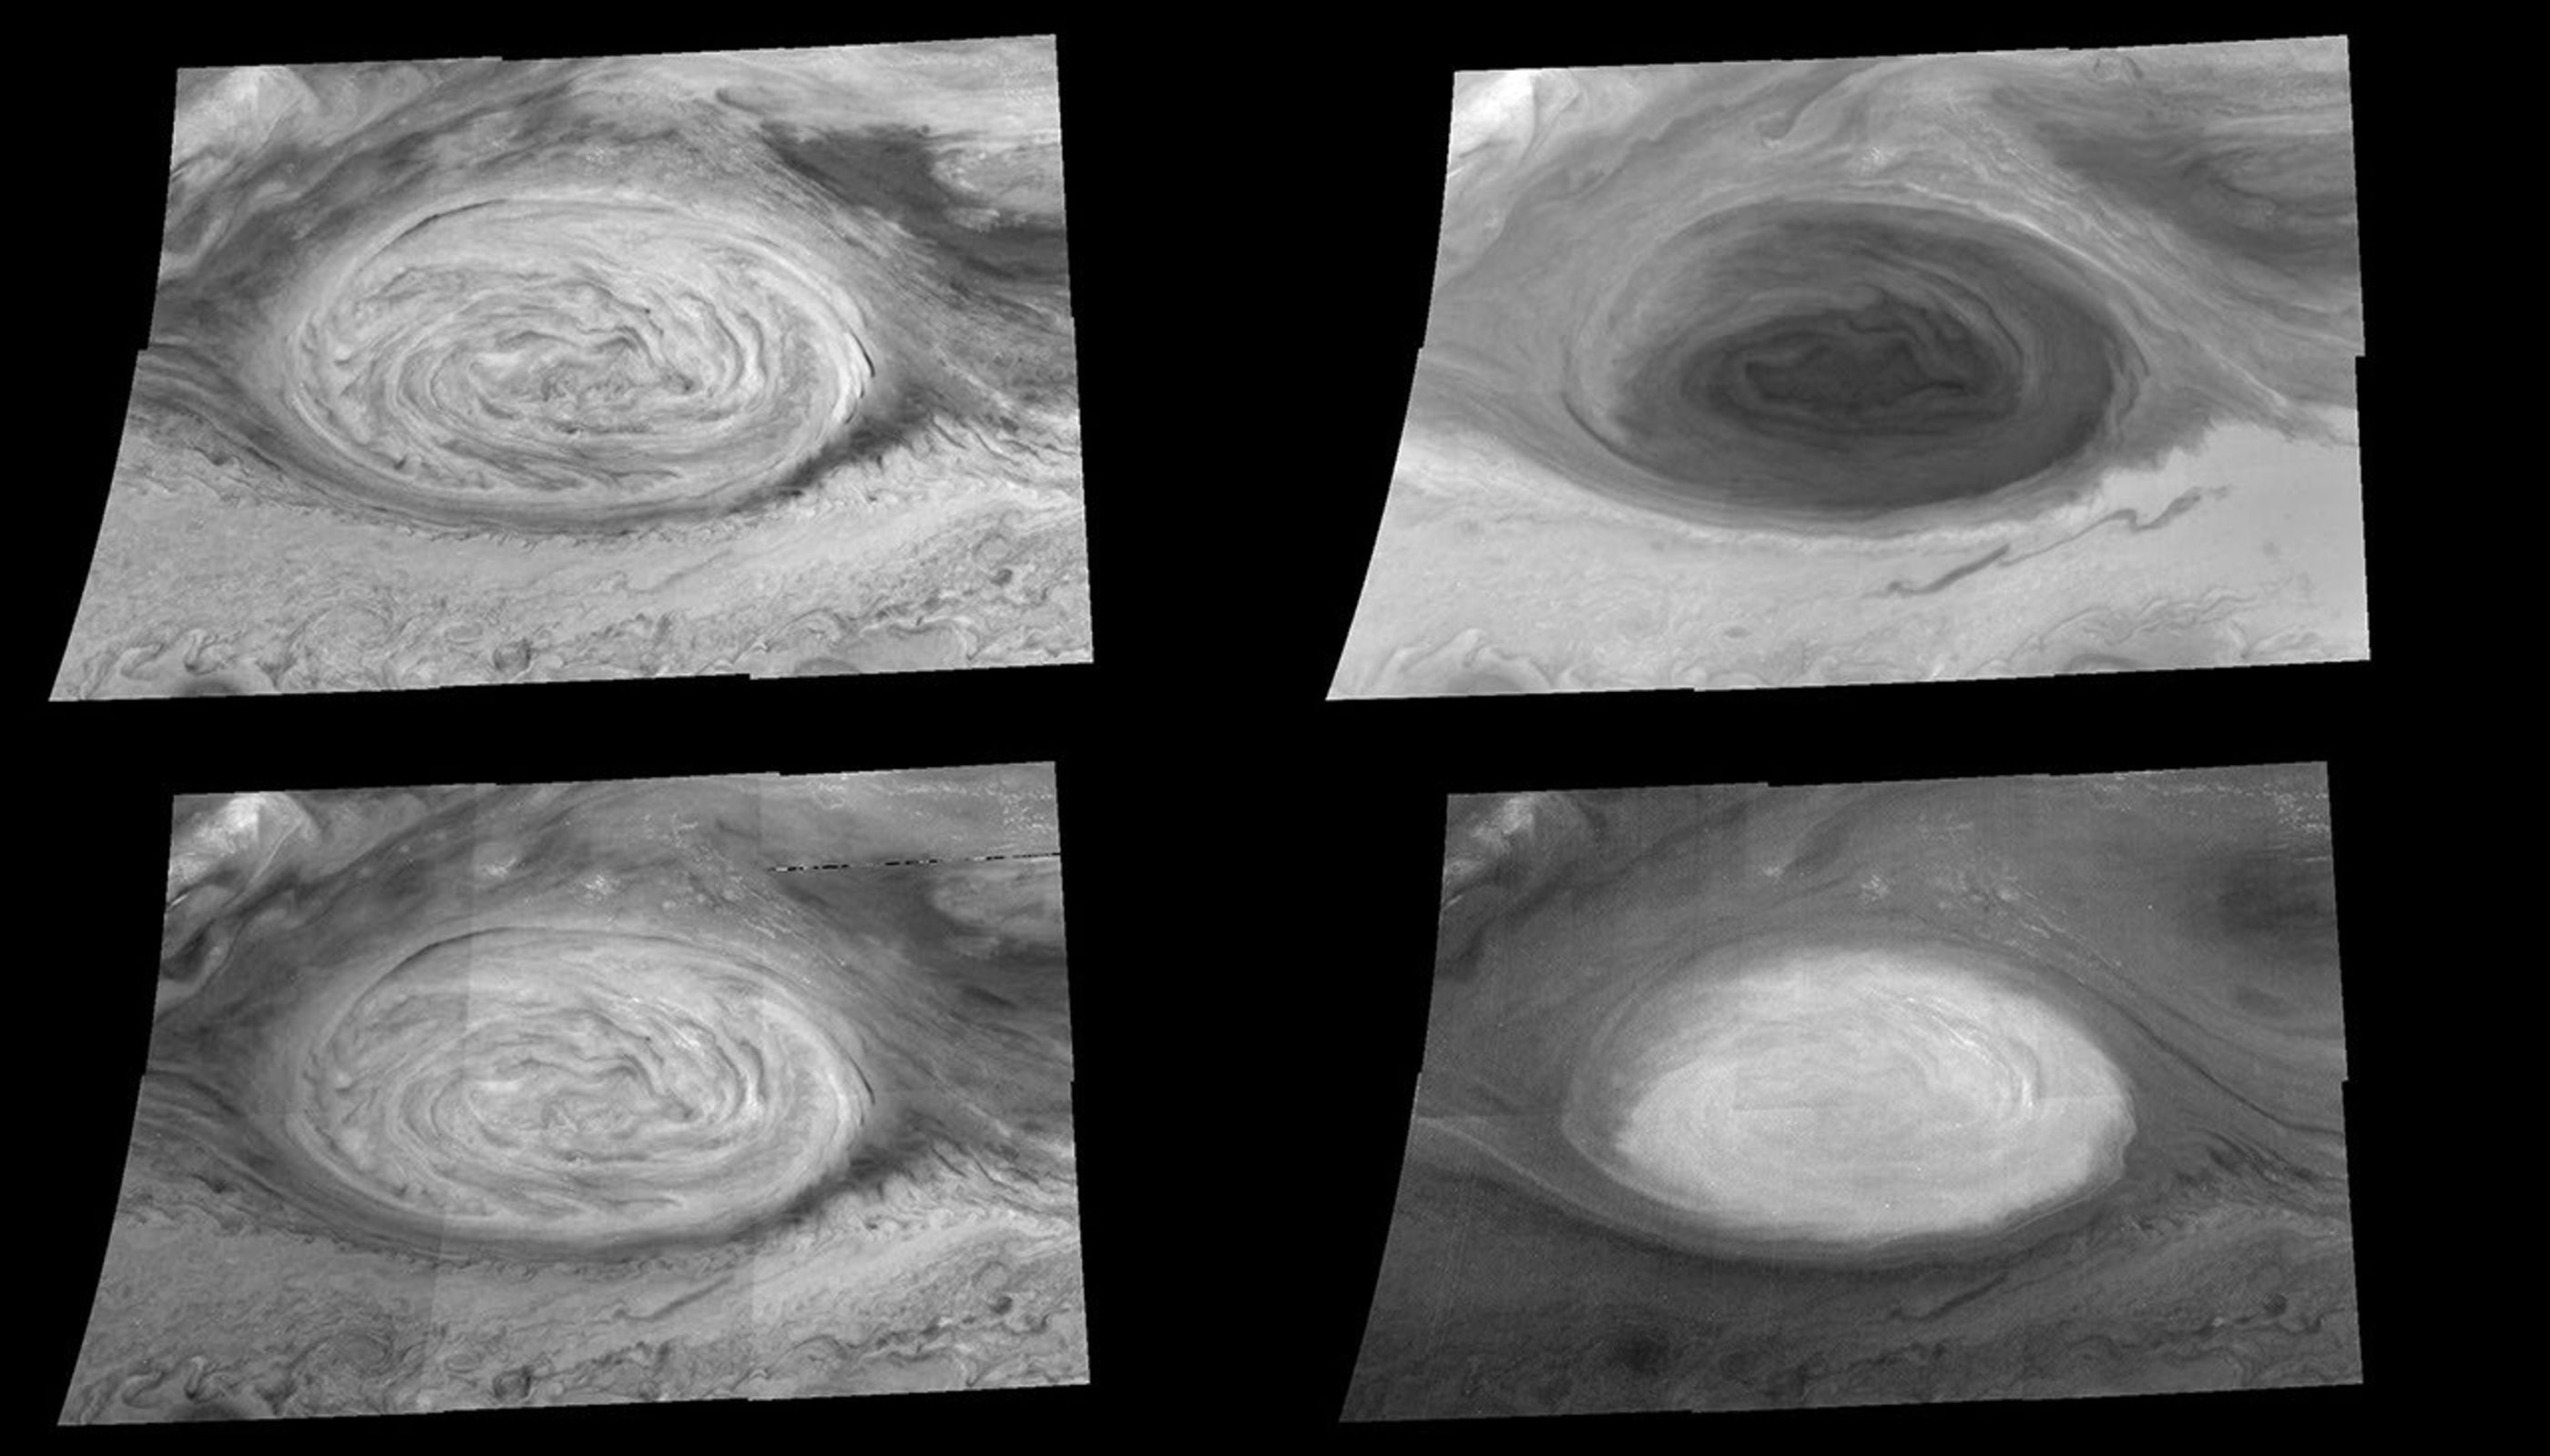
The Great Red Spot at Four Different Wavelengths
| Credit | NASA/JPL-Caltech |
|---|---|
| PIA Number | PIA00721 |
| Language |
|
These mosaics (6 frames each) show the appearance of the Great Red Spot in infrared light (757 nanometers at upper left), violet light (415 nanometers at upper right), and infrared light within both a weak (732 nanometers at lower left) and a strong (886 nanometers at lower right) methane absorption band. The images were taken within minutes of each other. Reflected sunlight at each of these wavelengths penetrates to different depths and is scattered or absorbed by different atmospheric constituents before detection by Galileo.
The violet mosaic reveals the relative abundances of chemicals that color Jupiter's atmosphere. The three infrared images respectively probe higher in Jupiter's atmosphere. The highest features, such as the diffuse haze that overlies the Great Red Spot and the small clouds to the northeast of it, are most apparent on the 886 nm mosaic. North is to the top in all frames. Each pixel subtends a square about 30 kilometers on a side. The images were obtained on June 26, 1996 by the Solid State Imaging system on board NASA's Galileo spacecraft.

