


After the “dust bowl” years of the 1930s—in which much of the Great Plains region of North America suffered extreme drought conditions for years with devastating economic consequences—overall climate conditions have grown wetter with each passing decade. Station rain gauge records around the world reveal that over the last century annual precipitation has increased by about 2.4 mm per decade, on average, with much of the increase concentrated in North America (Dai et al. 1997).
But despite the general increase in rainfall, in almost any given year meteorologists can point to a region on the map that experienced drought. Precipitation patterns can vary widely on regional scales, from one season to the next, and from year to year. It is hard to predict accurately where and how much rain will fall next week. It is harder still to forecast next year's rainfall patterns.
Consider, from 1995 to 1996, the northwestern and northeastern regions of the U.S. received higher than normal rainfall amounts, while precipitation in Alaska, eastern Canada, and the central and southwestern U.S. was substantially below normal (Bell and Halpert 1997). Then, from January through the summer of 1998 there was excessive rainfall in California and across much of the central and southern United States, while the Gulf Coast states and Mexico experienced severe drought (Bell et al. 1998). In the summer of 2000, drought hit hard in southeastern states like Georgia and Alabama while much of Texas has gone more than 67 consecutive days without rain. An increasing number of scientists say we are in for more extreme "wet" and "dry" events, and we can expect them more often as average global temperatures rise (Dai et al. 1998).
Poring over data from satellite remote sensors, ground-based rain gauges, shipborne measurements, and even historical samples taken from sediment strata in dried rivers and lakebeds, researchers are painstakingly piecing together a picture of dry spells in North America. Where and how often do droughts typically occur, and with what intensity? And, perhaps most important, what causes them? The goal is to use these new data to construct computer models that will help scientists predict the onset of a drought weeks, months, or even a year ahead of its arrival.
Physical Processes that Cause Drought
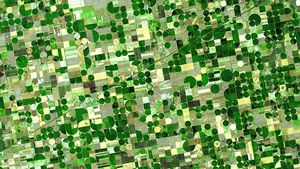
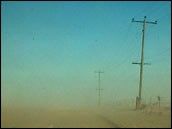
In the spring and summer of 1988, the skies dried over a region covering about 25 percent of the total U.S. area, centered mostly on the Northern Great Plains. It was North America's worst dry spell since the 1930s, impacting the nation's most productive agricultural lands and causing an estimated $40 billion in crop damages (Kogan 1997). However, researchers were watching closely-with satellite and surface-based instruments-and the event gave them an opportunity to study in detail the physical processes that contributed to the drought.


Generally speaking, there are three main contributors to drought: (1) land and sea surface temperatures, (2) atmospheric circulation patterns, and (3) soil moisture content (Trenberth and Guillemot 1996; Mo et al. 1997). Each of these physical parameters is linked to the others intricately; changing any one of them significantly will typically set up a chain of events that causes the other parameters to change. Sometimes, this chain of events becomes a vicious cycle in which the changing parameters, feeding off one another, are amplified to produce extreme climate conditions-such as flood or drought.
Researchers using global climate models find that as average surface temperatures rise there is an increase in water evaporation leading to more extreme weather events (Dai et al. 1998). In summer, land surface temperatures are linked directly to the availability of moisture (Trenberth and Guillemot 1996). If the soils are wet, then much of the heat from incoming sunlight is used to evaporate water, so temperatures are kept cooler and there is generally more precipitation. But if the soil is dry, then there is little or no water available to evaporate. Consequently, the incoming sunlight can only continue to warm the surface, thereby making conditions hotter and drier, thus beginning the chain of events leading toward drought.
Atmospheric circulation patterns can make or break a vicious drying cycle. Scientists observe that atmospheric circulation is closely connected to the surface temperature of the sea. Heat released from the ocean creates temperature gradients in the atmosphere that cause air currents. And because warm water evaporates more readily than cold water, warmer sea surface temperatures contribute to more cloud formation and more rainfall downwind of the general flow of air currents.
Using satellite remote sensing data, scientists have confirmed there is a direct relationship between sea surface temperature variations in the Atlantic and Pacific Oceans and large-scale atmospheric circulation patterns that bring rain or dry spells (Trenberth and Guillemot 1996). Scientists have used satellites to demonstrate that variations in sea surface temperature can determine where there is high plant growth on land and where there is drought (Los et al. 2000). Researchers refer to the two seemingly unrelated parameters (sea surface temperature and land plant growth) as a "teleconnection" in the Earth's climate system.

Here's how the teleconnection works. Warm air is less dense than cold air and tends to rise, resulting in an upward transport of heat (called convection). Unusually high or low sea surface temperatures (referred to as “anomalies”) affect the intensity and location of areas of convection. Large-scale anomalies like El Niño and La Niña influence convection on such a large scale that they cause the location of the Intertropical Convergence Zone (ITCZ) to shift southward or northward, respectively. The ITCZ in the Pacific helps determine the course of Pacific air masses flowing eastward toward North America. Thus, changing the ITCZ's position influences weather patterns all over the continent. (The ITCZ is the region of convection that circles the Earth, near the equator, where the trade winds of the Northern and Southern Hemispheres come together. The intense exposure to sunlight in the equatorial region warms the surface water causing increased evaporation and warming of the air near the surface. Thus the air is both warmer and has increased humidity. The warm moist air rises and as it rises it cools, releasing the accumulated moisture in an almost perpetual series of thunderstorms.) When precipitation patterns change across landscapes, so too do plants' patterns of growth.
Certain regions seem particularly susceptible to influence by sea surface temperature and air current variations. In the Great Plains region, for example, researchers find that about 75 percent of a year's worth of precipitation falls from April to September (Laird et al. 1996). Examining recent rainfall data, researchers found that over a recent 17-year period (1979-95) there were 21 “wet” and 19 “dry” events, both of which lasted an average of 17 days (Mo et al. 1997). Both types of events are fairly distributed throughout the summer months (Mo et al. 1997). In North American wet years, the heaviest rains fell over the Great Plains region, while in dry years most rain fell in Florida, along the Gulf Coast, Arizona, and New Mexico (Mo et al. 1997). [Editor's note: because there are many teleconnections between sea surface temperature, rainfall patterns, and plant growth, the Earth Observatory presents each teleconnection as an individual sidebar to this article.]
Remembering the Drought of 1988

The Pacific La Niña was intense in 1988. Scientists observed a series of processes that the cold surface temperature anomaly set into motion that made it directly responsible for the severe North American drought in the Great Plains region (Trenberth and Guillemot 1996; Mo et al. 1997; Dai et al. 1998). They found that the atmospheric circulation patterns leading to the dry spell began in April of that year, about 10 days before the onset of the drought, and persisted through June (Mo et al. 1997). Scientists also measured anomalously low values of outgoing longwave radiation (heat) over the eastern Pacific near Central America, signaling a northward shift of the ITCZ. At the same time, there were unusually high levels of outgoing longwave radiation over the Gulf of Mexico, the southeastern United States, and northeastern South America. Scientists have observed similar anomalies in outgoing longwave radiation in 16 of the last 19 major drought events in North America (Mo et al. 1997), suggesting there is a relationship between them and drought episodes.


During La Niña years there is usually a weakening of the lower level jet stream that typically brings moisture into central North America from the Gulf of Mexico. A large anti-cyclone (or high-pressure system) often forms over the Great Plains, characterized by winds rotating clockwise (in the Northern Hemisphere) at about 10 meters per second or less. Air masses within the anti-cyclone tend to sink vertically downward and, upon reaching the ground, diverge outward away from the center of the system. This general sinking of the air inhibits the formation of clouds and precipitation. It is the anti-cyclone over the Great Plains that blocks or weakens the lower level jet stream and, thus, prevents or inhibits the transport of moisture into the region from the Gulf. Anti-cyclones tend to move in the direction of strong sources of warm air advection. (Here, "advection" refers to the horizontal movement of air masses.) In the U.S., then, anti-cyclones usually travel toward the east or southeast, sometimes transporting their dry conditions with them. Interestingly, the mid-western dry spell in the summer of 2000 shifted southeastward toward Georgia and Florida in early July.
There are a number of other interesting parallels between the summers of 1988 and 2000. The first part of 2000 saw the remnants of a strong La Niña in the Pacific along with anomalously low springtime snow cover over North America, which contributed to very dry soil conditions in late winter and early spring. As temperatures warmed, very little moisture was available for evaporation to help offset the oncoming heatwave. And, still under the influence of La Niña, the prevailing atmospheric circulation patterns didn't bring moisture into the region, so the vicious drying cycle plunged regions of the mid-west headlong into a severe drought for most of the spring and summer.
The Long-Term Perspective
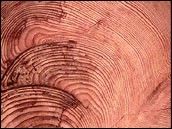
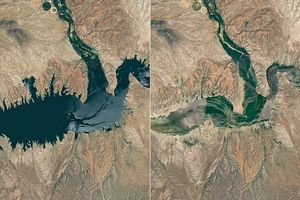
By examining sediment deposits in lake beds and measuring old-growth tree rings throughout the Northern Great Plains region, scientists are gaining a longer-term perspective on patterns of drought in North America. The theory is that when lake levels were high, the water was fresher, and when the lake levels were low, the water would have been saltier, which can be measured in the sediment layers deposited during a given period. This theory was confirmed by scientists who studied Moon Lake (North Dakota) sediment deposits from the 1890s and 1930s, both known to be extreme drought years from historical records (Laird et al. 1996). Likewise, Giant Sequoia trees in San Joaquin Valley, California, exhibit less growth during very dry years (Laird et al. 1996).
Analysis of the data from these sources suggests that extreme drought events in North America were much more frequent, severe, and longer lasting during the period from about 2,300 years ago to about 1200 AD (Laird et al. 1996). The data show that there were quite a few droughts that persisted for more than a century. The Moon Lake region, for example, shows signs of drought lasting from about 200 to 370 AD, from 700 to 850 AD, and again from 1000 to 1200 AD (Laird et al. 1996).
Around 1200 AD, with the onset of the “Little Ice Age,” the climate in North America became generally cooler and wetter and, with the exception of relatively brief periods of drought, these wet conditions have predominated ever since (Laird et al. 1996). Why were North American dry spells before 1200 AD so severe and long-lived? Scientists suggest the answer to that question may have to do with cycles of solar activity and fluctuations of carbon dioxide in the Earth's atmosphere (Laird et al. 1996). Whatever the cause, historical evidence suggests that for about 1,500 years there was a pattern of persistent upper-level anti-cyclones (high-pressure systems) over the Great Plains region.
Could we see a return to the mode of climate behavior that North America experienced before 1200 AD? Researchers cannot answer that question now, but there is mounting concern among Earth scientists that as the level of atmospheric carbon dioxide rises, and average global temperature with it, we will see profound effects on oceanic and atmospheric circulation patterns that will, in turn, significantly affect precipitation patterns. As they continue to analyze the growing body of data from both current and historical data sources, they will also continue to develop newer and better computer models to help them improve drought forecasts-in both timing and severity-months or even years ahead of time.
References
- Bell, Gerald D. and Michael S. Halpert, 1998: "Climate Assessment for 1997." Bulletin of the American Meteorological Society, Vol. 79, No. 5; pp. S1-S50.
- Bell, Gerald D., Michael S. Halpert, Chester F. Ropelewski, Vernon E. Kousky, Arthur V. Douglas, Russell C. Schnell, and Melvyn E. Gelman, 1999: "Climate Assessment for 1998." Bulletin of the American Meteorological Society, Vol. 80, No. 5; pp. S1-S48.
- Dai, Aiguo, Inez Y. Fung, and Anthony D. Del Genio, 1997: "Surface Observed Global Land Precipitation Variations During 1900-88." Jounal of Climate, Vol. 10, pp. 2943-62.
- Dai, Aiguo, Kevin E. Trenberth, and Thomas R. Karl, 1998: "Global Variations in Droughts and Wet Spells: 1900-1995." Geophysical Research Letters, Vol. 25, No. 17; pp. 3367-70.
- Kogan, Felix, 1997: "Global Drought Watch From Space." Bulletin of the American Meteorological Society, Vol. 78, No. 4; pp. 621-36.
- Laird, Kathleen R., Sherilyn C. Fritz, Kirk A. Maasch, and Brian F. Cumming, 1996: "Greater Drought Intensity and Frequency Before AD 1200 in the Northern Great Plains, USA." Nature, Vol. 384; pp. 552-54.
- Los, Sietse O., G. James Collatz, L. Bounoua, Piers J. Sellers, Compton J. Tucker, 2000: "Global Interannual Variations in Sea Surface Temperature and Land Surface Vegetation, Air Temperature, and Precipitation." Journal of Geophysical Review, in press.
- Mo, Kingtse C., J. Nogues Paegle, and R. Wayne Higgins, 1997: "Atmospheric Processes Associated with Summer Floods and Droughts in the Central United States." Journal of Climate, Vol. 10; pp. 3028-46.
- Trenberth, Kevin E. and Christian J. Guillemot, 1996: "Physical Processes Involved in the 1988 Drought and 1993 Floods in North America." Journal of Climate, Vol. 9; pp. 1288-98.
Drought Over the Great Plains
Without moisture from the Gulf of Mexico, the center of North America would be a desert. The prevailing winds that blow from west to east across the continent are relatively dry, as they originate over the cold water of the north Pacific. Much of the moisture these winds do carry is dumped at the foot of the mountain ranges that run up the West Coast. As a result, very little moisture is transported from the Pacific Ocean to the Great Plains. However, the air over the Gulf of Mexico to the south of the Great Plains is saturated with water evaporated from the warm surface waters. In normal summer conditions, storm systems periodically transport moisture northward.
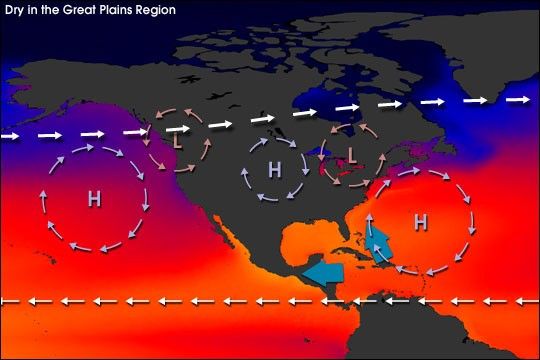
During droughts (above), the flow of moisture from the Gulf to the Great Plains is cut off. When the Intertropical Convergence Zone (ITCZ) shifts north, often during La Niña, it pushes the trade winds that blow from east to west in the northern tropics further northward. These winds push moisture from the Gulf over Mexico and Central America, leading to above average rainfall in those regions. The large high-pressure system usually centered near Bermuda moves additional water from the Gulf up the Atlantic Coast of the United States, eventually depositing it in the Canadian provinces of New Brunswick and Nova Scotia. Also, the Jet Stream moves north, and a high-pressure system (dry air that rotates clockwise in the northern hemisphere) develops over the northern Plains. These conditions persisted throughout the summer of 1988, leading to one of the worst droughts in U.S. history.
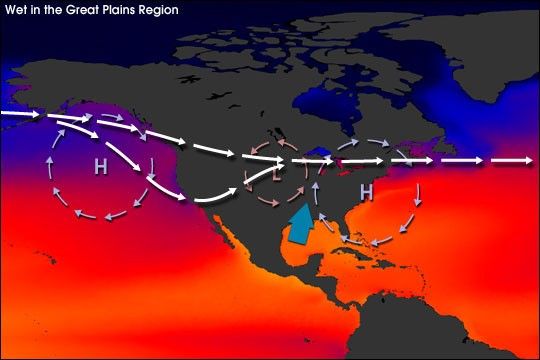

During wet years, more moisture than normal is transported from the Gulf of Mexico to the Great Plains. The Jet Stream shifts south from its normal position, and a branch extends to southern California. The Jet Stream is deflected by the Rocky Mountains creating a low-pressure zone. This “low” draws moist air from the Gulf into the Plains. At the same time, less moisture than normal moves northwards along the Atlantic Coast, often resulting in drought there. In 1993, these atmospheric conditions caused record floods along the Missouri and upper Mississippi Rivers. During that year, the Ohio River, which receives most of its moisture from the Atlantic, was at exceptionally low levels, and the flooding on the Mississippi subsided below the intersection of the two rivers in St. Cairo, Illinois.
NASA Earth Observatory story by David Herring