

























Suggested Searches

1 min read

Hurricane Ignacio

Instruments:
2024-08-25 12:00:00
August 25, 2003

animations:
animation (4 MB MPEG)

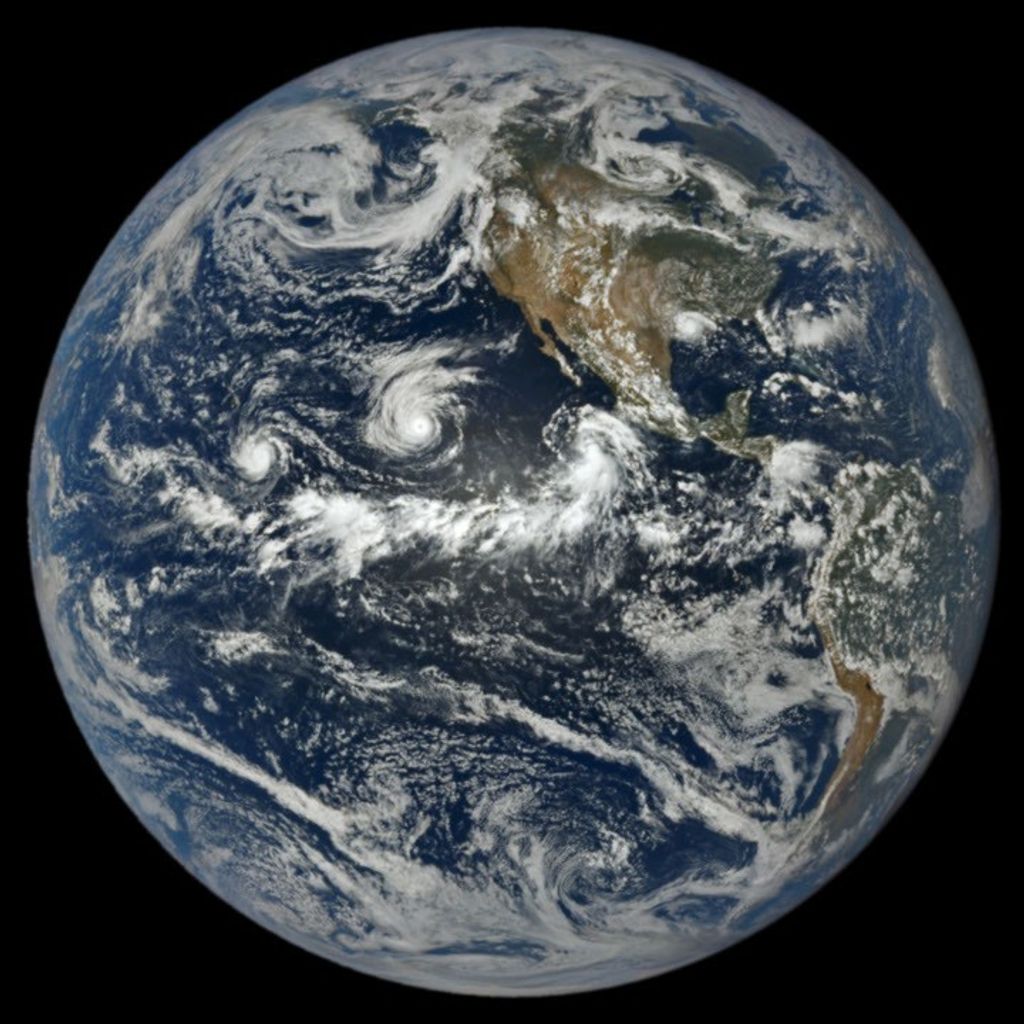
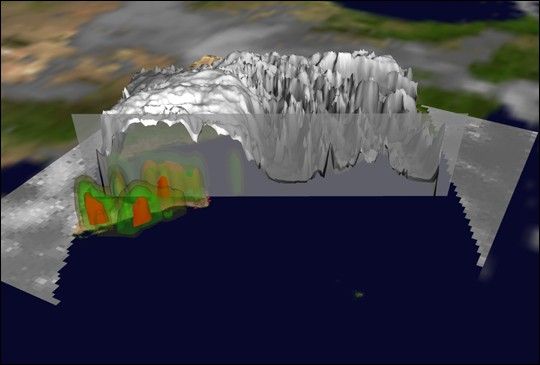
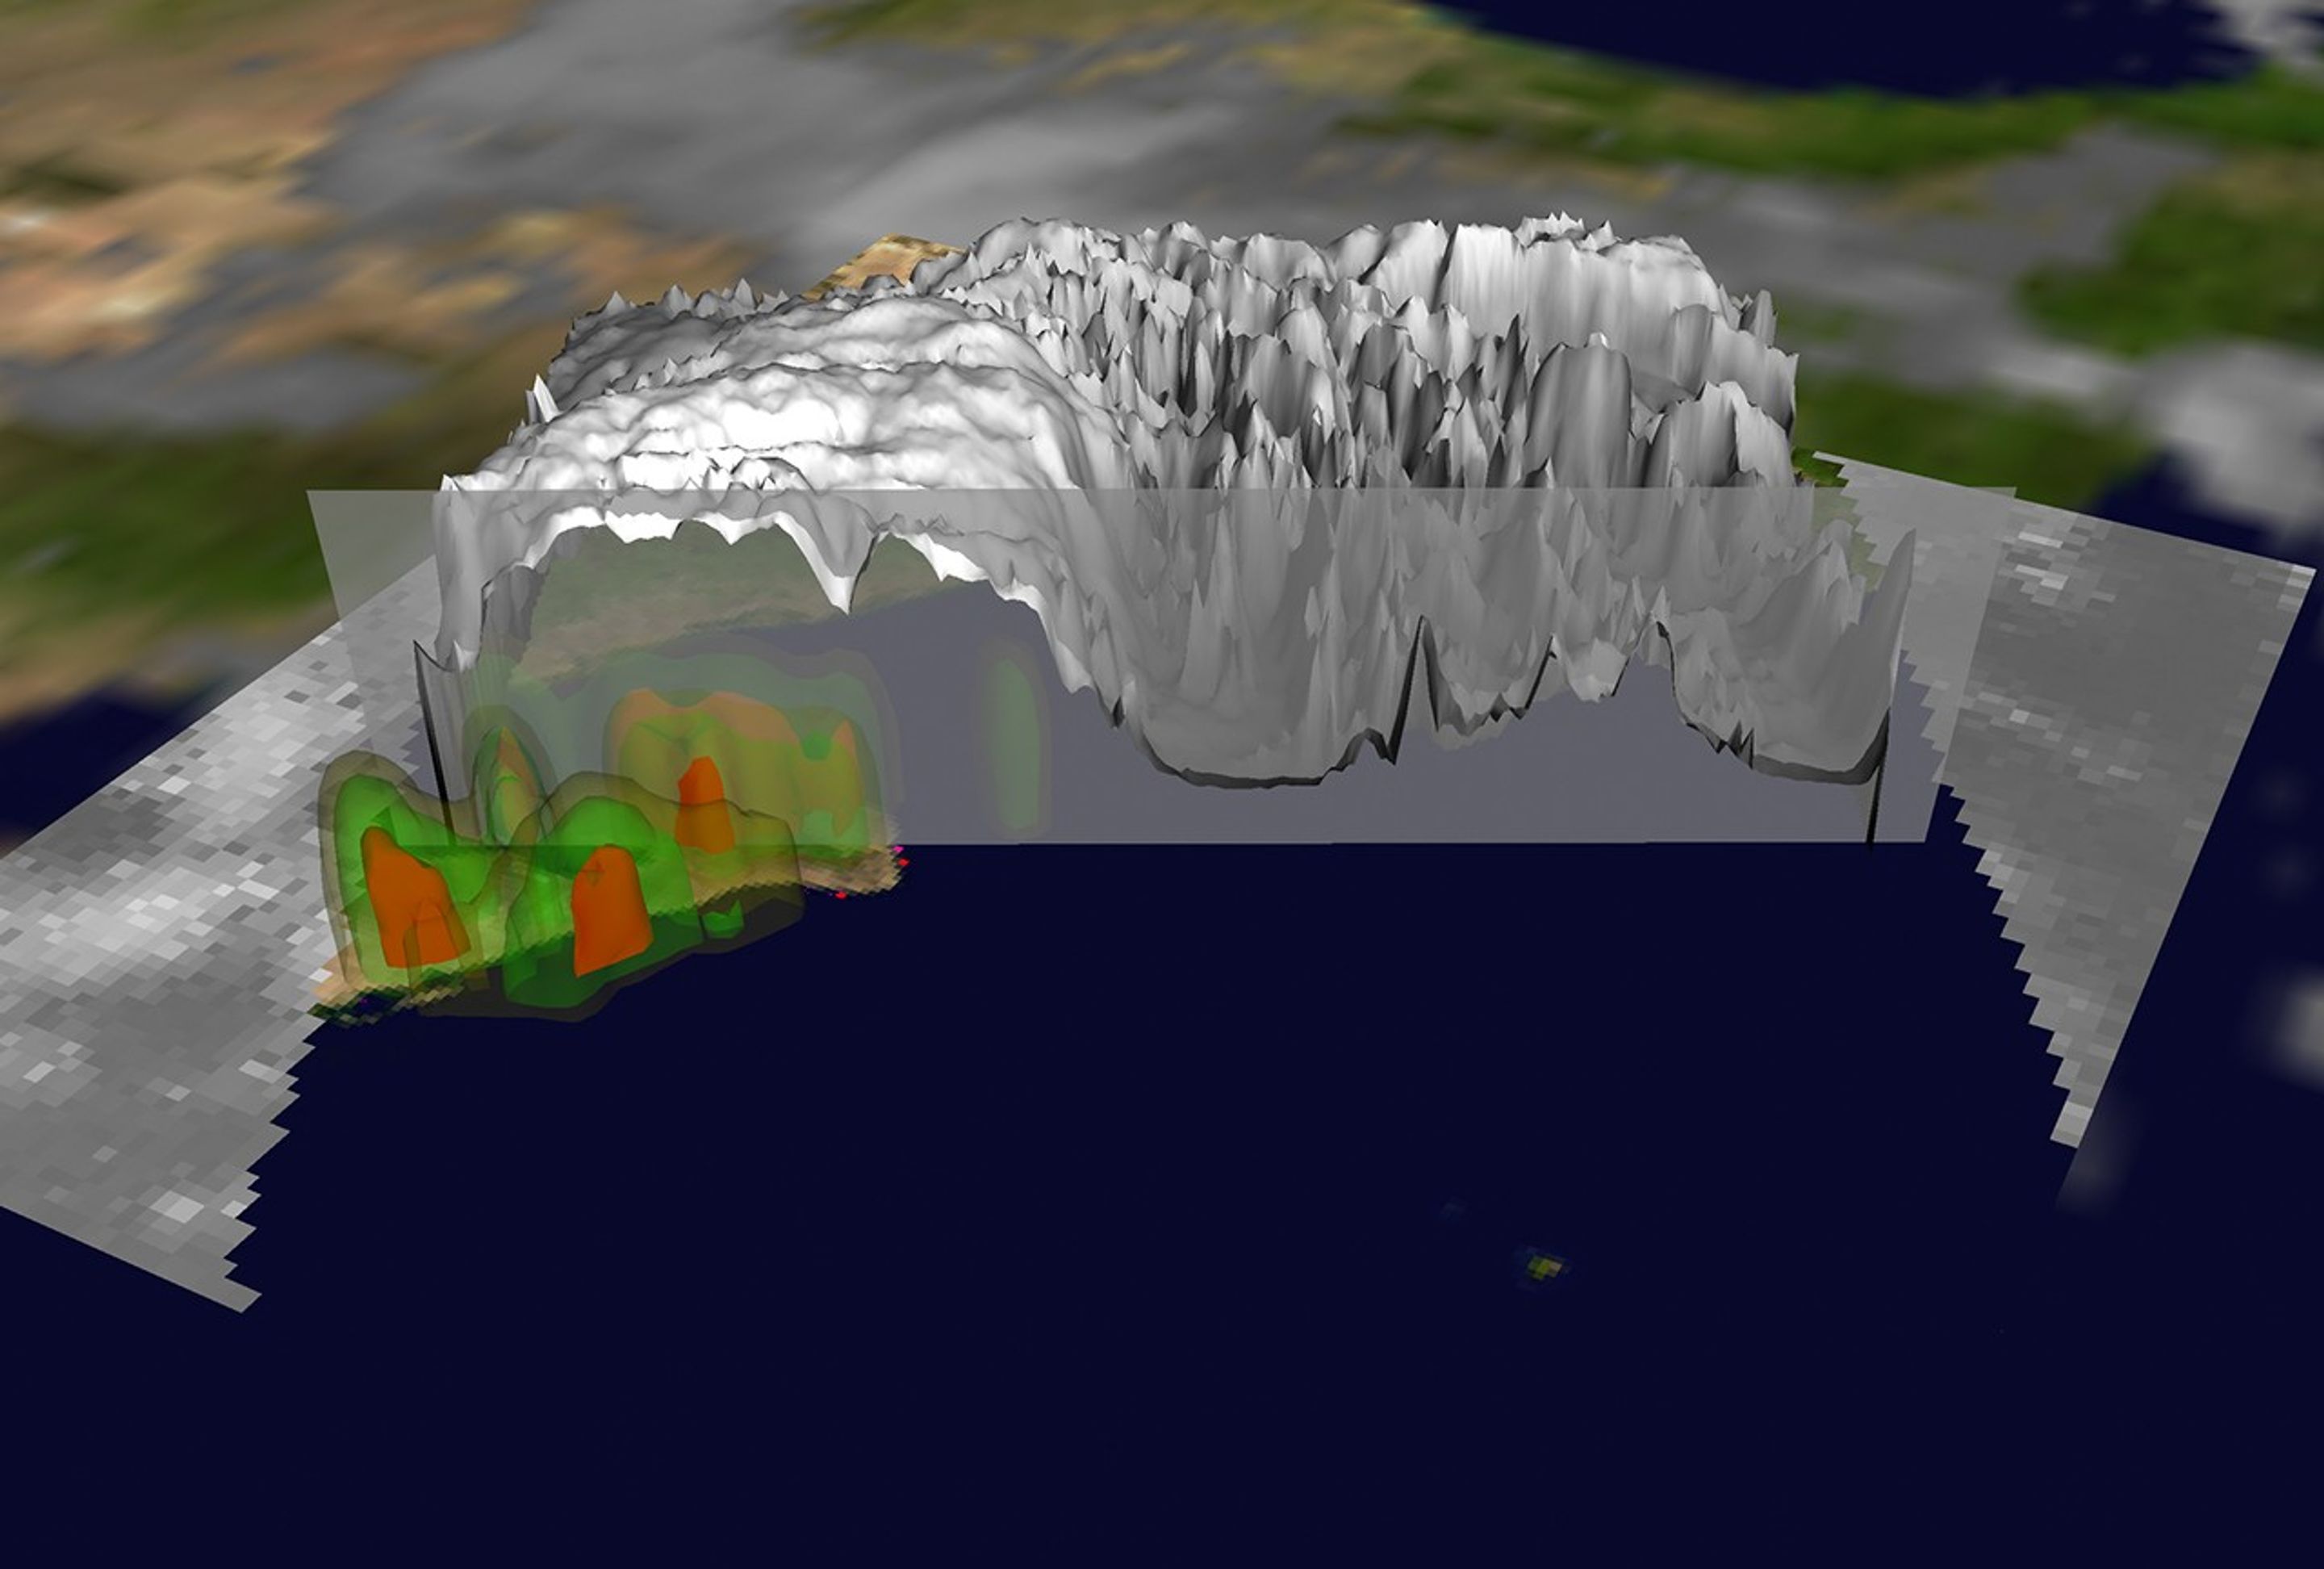
As Hurricane Ignacio was churning in the waters near Baja, California, the TRMM and GOES satellites captured this image. The accompanying visualization zooms down to the storm and peels away the clouds to reveal the underlying rain structure. Greens represent areas where rain is falling at a rate of 1 inch per hour while the red areas are indicative of rain rates of 2 inches per hour.

References & Resources

Images and animations courtesy NASA/Goddard Space Flight Center Scientific Visualization Studio.
You may also be interested in:

Stay up-to-date with the latest content from NASA as we explore the universe and discover more about our home planet.

Tropical Storm Arthur
2 min read

The first named storm of the 2026 Atlantic hurricane season brought intense rainfall and the threat of flash flooding to…

Article
Typhoon Jangmi
2 min read

The sprawling storm promised to deliver torrential rain across a wide swath of southern Japan.

Article
A Fault Line in Full Bloom
5 min read

Plains around the San Andreas Fault and across Carrizo Plain National Monument are awash with yellow as wildflowers bloom.

Article