


One of NASA’s newest Earth-observing instruments, the SeaWindsscatterometer aboard Japan’s Advanced Earth Observing Satellite(ADEOS) 2—now renamed Midori 2—has successfully transmitted its firstradar data to our home planet, generating its first high-quality images.
From its orbiting perch high above Earth, SeaWinds on Midori 2(‘midori’ is Japanese for the color green, symbolizing theenvironment) will provide the world’s most accurate, highestresolution and broadest geographic coverage of ocean wind speed anddirection, sea ice extent and properties of Earth’s land surfaces.It will complement and eventually replace an identical instrumentorbiting since June 1999 on NASA’s Quick Scatterometer (QuikScat)satellite. Its three- to five-year mission will augment a long-termocean surface wind data series that began in 1996 with launch of theNASA Scatterometer on Japan’s first ADEOS spacecraft.
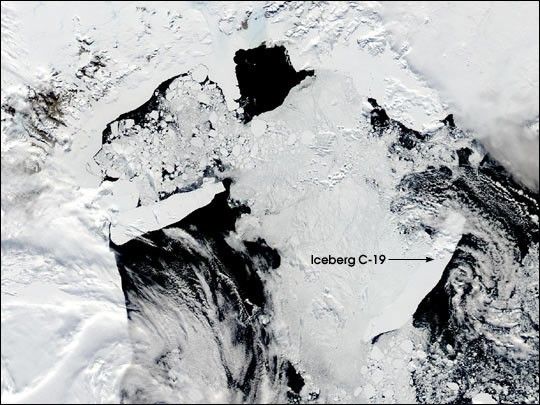
Climatologists, meteorologists and oceanographers will soon routinelyuse data from SeaWinds on Midori 2 to understand and predict severeweather patterns, climate change and global weather abnormalities likeEl Niño. The data are expected to improve global and regional weatherforecasts, ship routing and marine hazard avoidance, measurements of seaice extent and the tracking of icebergs, among other uses.
“Midori 2, its SeaWinds instrument and associated groundprocessing systems are functioning very smoothly,” said MoshePniel, scatterometer projects manager at NASA’s Jet PropulsionLaboratory, Pasadena, Calif. “Following initial checkout andcalibration, we look forward to continuous operations, providing vitaldata to scientists and weather forecasters around the world.”
“These first images show remarkable detail over land, ice andoceans,” said Dr. Michael Freilich, Ocean Vector Winds ScienceTeam Leader, Oregon State University, Corvallis, Ore. “Thecombination of SeaWinds data and measurements from other instruments onMidori 2 with data from other international satellites will enabledetailed studies of ocean circulation, air-sea interaction and climatevariation simply not possible until now.”
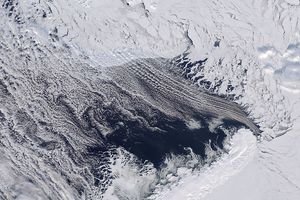
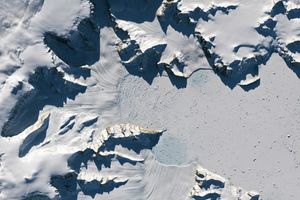
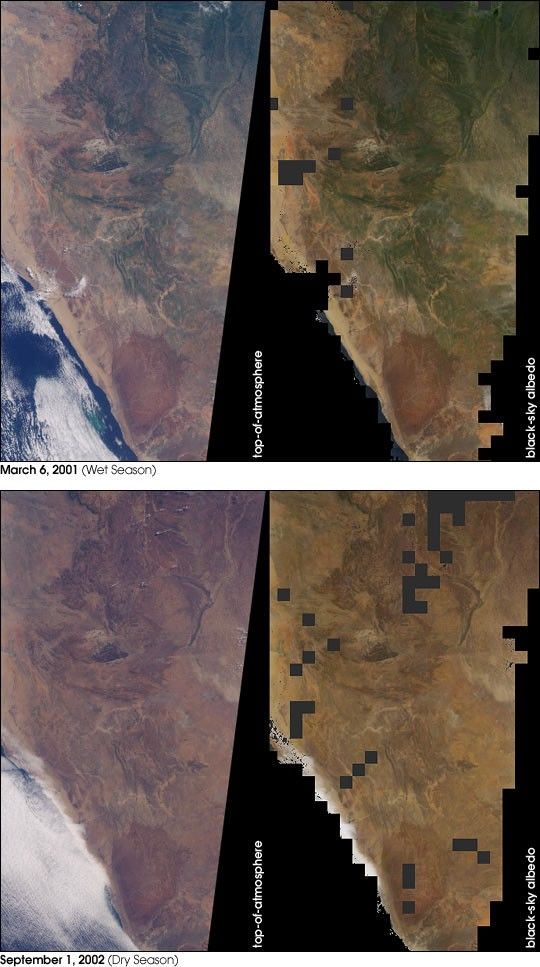
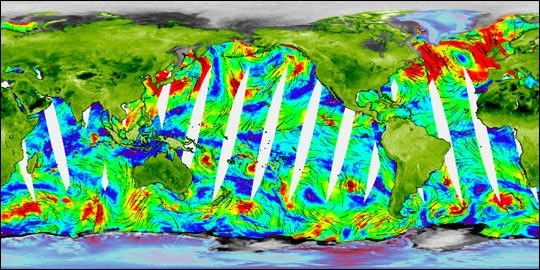
The released image, obtained from data collected January 28-29,depicts Earth’s continents in green, polar glacial ice-coveredregions in blue-red and sea ice in gray. Color and intensity changesover ice and land are related to ice melting, variations in land surfaceroughness and vegetation cover. Ocean surface wind speeds, measuredduring a 12-hour period on January 28, are shown by colors, with bluescorresponding to low wind speeds and reds to wind speeds up to 15 metersper second (30 knots). Black arrows denote wind direction. White gapsover the oceans represent unmeasured areas between SeaWinds swaths (theinstrument measures winds over about 90 percent of the oceans each day).
SeaWinds transmits high-frequency microwave pulses to Earth’sland masses, ice cover and ocean surface and measures the strength ofthe radar pulses that bounce back to the instrument. It takes millionsof radar measurements covering about 93 percent of Earth’s surfaceevery day, operating under all weather conditions, day and night. Overthe oceans, SeaWinds senses ripples caused by the winds, from whichscientists can compute wind speed and direction. These ocean surfacewinds drive Earth’s oceans and control the exchange of heat,moisture and gases between the atmosphere and the sea.
Launched December 14, 2002, from Japan, the instrument was firstactivated on January 10 and transitioned to its normal science mode onJanuary 28. A four-day dedicated checkout period was completed onJanuary 31. A six-month calibration/validation phase will begin inApril, with regular science operations scheduled to begin this October.
References & Resources
Image courtesy NASA/JPL SeaWinds science team.