


![Request for Information – Potential [Placeholder for Prize]](https://assets.science.nasa.gov/dynamicimage/assets/science/psd/solar/2023/09/s/solarsystem_0.jpg?w=1024)


June 18, 2001-June 25, 2024
Building Out Chattanooga
Though not among the largest or fastest-growing U.S. cities, Chattanooga’s population has grown considerably in recent decades, rising from about 350,000 people in 2001 to 437,000 in 2024.
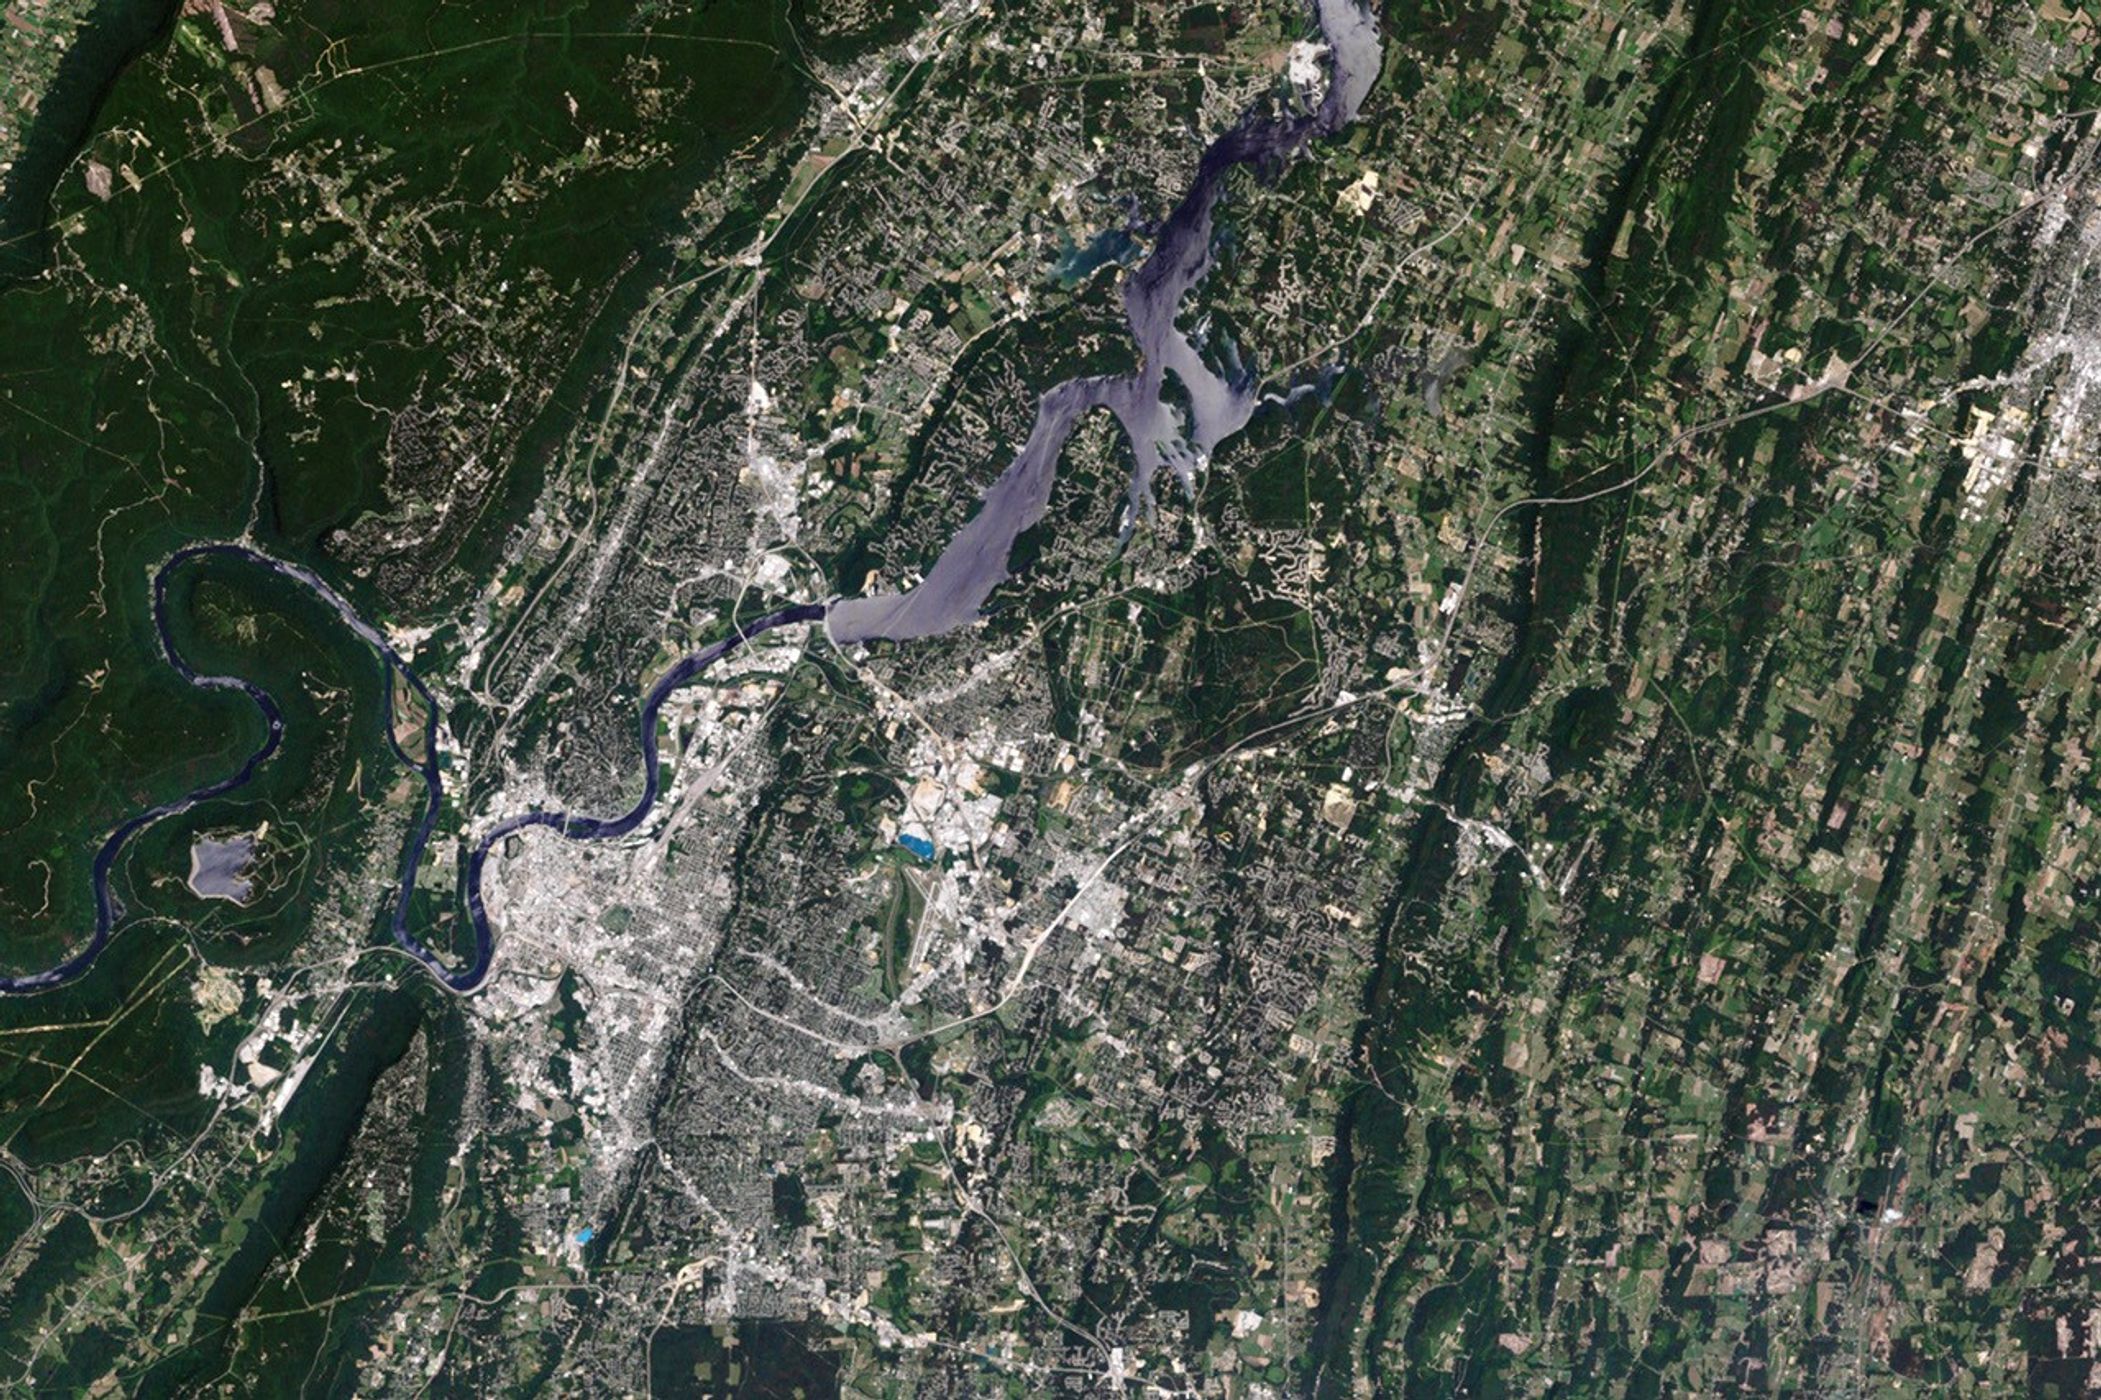
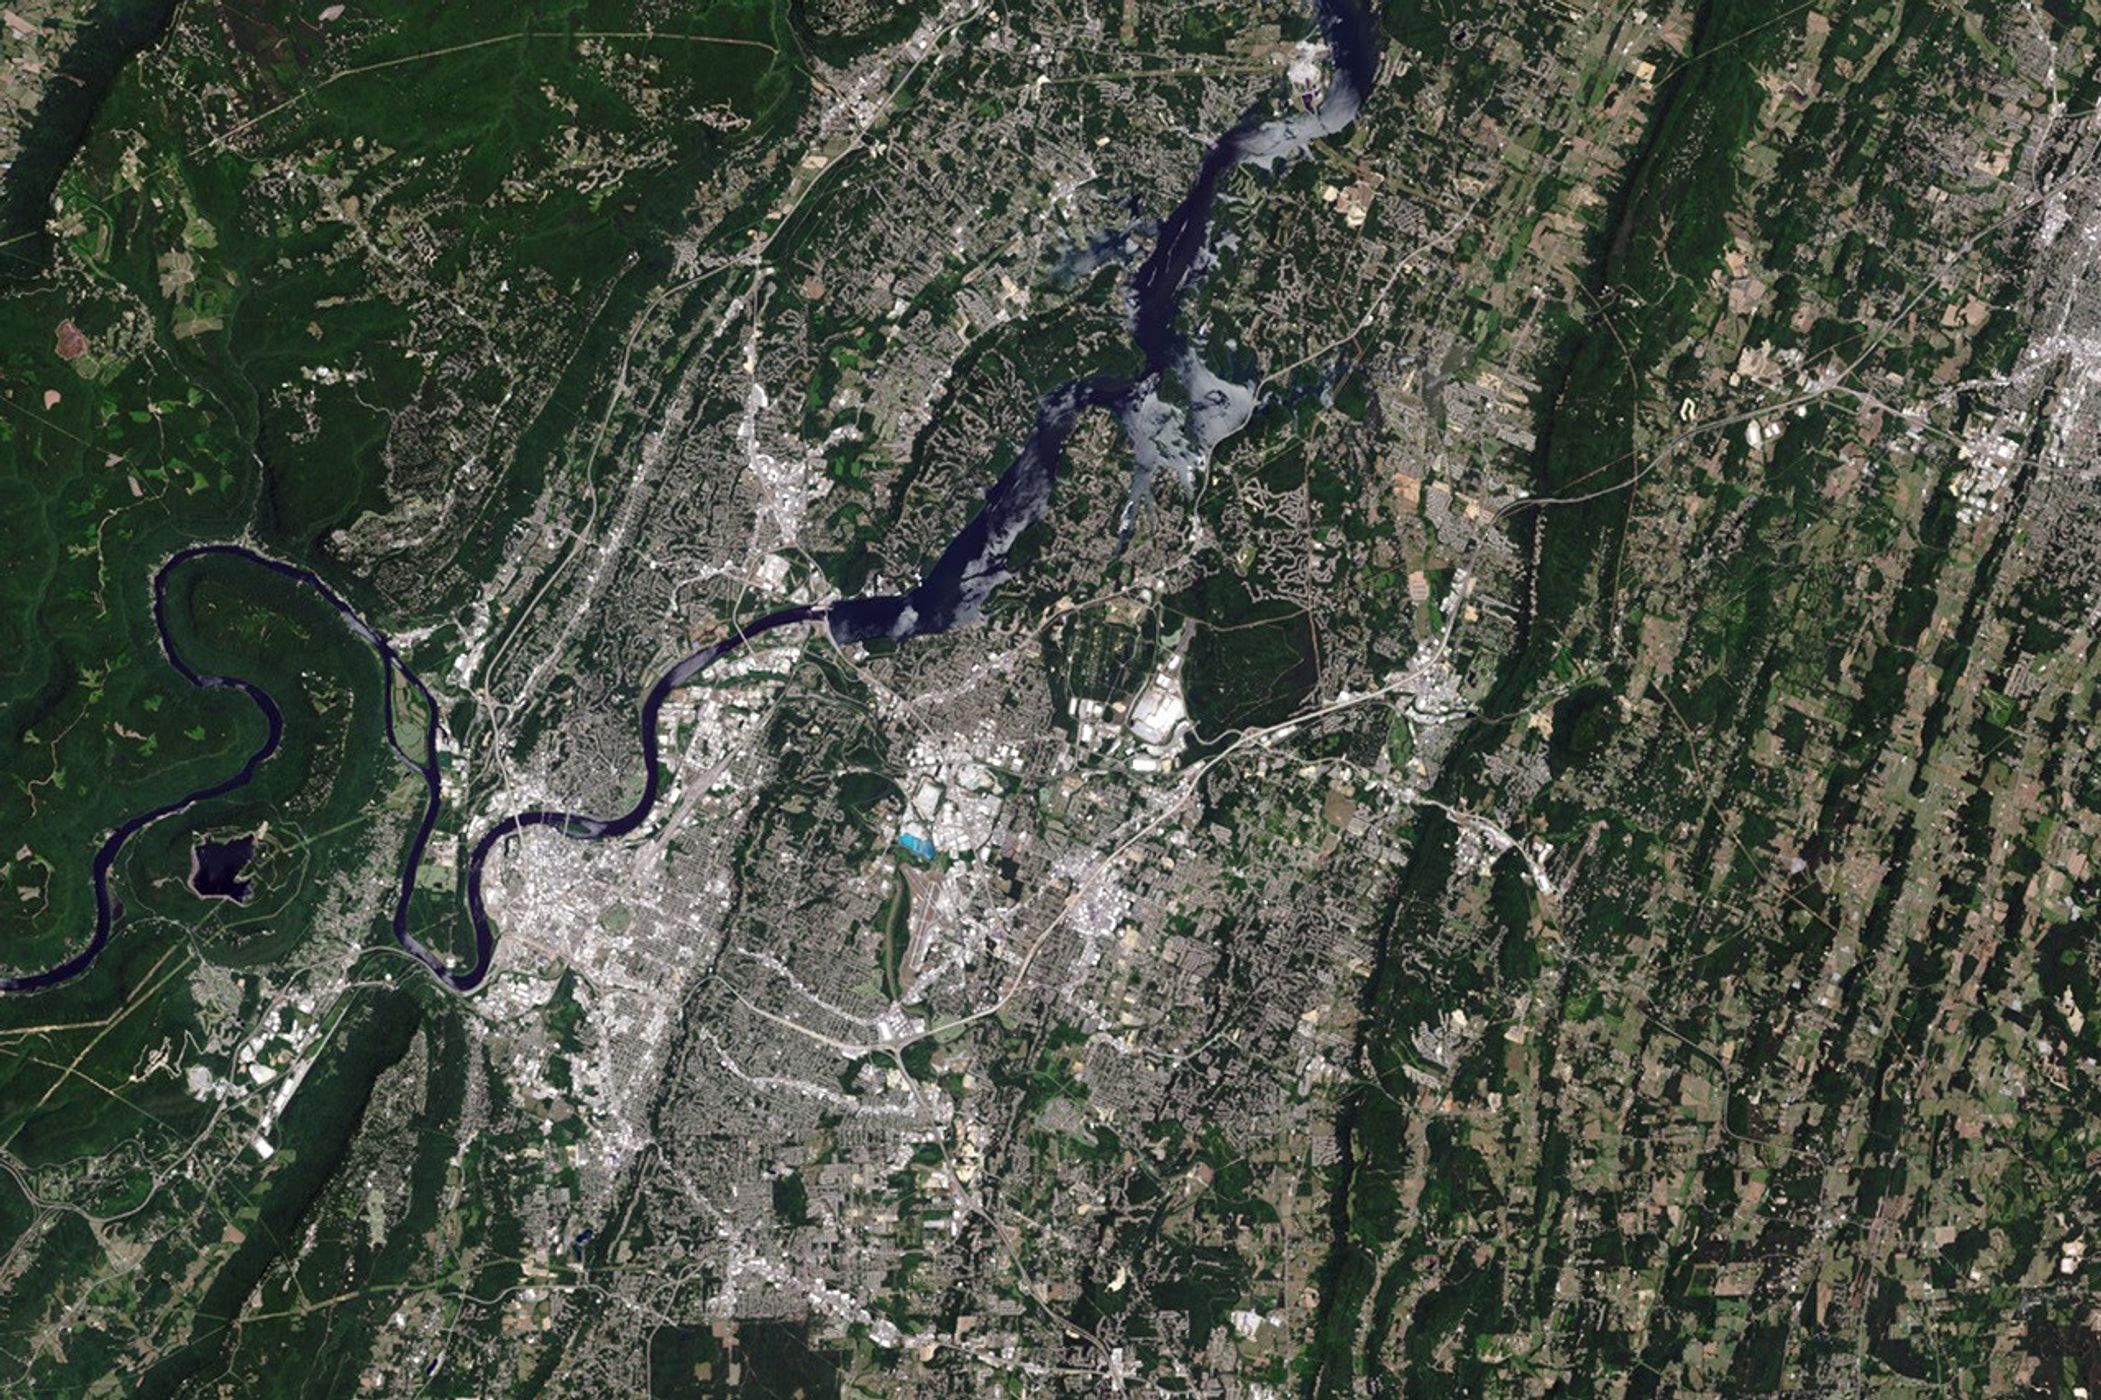
Nestled along the meandering Tennessee River and between the foothills of the Appalachian Mountains and Cumberland Plateau, the Tennessee city prides itself on its scenic surroundings. Signs of development increasingly cover the area, as seen in this pair of images captured decades apart by Landsat satellites. The ETM+ (Enhanced Thematic Mapper Plus) on Landsat 7 acquired the image on the left on June 18, 2001; the OLI (Operational Land Imager) on Landsat 8 captured the image on the right on June 25, 2024.
The most visible changes include the construction of a large auto manufacturing plant and several residential neighborhoods in the city’s northeastern outskirts. There are also several new shopping complexes along Interstate 75 and more industrial facilities and residential neighborhoods southeast of the city around Lookout Valley. Across the state border in Georgia, extensive development is also visible along Route 2. New development often occurs along major roads and is mostly constrained to areas east of the Tennessee River and Chickamauga Reservoir due to the mountainous terrain to the west.
Much of the recent development is fueled by growth in Chattanooga’s manufacturing sector, which has rebounded over the past 15 years after suffering a period of decline between the early 1990s and 2010. Employment in durable goods manufacturing has been particularly strong, nearly doubling from 12,800 jobs in 2010 to 25,100 jobs in 2023, according to a 2024 report from the University of Tennessee at Chattanooga.
Azad Hossain, an environmental geoscientist at the University of Tennessee at Chattanooga, has been using Landsat observations to study changes in Chattanooga for decades. “Even in a mid-sized city like ours, urbanization comes with impacts on the environment,” he said, “including challenges with water quality, urban heat islands, urban forests, and air pollution.”
One recent University of Tennessee at Chattanooga project found that Chattanooga’s impervious surfaces more than doubled between 1984 and 2021, increasing by 33 square miles (85 square kilometers), while the city’s urban forests lost more than 37 square miles. Impervious surfaces are hard, non-porous surfaces that prevent water from soaking into the ground, leading to increased stormwater runoff and sometimes contributing to problems with flooding and water quality.
In a previous project, researchers used nearly four decades of Landsat observations to calculate that development added 4 square miles of impervious surfaces within 300 feet of streams, information that Hossain shared with urban planners, hydrologists, and city leaders in Chattanooga. Hossain and colleagues are also working on an ongoing project to compare Landsat observations of the Tennessee River and Chickamauga Lake with on-the-ground measurements of turbidity and chlorophyll as part of an effort to develop better ways of assessing seasonal variations and trends in river water quality based on satellite data. Note that the differences in the color of the water in the images shown above relate to sunglint and lighting conditions, not water quality.
“I actually get emotional when I talk to people about the deep historical record and perspective that Landsat makes possible,” Hossain said. Higher resolution data are available from commercial satellites, but Landsat allows people to look back decades to understand the broad scope of changes, he added. “I hope that other cities—both large and small—learn everything they can from Landsat’s long data record.”
References & Resources
- ArcGIS StoryMaps (2024, July 23) A City of Trees. Accessed April 7, 2025.
- Chattanooga Times Free Press (2024, May 19) Following a trend in recent years, the Chattanooga area saw steady population growth in 2023. Accessed April 7, 2025.
- Chattanooga Times Free Press (2024, March 18) Chattanooga’s growth lags behind most of the state’s large urban areas. Accessed April 7, 2025.
- University of Tennessee at Chattanooga (2024, March 25) The Manufacturing-Led Resurgence of the Chattanooga Economy. Accessed April 7, 2025.
- Hall, J. & Hossain, A. (2020) Mapping urbanization and evaluating its possible impacts on stream water quality in Chattanooga, Tennessee, using GIS and remote sensing. Sustainability, 12(5), 1980.
- Hossain, A., et al. (2021) Remote sensing of turbidity in the Tennessee River using Landsat 8 satellite. Remote Sensing, 13(18), 3785.
- Hossain, A. et al. (2022) Investigating urban heat island impact for the city of Chattanooga, Tennessee, using GIS and remote sensing. Handbook of Climate Change Mitigation and Adaptation, 2695-2729.
- Hossain, A. et al. (2024) Spatiotemporal Analysis of Urban Forest in Chattanooga, Tennessee from 1984 to 2021 Using Landsat Satellite Imagery. Remote Sensing, 16(13), 2419.
- Mix, C., et al. (2024) A spatial analysis of urban tree canopy using high-resolution land cover data for Chattanooga, Tennessee. Applied Sciences, 14(11), 4861.
- NOOGA Today (2024, February 22) Leading industries and employers in the Chattanooga metro area. Accessed April 7, 2025.
- University of Tennessee at Chattanooga (2024, May 14) Coming up ROSES: UTC scientists land NASA research award. Accessed April 7, 2025.
- University of Tennessee at Chattanooga (2024, March) Chattanooga Metro Employment, 1990-2023. Accessed April 7, 2025.
- U.S. Census Bureau (2024, May 16) Population rebounds for many cities in Northeast and Midwest. Accessed April 7, 2025.
- U.S. Census Bureau (2025, March 13) Growth in metro areas outpaced nation. Accessed April 7, 2025.
- WDEF News 12 (2024) UTC lands NASA grant to study Tennessee River water quality. Accessed April 7, 2025.
NASA Earth Observatory images by Wanmei Liang , using Landsat data from the U.S. Geological Survey . Story by Adam Voiland .