![Request for Information – Potential [Placeholder for Prize]](https://assets.science.nasa.gov/dynamicimage/assets/science/missions/a-step/FFR_Earth_Background_20251120%20.png?w=1024)


Tropical forests span 1.6 billion hectares (6.2 million square miles) of Earth. These ecosystems support a majority of the planet’s animal and plant species and contain plants that contribute to over a quarter of modern medicine. But over the past two decades, an average of 10 million hectares (nearly 40,000 square miles) of these forests—roughly the size of Kentucky—have been lost each year, according to the United Nations Environment Programme, affecting the ecosystems and communities that depend on them.
NASA scientists recently developed a new method for tracking tropical forest loss that delivers deforestation alerts more than three months faster than current methods. Although the technique was designed for the Amazon rainforest, data from a recently launched satellite are expected to expand its application globally.
Limits of Traditional Satellite Observations
Because tropical forests are so vast, local communities, conservationists, and policymakers rely on satellite data to manage them. Images acquired by satellites with optical sensors provide highly accurate alerts. For instance, the image above, acquired as part of the Harmonized Landsat and Sentinel-2 (HLS) project, shows newly cleared land in southwest Brazil in July 2020. Images from NASA-USGS Landsat satellites have revolutionized land management for over 50 years. In 1988, Brazil developed one of its first satellite-based monitoring systems using Landsat data, which remains in use today.
Though Landsat is an invaluable tool for Earth observation, it has a critical limitation: clouds. As an optical satellite, it relies on reflected light and cannot observe the ground through cloud cover. This creates data gaps that are especially limiting in tropical regions, which are cloudy most of the year. In some areas, months can pass without acquiring a cloud-free image, hindering efforts to track and curb unregulated forest clearing.
A Breakthrough Using Radar
To address Landsat’s cloud challenge, researchers at NASA’s Marshall Space Flight Center tuned into a different wavelength. Led by Africa Flores-Anderson, associate program manager for NASA’s Ecosystem Conservation Program, the team piloted a system for the Amazon that combines existing satellite-based approaches with cutting-edge radar data. The approach builds upon a platform developed by the Cardille Lab at McGill University.
Synthetic aperture radar (SAR) doesn’t require daylight or clear skies. To generate an image, SAR instruments beam radar signals at a surface and measure the signals that bounce back. SAR satellites use various ranges of radar wavelengths, or “bands,” to measure features on Earth’s surface. Over forests, the shorter wavelengths of the C-band scatter off treetops, but the longer wavelengths of the L-band can make it down to the ground.
This L-band is central to Flores-Anderson’s approach. Similar efforts favored C-band because it was more readily available than other SAR data. But when felled trees—along with their branches and leaves—are not removed right away, C-band’s shorter wavelengths are scattered by remaining debris, obscuring evidence of destruction. In contrast, L-band’s longer wavelengths can penetrate this material and reveal the damage. The new method is the first of its kind to automatically combine the user-friendly, intuitive images from Landsat and the consistent, detailed insights from L-band SAR data.
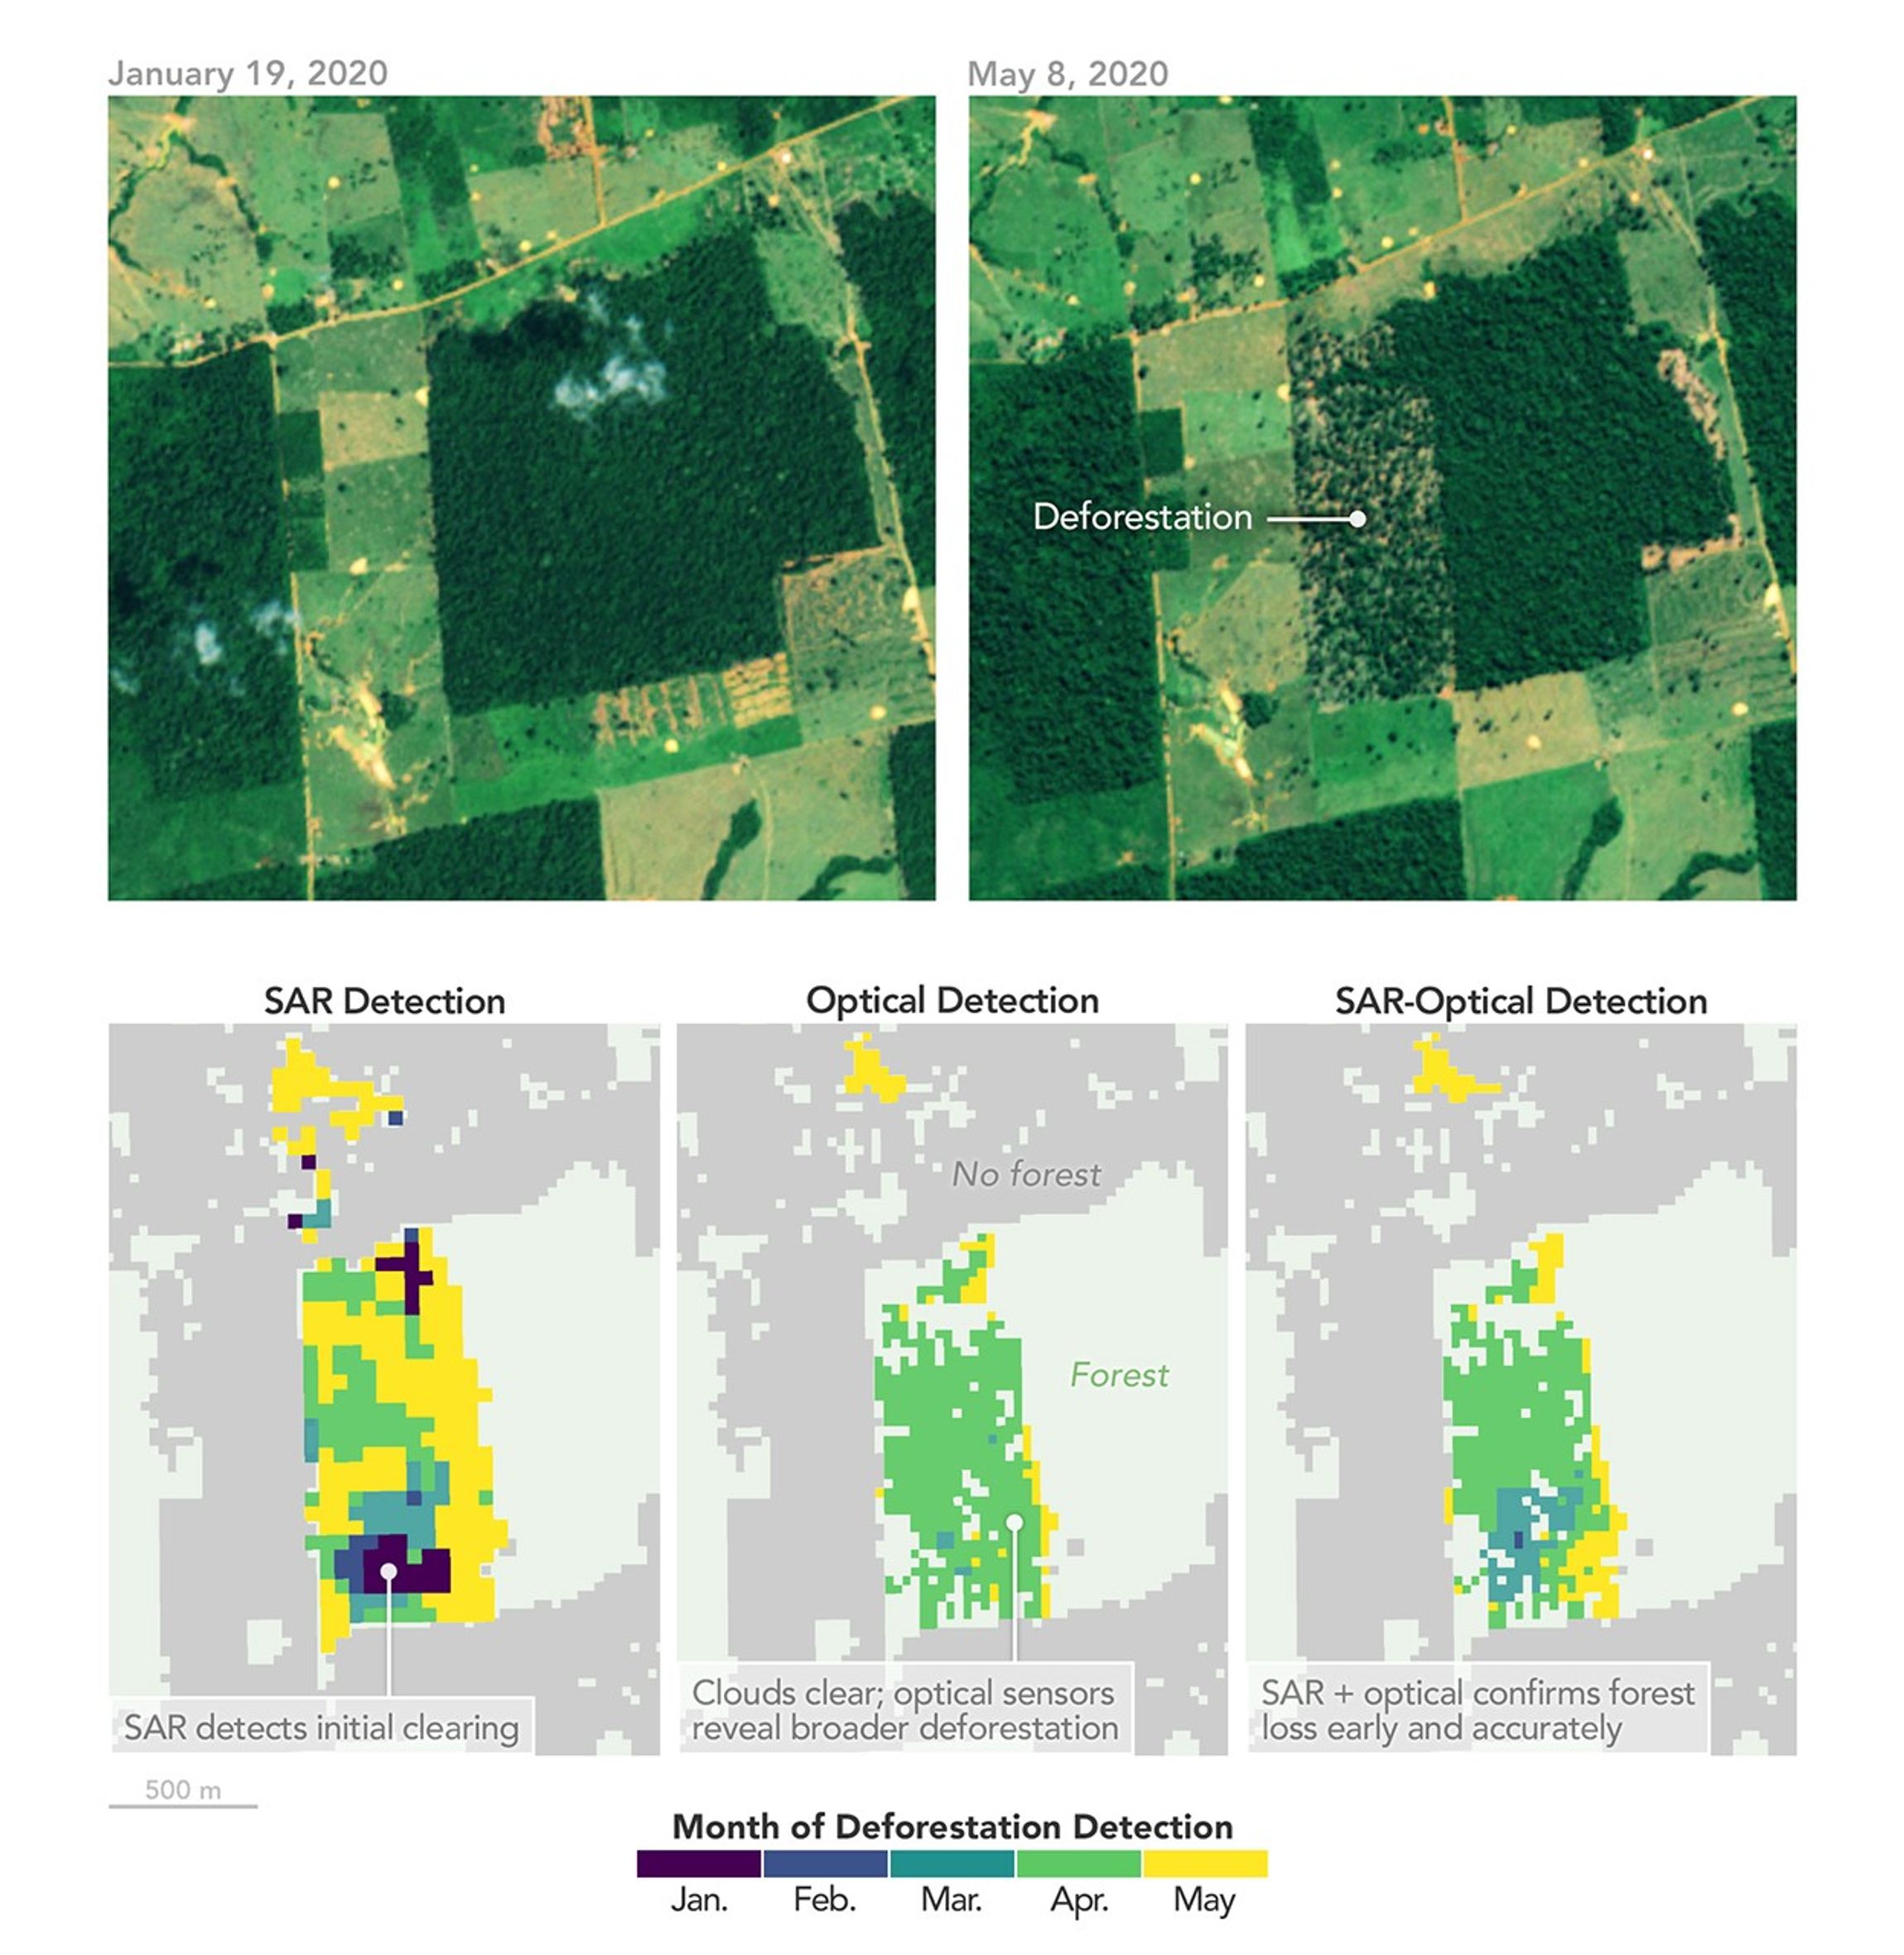
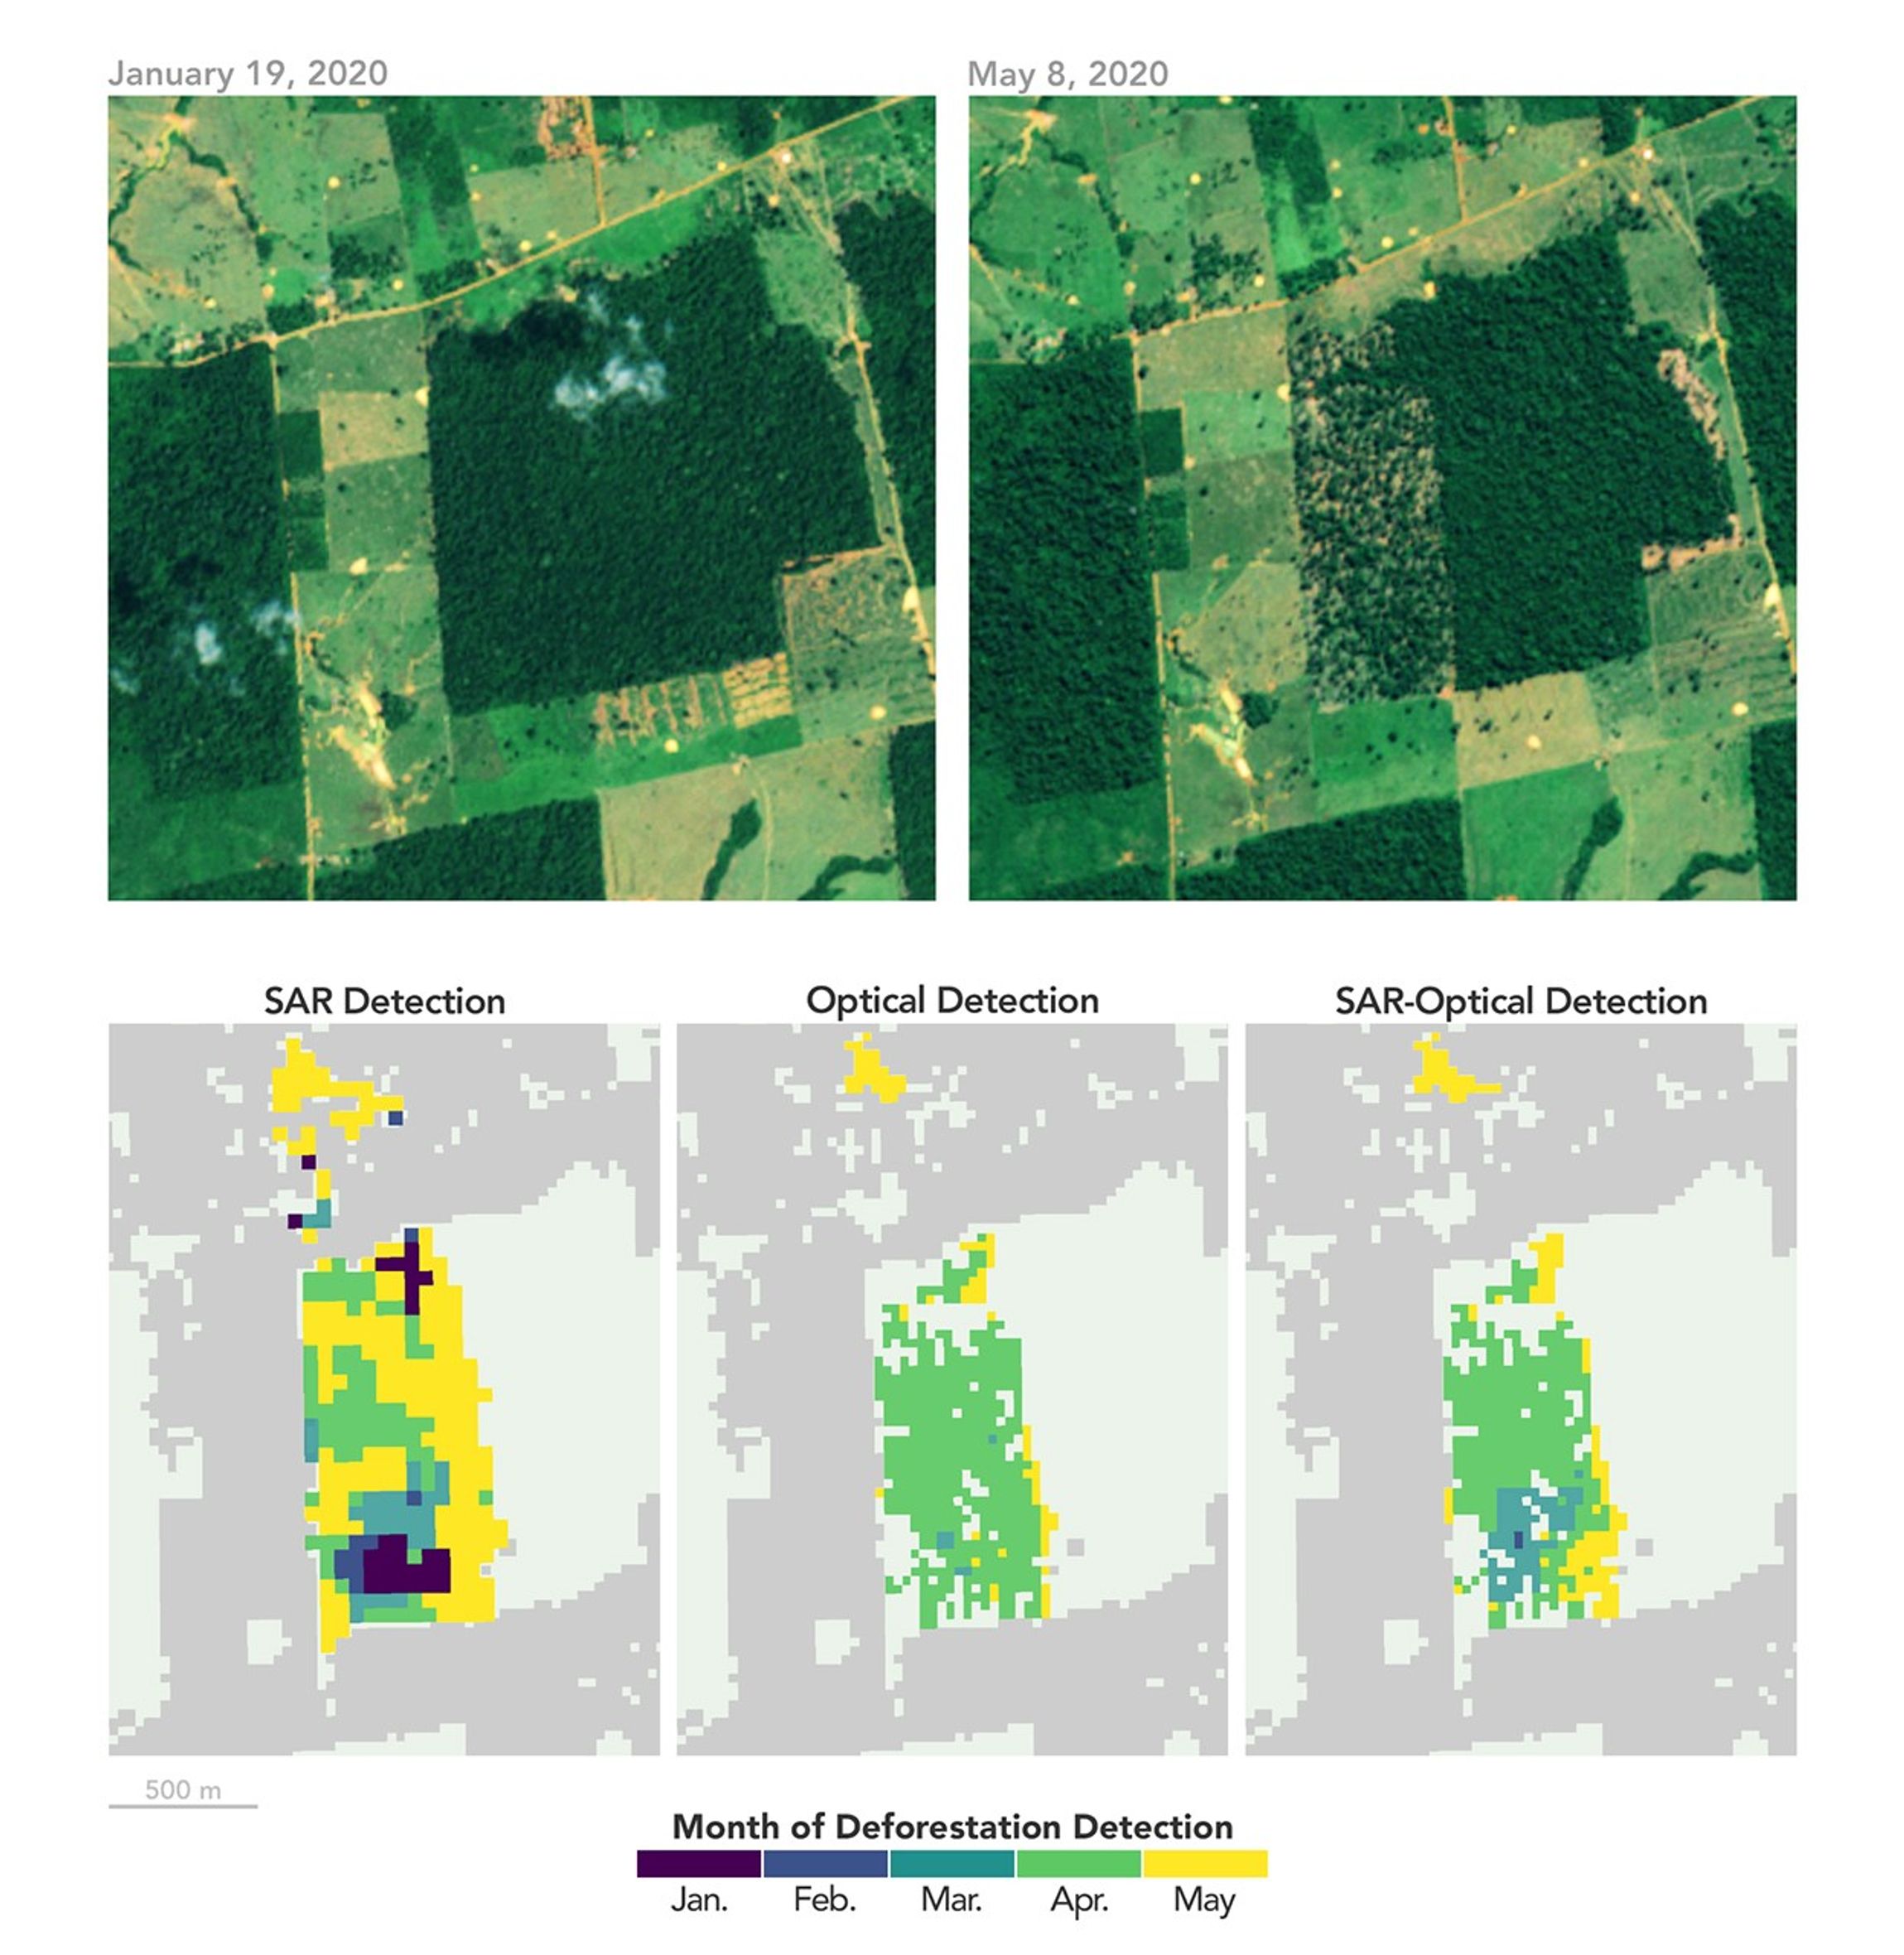
These visuals show the benefit of combining optical images and L-band SAR data. The patch of deforested land in southwest Brazil (top row) is overlaid with colors that represent the month that deforestation was detected (bottom row).
The left map shows that SAR detected two patches of forest loss in January (purple), three months earlier than optical sensors (middle map). The patches appear small because deforestation happens gradually, Flores-Anderson explained. At that point in January, only those areas had been cleared.
By April (green), optical sensors had detected forest loss across a wider area, shown in the middle map. These sensors collect images every few days, while the SAR data used in this study captured the area only once or twice a month. In this case, the optical satellites observed the change during a break in the cloud cover.
The map on the right shows how the new algorithm combines information from both types of observations. To increase accuracy, this algorithm confirms deforestation only if there are multiple, consecutive observations of forest loss. This view confirms deforestation as early as February, up to two months earlier than optical-only, and with much more certainty than the optical- or SAR-only approaches.
Faster Detection and a Global Future
On average, the new method for monitoring forests spots felled trees within 16 days with exceptional accuracy, nearly eliminating false alarms. These detections can identify deforestation in very cloudy regions up to 100 days sooner than optical-only systems.
“In the tropics, it’s important to detect deforestation as soon as it occurs,” Flores-Anderson said. “If an image of a cleared forest isn’t available until the following year, the area may already be regrown, and deforestation will be missing from our data.”
For experts like Sylvia Wilson, the chief forest and climate scientist at Wilpa Capacity Development with nearly 20 years of global forest monitoring experience with the U.S. Geological Survey, adding L-band SAR to optical is a scientific game changer. “L-band SAR gives us the opportunity to see what optical doesn’t,” Wilson said. “But it’s not one sensor versus the other; the future is SAR plus optical."
The NISAR (NASA-ISRO Synthetic Aperture Radar) satellite, launched in July 2025, will drastically increase the feasibility of systems like Flores-Anderson’s by providing more frequent and comprehensive L-band SAR data. L-band data has been relatively scarce, with limited images only available in a few areas like the Brazilian Amazon. Once more NISAR data become publicly available, they will provide free, global L-band SAR every 12 days. Flores-Anderson’s system is already prepared to incorporate this data.
“It doesn’t matter which sensor we get data from—whether it’s optical or SAR—it automatically adds to our model,” Flores-Anderson explained. “As more NISAR data become available, we will have more accurate, faster detection of change.”
NASA Earth Observatory images by Michala Garrison, using MODIS data from NASA EOSDIS LANCE and GIBS/Worldview, the Harmonized Landsat and Sentinel-2 (HLS) product, and model data provided by Flores-Anderson et al. Story by Lena Pransky (EarthRISE) with Jake Ramthun (EarthRISE) and Madeleine Gregory (Landsat Project Science Support).

References & Resources
- Cardille, J. A. et al. (2022) Multi-sensor change detection for within-year capture and labelling of forest disturbance. Remote Sensing of Environment, 268 (112741).
- Flores-Anderson, A.I. et al. (2026) On the sensitivity of SAR C- and L-band dual-polarized data for detection of early deforestation in the tropics. Remote Sensing of Environment, 333 (115133).
- Flores-Anderson, A.I. et al. (2025) Early Deforestation Detection in the Tropics using L-band SAR and Optical multi-sensor data and Bayesian Statistics. International Journal of Applied Earth Observation and Geoinformation, 143 (104831).
- INFOAMAZONIA (2022, February 15) Prodes and Deter: get to know these strategic systems in the fight against deforestation in the Amazon. Accessed April 2, 2026.
- NASA (2025, July 25) Get to Know SAR – Overview. Accessed April 2, 2026.
- Pelletier, F. et al. (2024) Inter- and intra-year forest change detection and monitoring of aboveground biomass dynamics using Sentinel-2 and Landsat. Remote Sensing of Environment, 301 (113931).
- Springer Nature (2023, August 24) Behind the Paper. Accessed April 2, 2026.
- United Nations Climate Action (2025) Forests - nature’s solution to carbon pollution. Accessed April 2, 2026.
- United Nations Environment Programme (2025, October) High-risk Forests, High-value Returns and the State of Finance for Forests: Key Messages. Accessed April 2, 2026.
- National Park Service (2019, March 8) Wildlife of the Tropical Rainforests. Accessed April 2, 2026.
- United Nations Foundation (2023, January 4) Biodiversity Explained: Facts, Myths, and the Race to Protect It. Accessed April 2, 2026.