


Microshutters
What Webb’s Microshutters Do
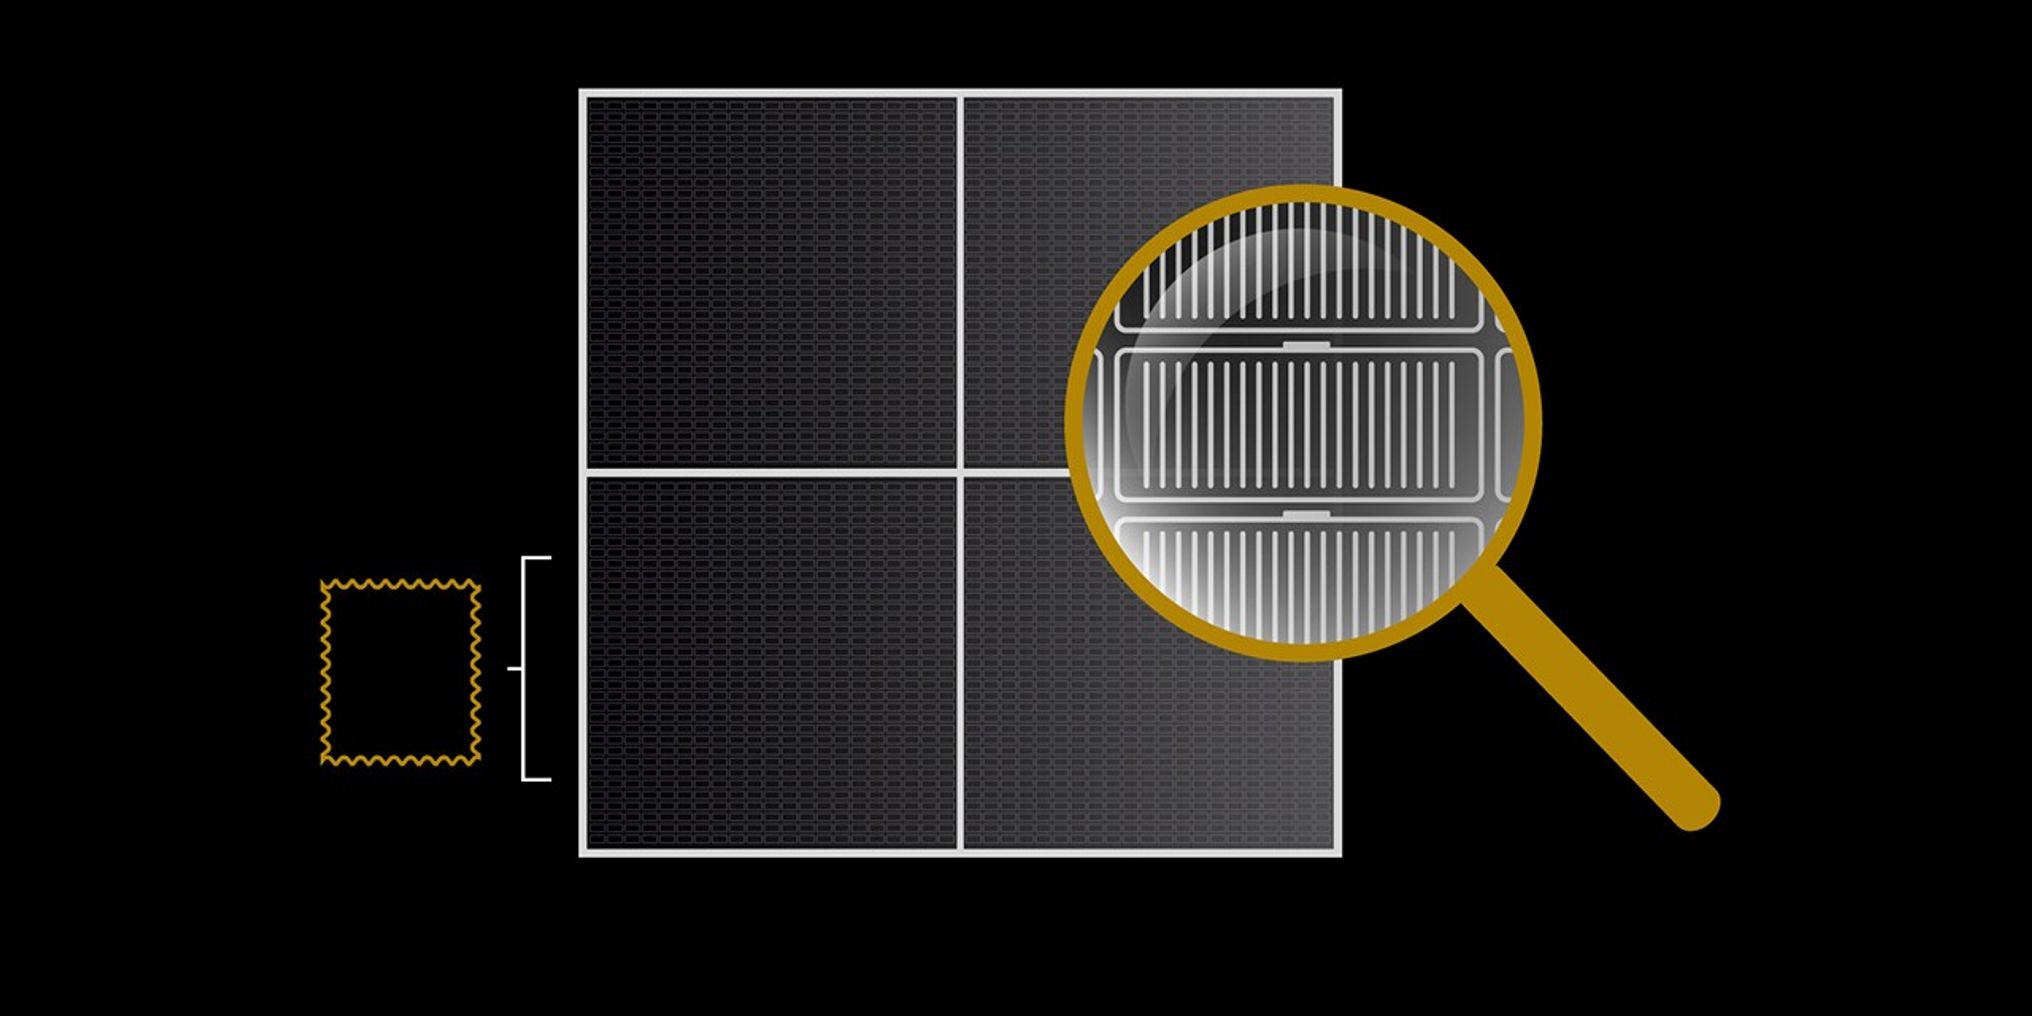
The James Webb Space Telescope's microshutter array is a grid of 248,000 tiny doors that can be individually opened and closed to transmit or block light to capture spectra (think data!) of hundreds of individual objects in a field of stars or galaxies simultaneously. It delivers extremely detailed data about each object it observes, multiplying the science researchers can produce. The microshutter array is housed within Webb’s Near-Infrared Spectrograph (NIRSpec), a multifaceted scientific instrument that was developed by the European Space Agency (ESA). This technology was developed specifically for Webb: This is the first time an instrument like this has flown in space! How does the instrument work? What does it do? Here, we walk you through it step by step.
So Many, So Small
How It Works

Splitting Light
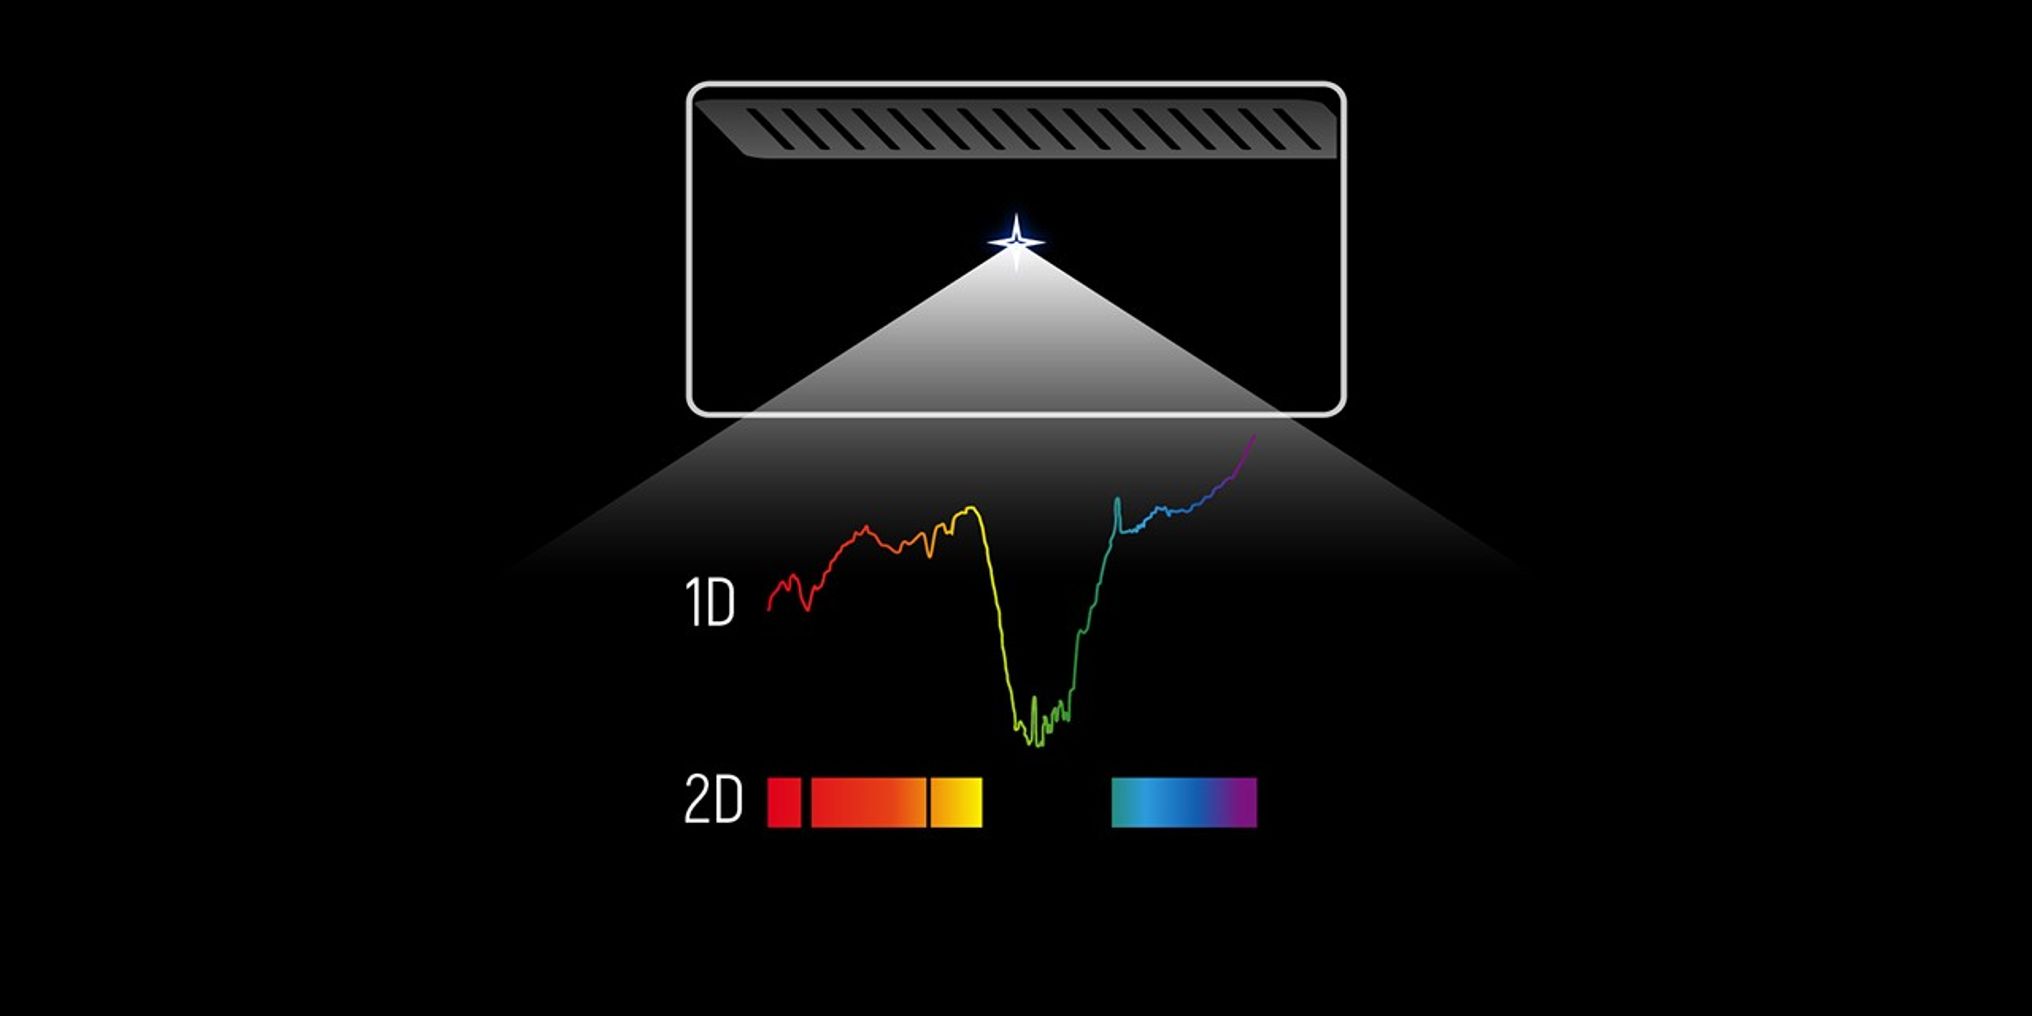
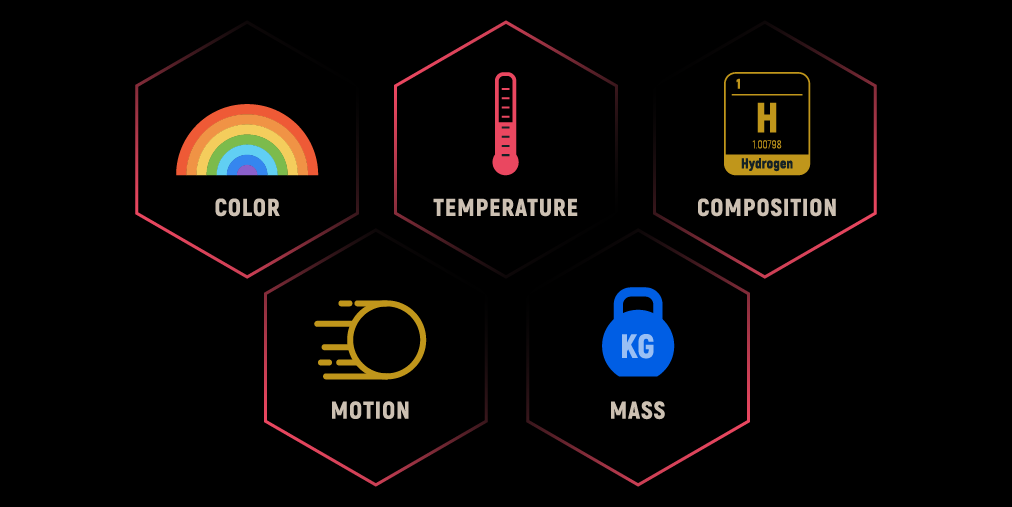
What We Learn from Spectra
Dig deeper
- Download the complete infographic.
- Read about the microshutters in more detail.
- Take a visual tour of NIRSpec’s capabilities.
- Learn about all four of Webb’s scientific instruments.
In-Depth Example: Galaxies
What We Learn by Looking at Galaxies’ Light
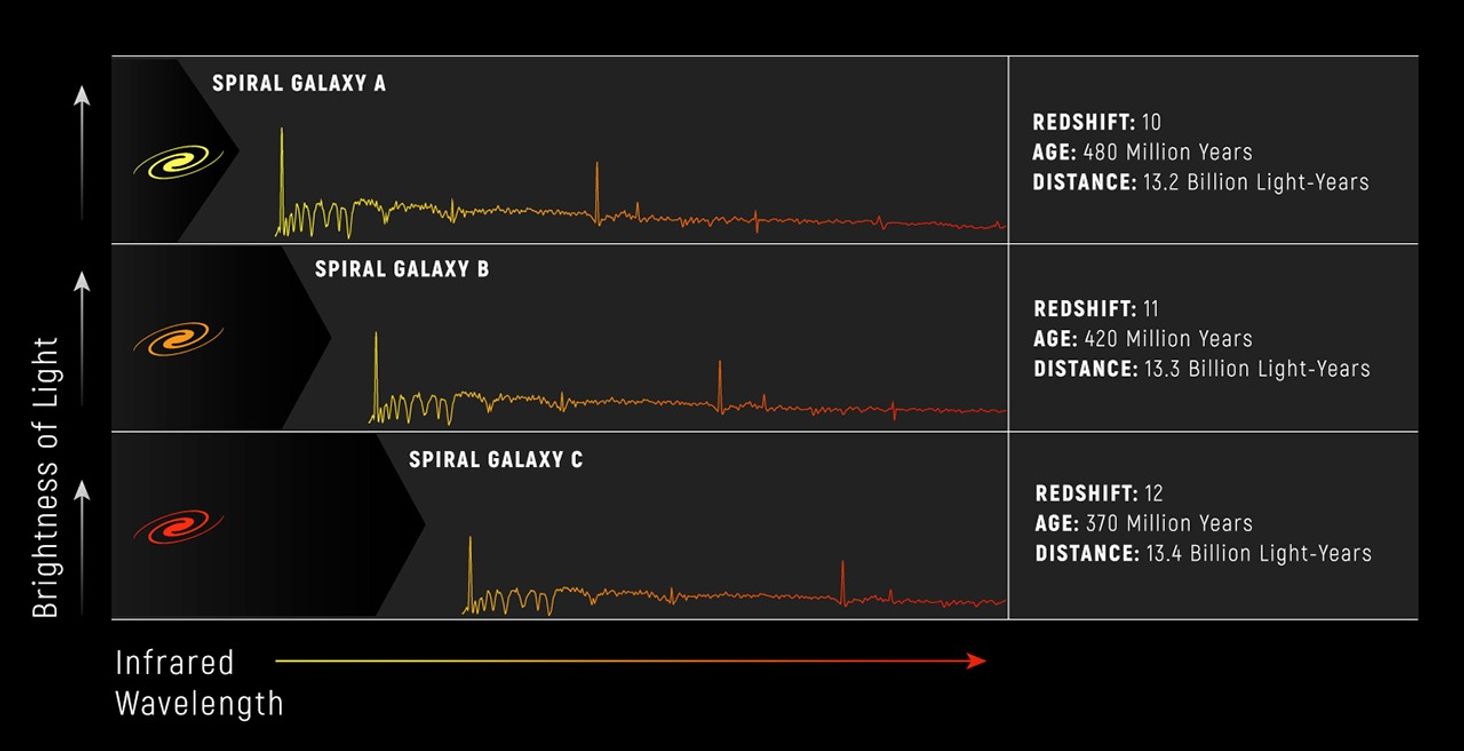
Spectra tell us an immense amount about galaxies, including very distant galaxies as they existed in the early universe. In the graphs below, we’ve plotted the light gathered from three spiral galaxies. The large black arrows at the left of each spectrum emphasize how far the light from each galaxy has redshifted, or stretched into longer, redder wavelengths due to the expansion of the universe, before reaching the telescope.
The first sample spiral galaxy at the top is the closest to Earth. Its light existed a mere 480 million years after the big bang, which happened more than 13.8 billion years ago. The light observed in the second shows it as it existed only 420 million years after the big bang. The third is the most distant. Its light reflects this spiral galaxy as it existed only 370 million years after the big bang. Although the light from each galaxy was redshifted, we still observe the galaxies as they were when that light was emitted—when the galaxies were young. By comparing galaxies that existed at various times in the universe we can understand how they change over time.
Webb’s microshutter array is not only designed to capture these longer wavelengths of light, known as infrared, but will also be able to accurately sample the light from each galaxy simultaneously to help researchers identify their type (spiral, elliptical, or irregular), their distances from Earth, their ages, and their redshifts.
Dig deeper
- Download the graphic showing the galaxies’ spectra above.
The Full Field of Galaxies
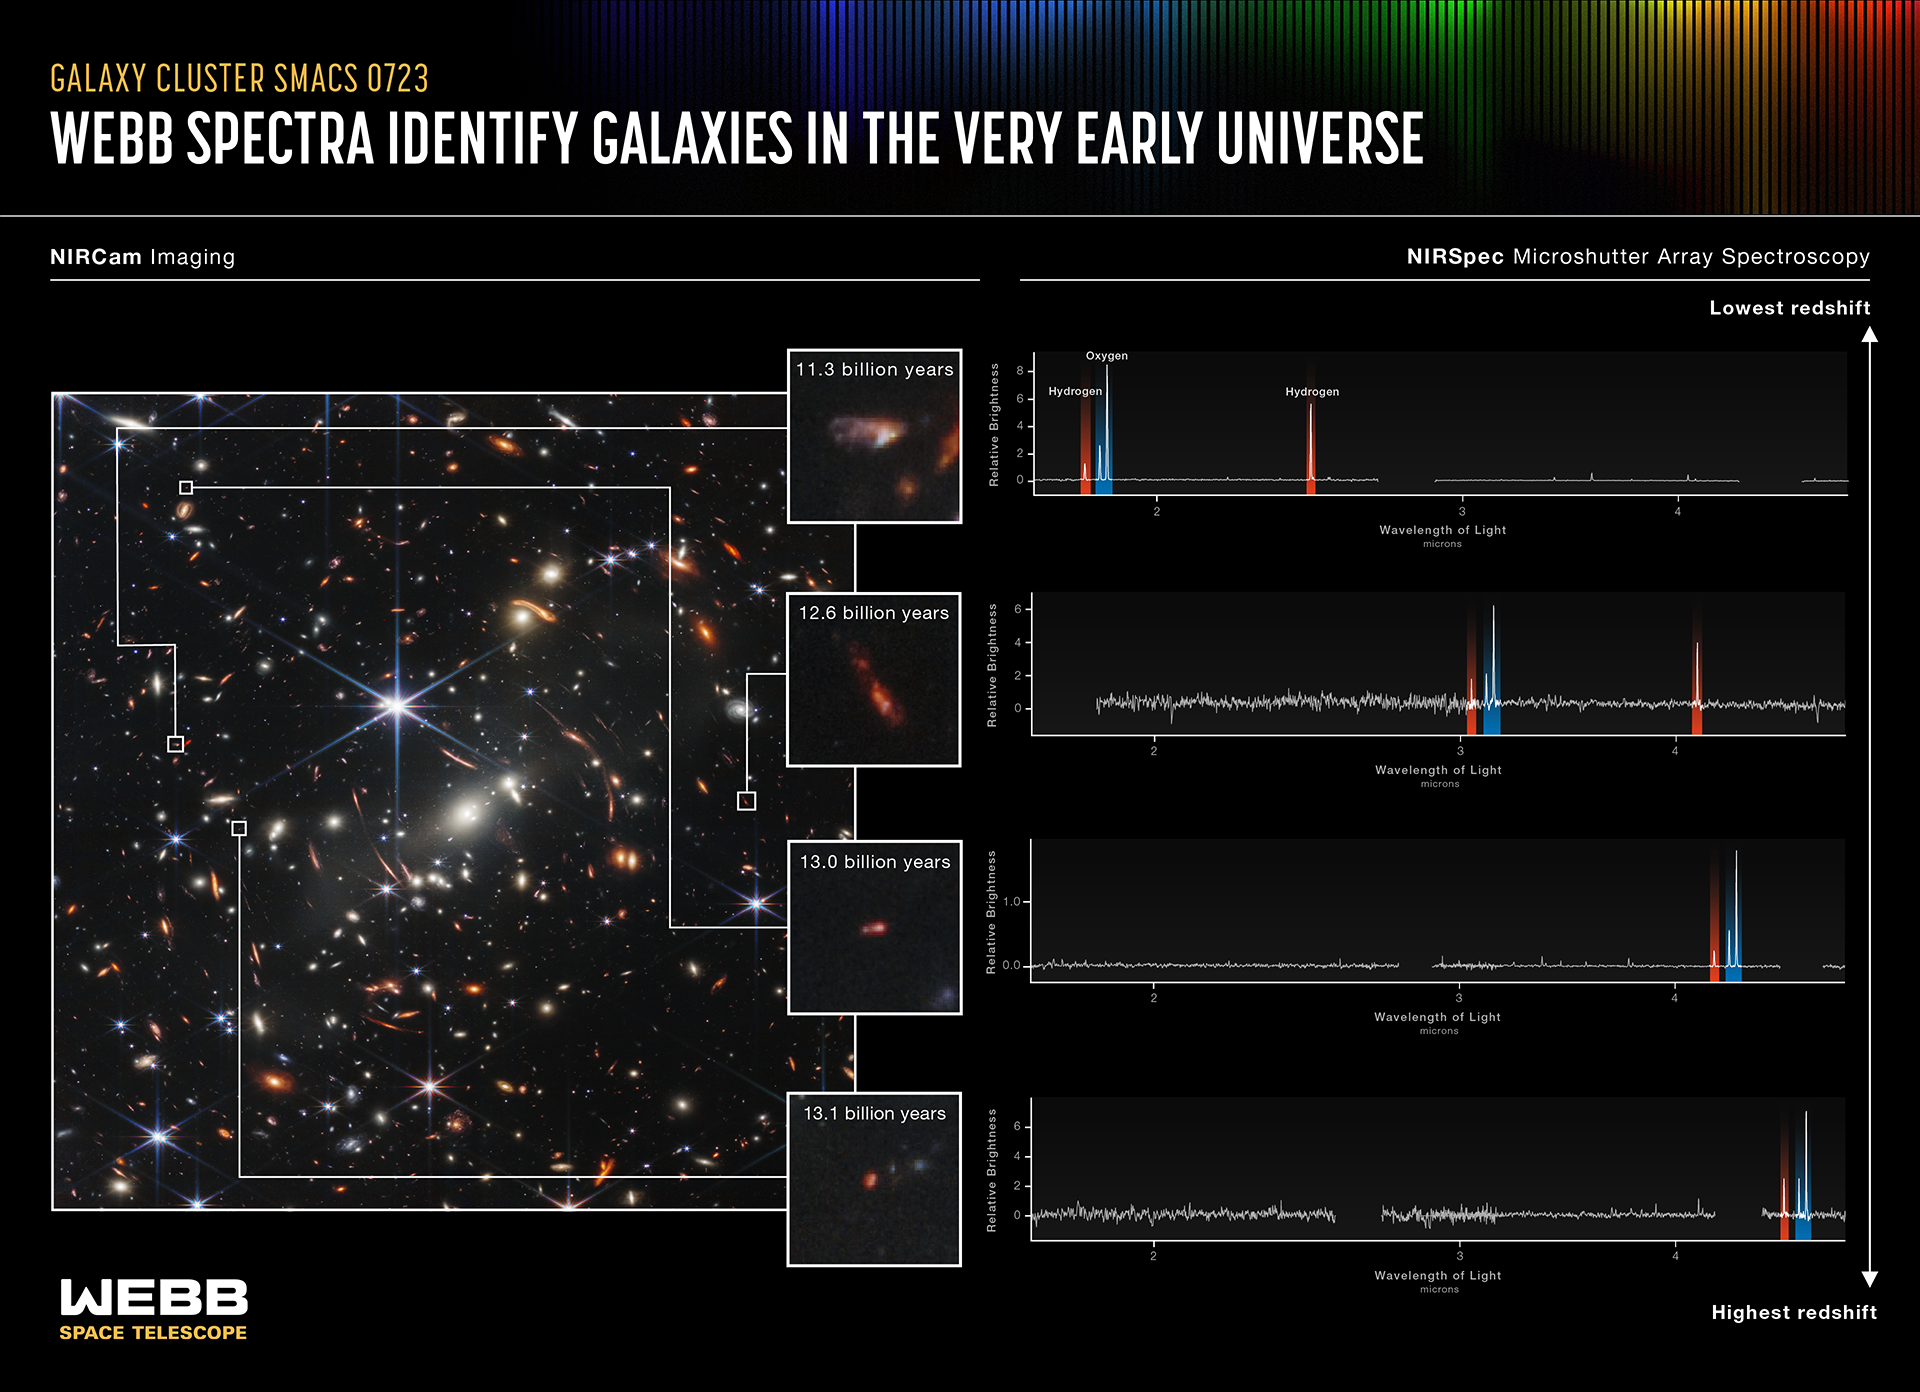
In the image below, Webb's full image of galaxy cluster SMACS 0723 is at left. Webb’s image is approximately the size of a grain of sand held at arm’s length, a tiny sliver of our vast universe. The smallest, reddest smudges are the most distant galaxies, but there are galaxies of all types and shapes, including spiral, elliptical, and irregular galaxies. By using Webb’s microshutter array, researchers can learn more about the masses, ages, histories, and compositions of galaxies in this field.
Of the thousands of distant galaxies behind galaxy cluster SMACS 0723, the microshutters were used to observe 48 individually, all at the same time. Quick analysis made it immediately clear that several of these galaxies were observed as they existed at very early periods in the history of the universe. Light from the farthest galaxy shown traveled 13.1 billion years before Webb’s mirrors captured it. With these observations, Webb showed us the chemical composition of galaxies in the very early universe for the first time.
Dig deeper
- Read more about the graphic above.
- Read the release about galaxy cluster SMACS 0723, known as Webb’s First Deep Field.
- Galaxies Over Time
- How Can Webb Study the Early Universe?