


1 min read
HR 8799 Exoplanet System (Hubble)
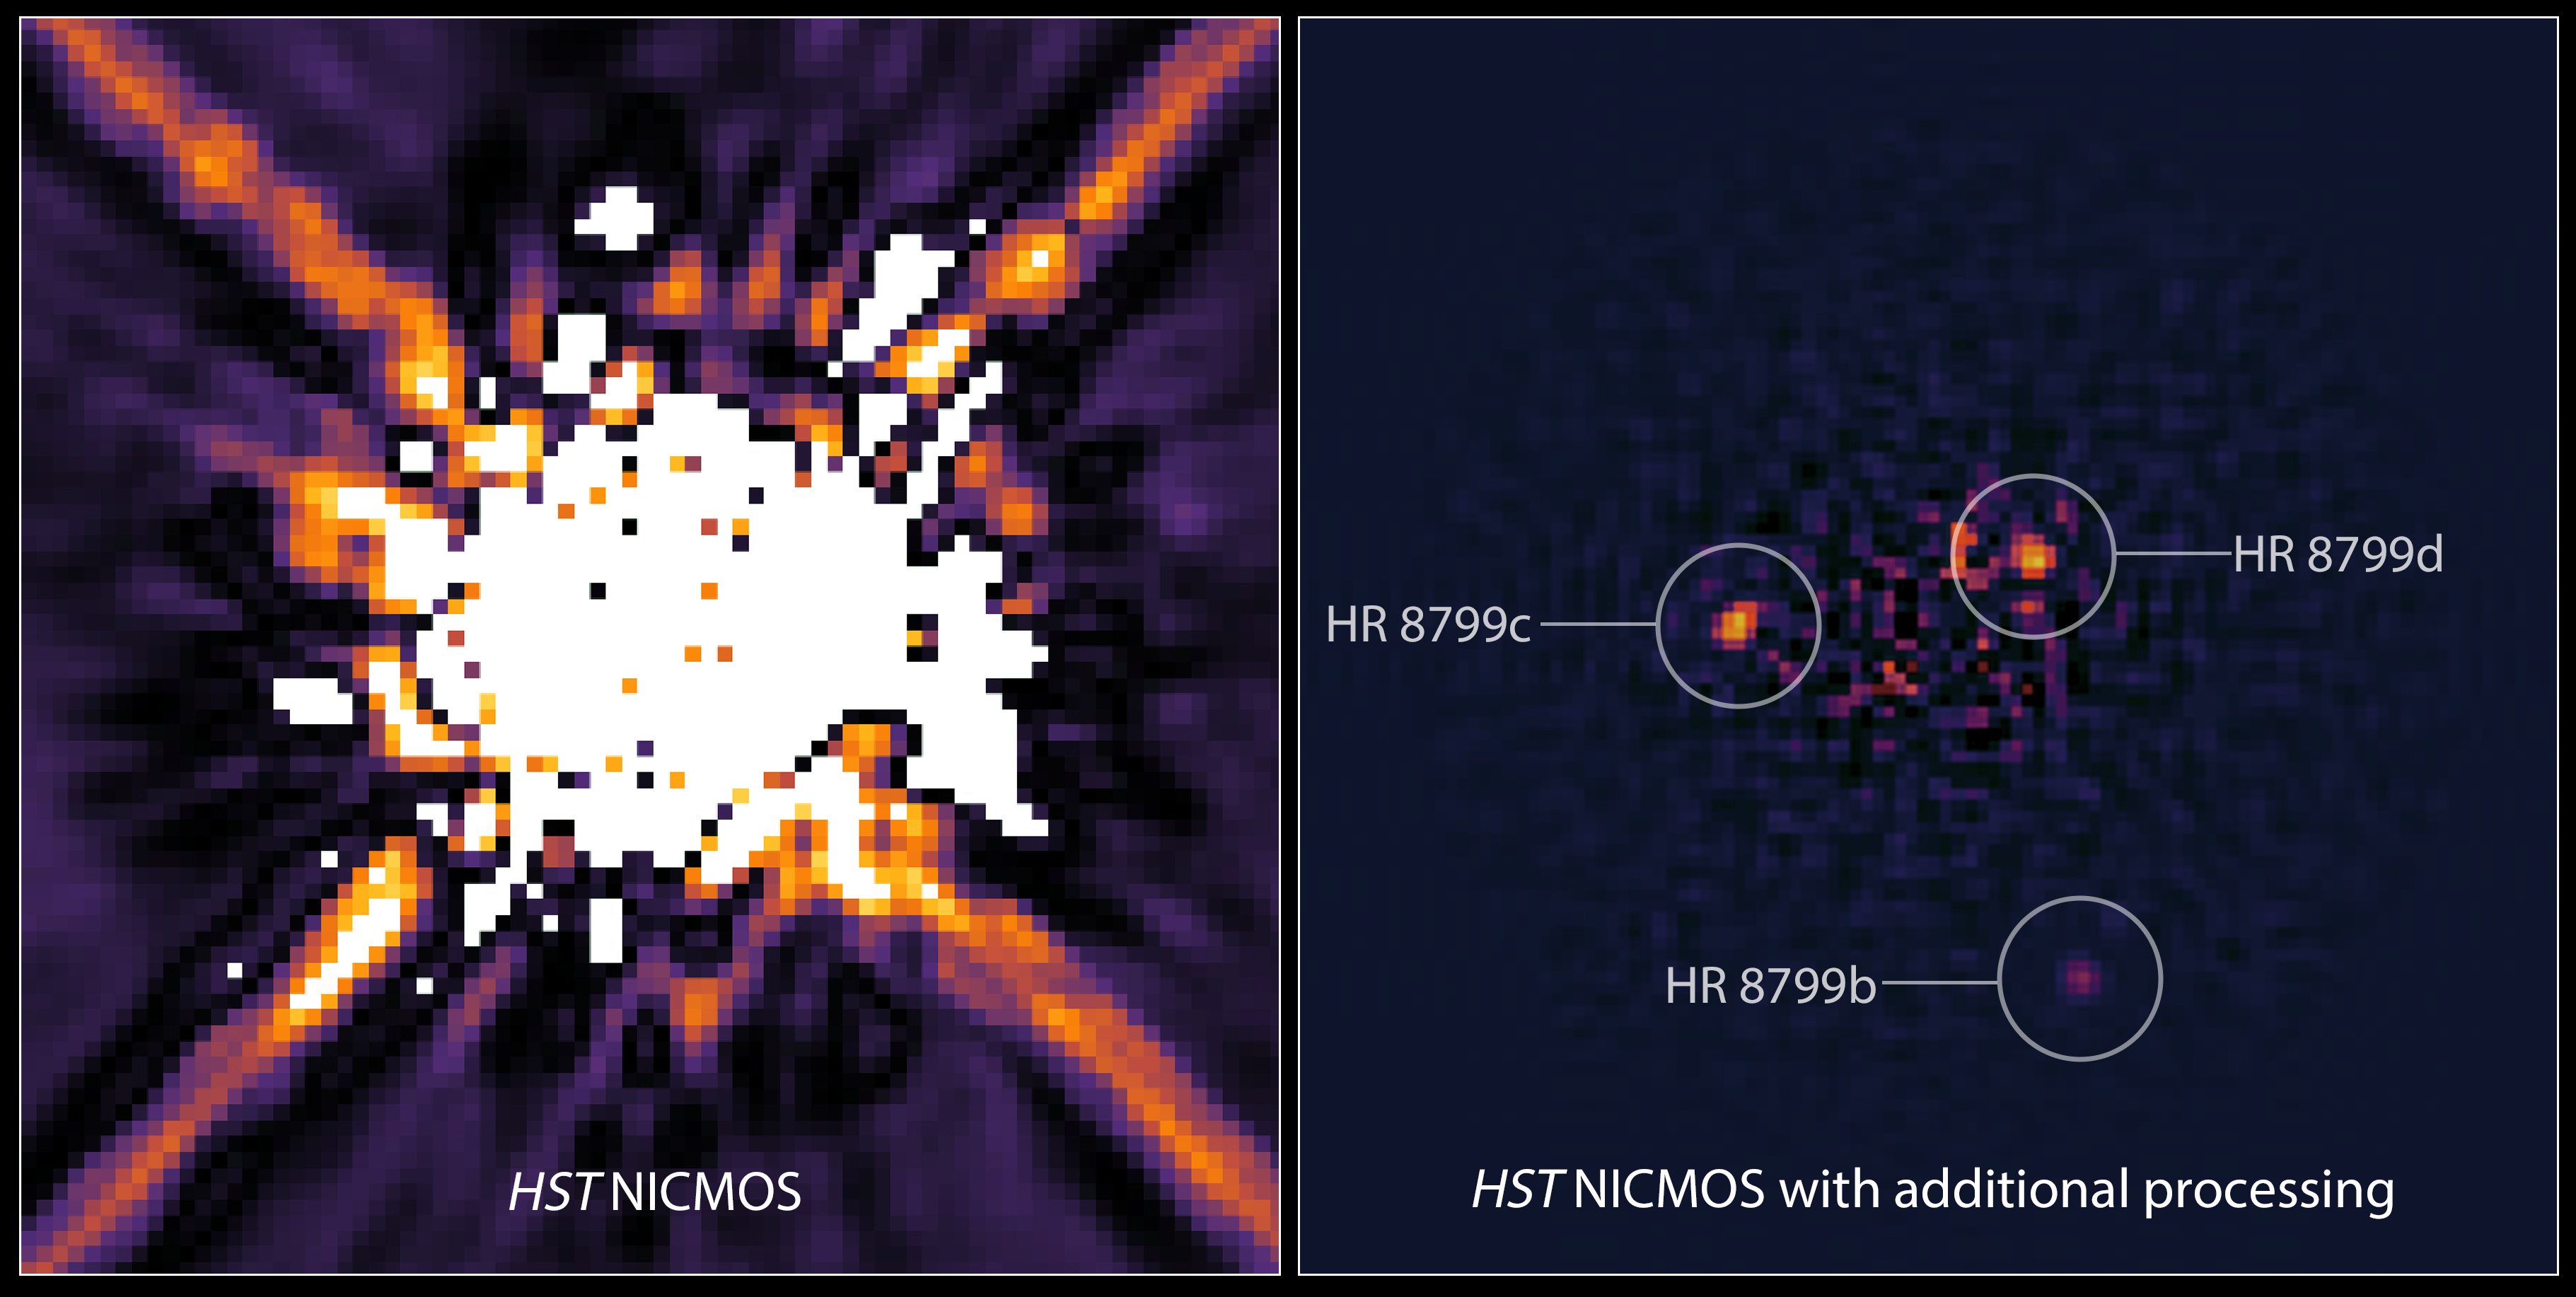
Left: This is an image of the star HR 8799 taken by Hubble's Near Infrared Camera and Multi-Object Spectrometer (NICMOS) in 1998. A mask within the camera (coronagraph) blocks most of the light from the star. Astronomers also used software to digitally subtract more starlight. Nevertheless, scattered light from HR 8799 dominates the image, obscuring the four faint planets. The exoplanets were discovered in 2007, 2008, and 2010 in near-infrared ground-based images taken with the W.M. Keck Observatory in Hawaii and the Gemini North telescope in Chile. The system is 133 light-years from Earth.
Right: A re-analysis of NICMOS data in 2011 uncovered three of the exoplanets, which were not seen in the 1998 images. Sophisticated software processing of the NICMOS data removes most of the scattered starlight to reveal the three planets orbiting HR 8799. Astronomers used this decade-old image to calculate the planets’ orbits. The fourth, innermost planet cannot be seen because it is on the edge of the NICMOS coronagraphic spot that blocks the light from the central star.
Webb will probe the planets’ atmospheres at infrared wavelengths astronomers have rarely used to image distant worlds. Webb will also hunt for other distant worlds — possibly down to Saturn-size — on the outskirts of planetary systems that cannot be detected with ground-based telescopes.
About the Object
- R.A. PositionR.A. PositionRight ascension – analogous to longitude – is one component of an object's position.23h 7m 28.65s
- Dec. PositionDec. PositionDeclination – analogous to latitude – is one component of an object's position.21° 8' 3.69"
- ConstellationConstellationOne of 88 recognized regions of the celestial sphere in which the object appears.Pegasus
- DistanceDistanceThe physical distance from Earth to the astronomical object. Distances within our solar system are usually measured in Astronomical Units (AU). Distances between stars are usually measured in light-years. Interstellar distances can also be measured in parsecs.130 light-years or 40 parsecs
About the Data
- Data DescriptionData DescriptionProposal: A description of the observations, their scientific justification, and the links to the data available in the science archive.
Science Team: The astronomers who planned the observations and analyzed the data. "PI" refers to the Principal Investigator.The original NICMOS data were from the HST proposal 7226: E. Becklin (University of California, Los Angeles) et al.
The science team comprises: R. Soummer, B. Hagan, and A. Rajan (STScI), L. Pueyo and A. Thormann (JHU), and C. Marois (Herzberg Institute of Astrophysics, Victoria).
- InstrumentInstrumentThe science instrument used to produce the data.HST>NICMOS/NIC2
- Exposure DatesExposure DatesThe date(s) that the telescope made its observations and the total exposure time.October 30, 1998, Exposure Time: 20 minutes
- FiltersFiltersThe camera filters that were used in the science observations.F160W
- Object NameObject NameA name or catalog number that astronomers use to identify an astronomical object.HR 8799
- Object DescriptionObject DescriptionThe type of astronomical object.Star with planets
- Release DateApril 21, 2021
- Science ReleaseNASA’s Webb to Study Young Exoplanets on the Edge
- CreditImage: NASA, ESA, Rémi Soummer (STScI)
This image was originally black and white and recorded only overall brightness. These brightness values were translated into a range of arbitrary colors. Such color "maps" can be useful in helping to distinguish subtly varying brightness in an image.
Related Images & Videos
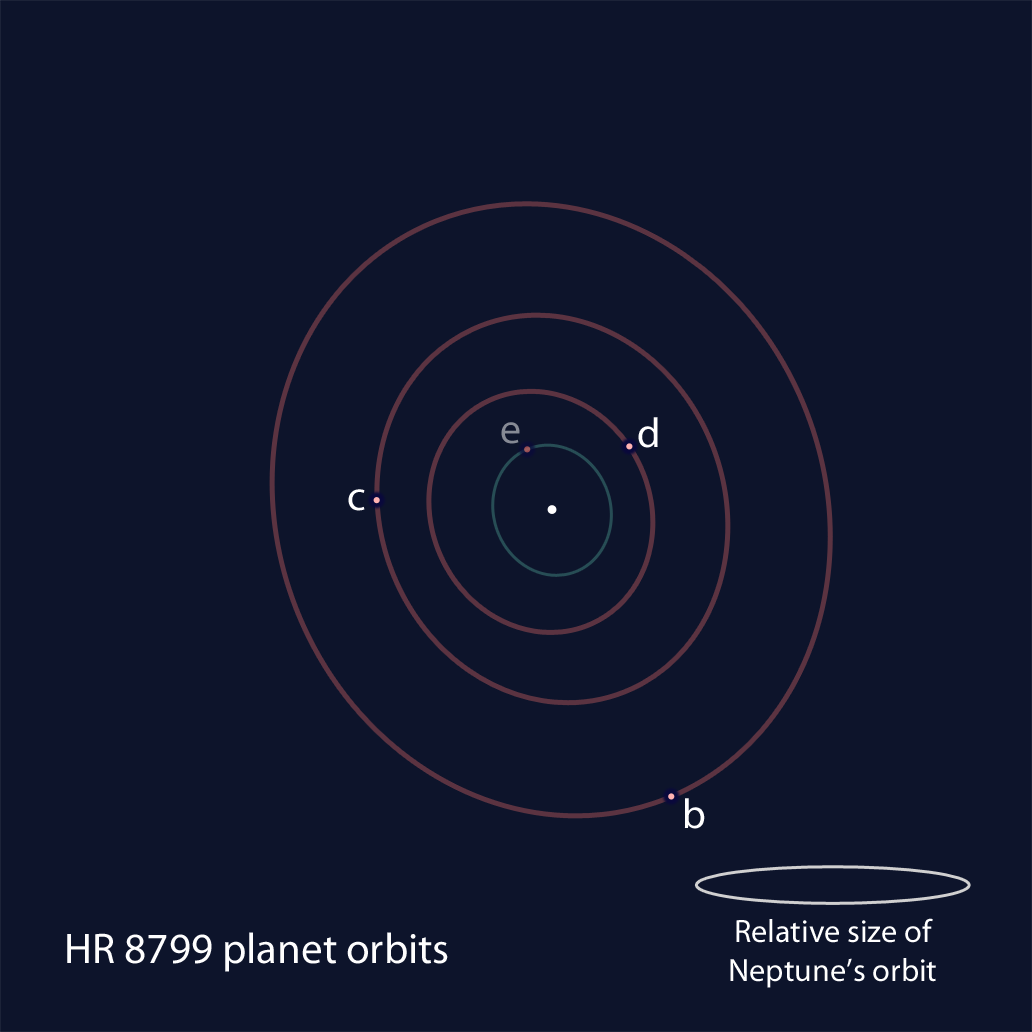
HR 8799 Exoplanet System: Positional Schematic
This schematic shows the positions of the four exoplanets orbiting far away from the nearby star HR 8799. The orbits appear elongated because of a slight tilt of the plane of the orbits relative to our line of sight. The size of the HR 8799 planetary system is comparable to our...
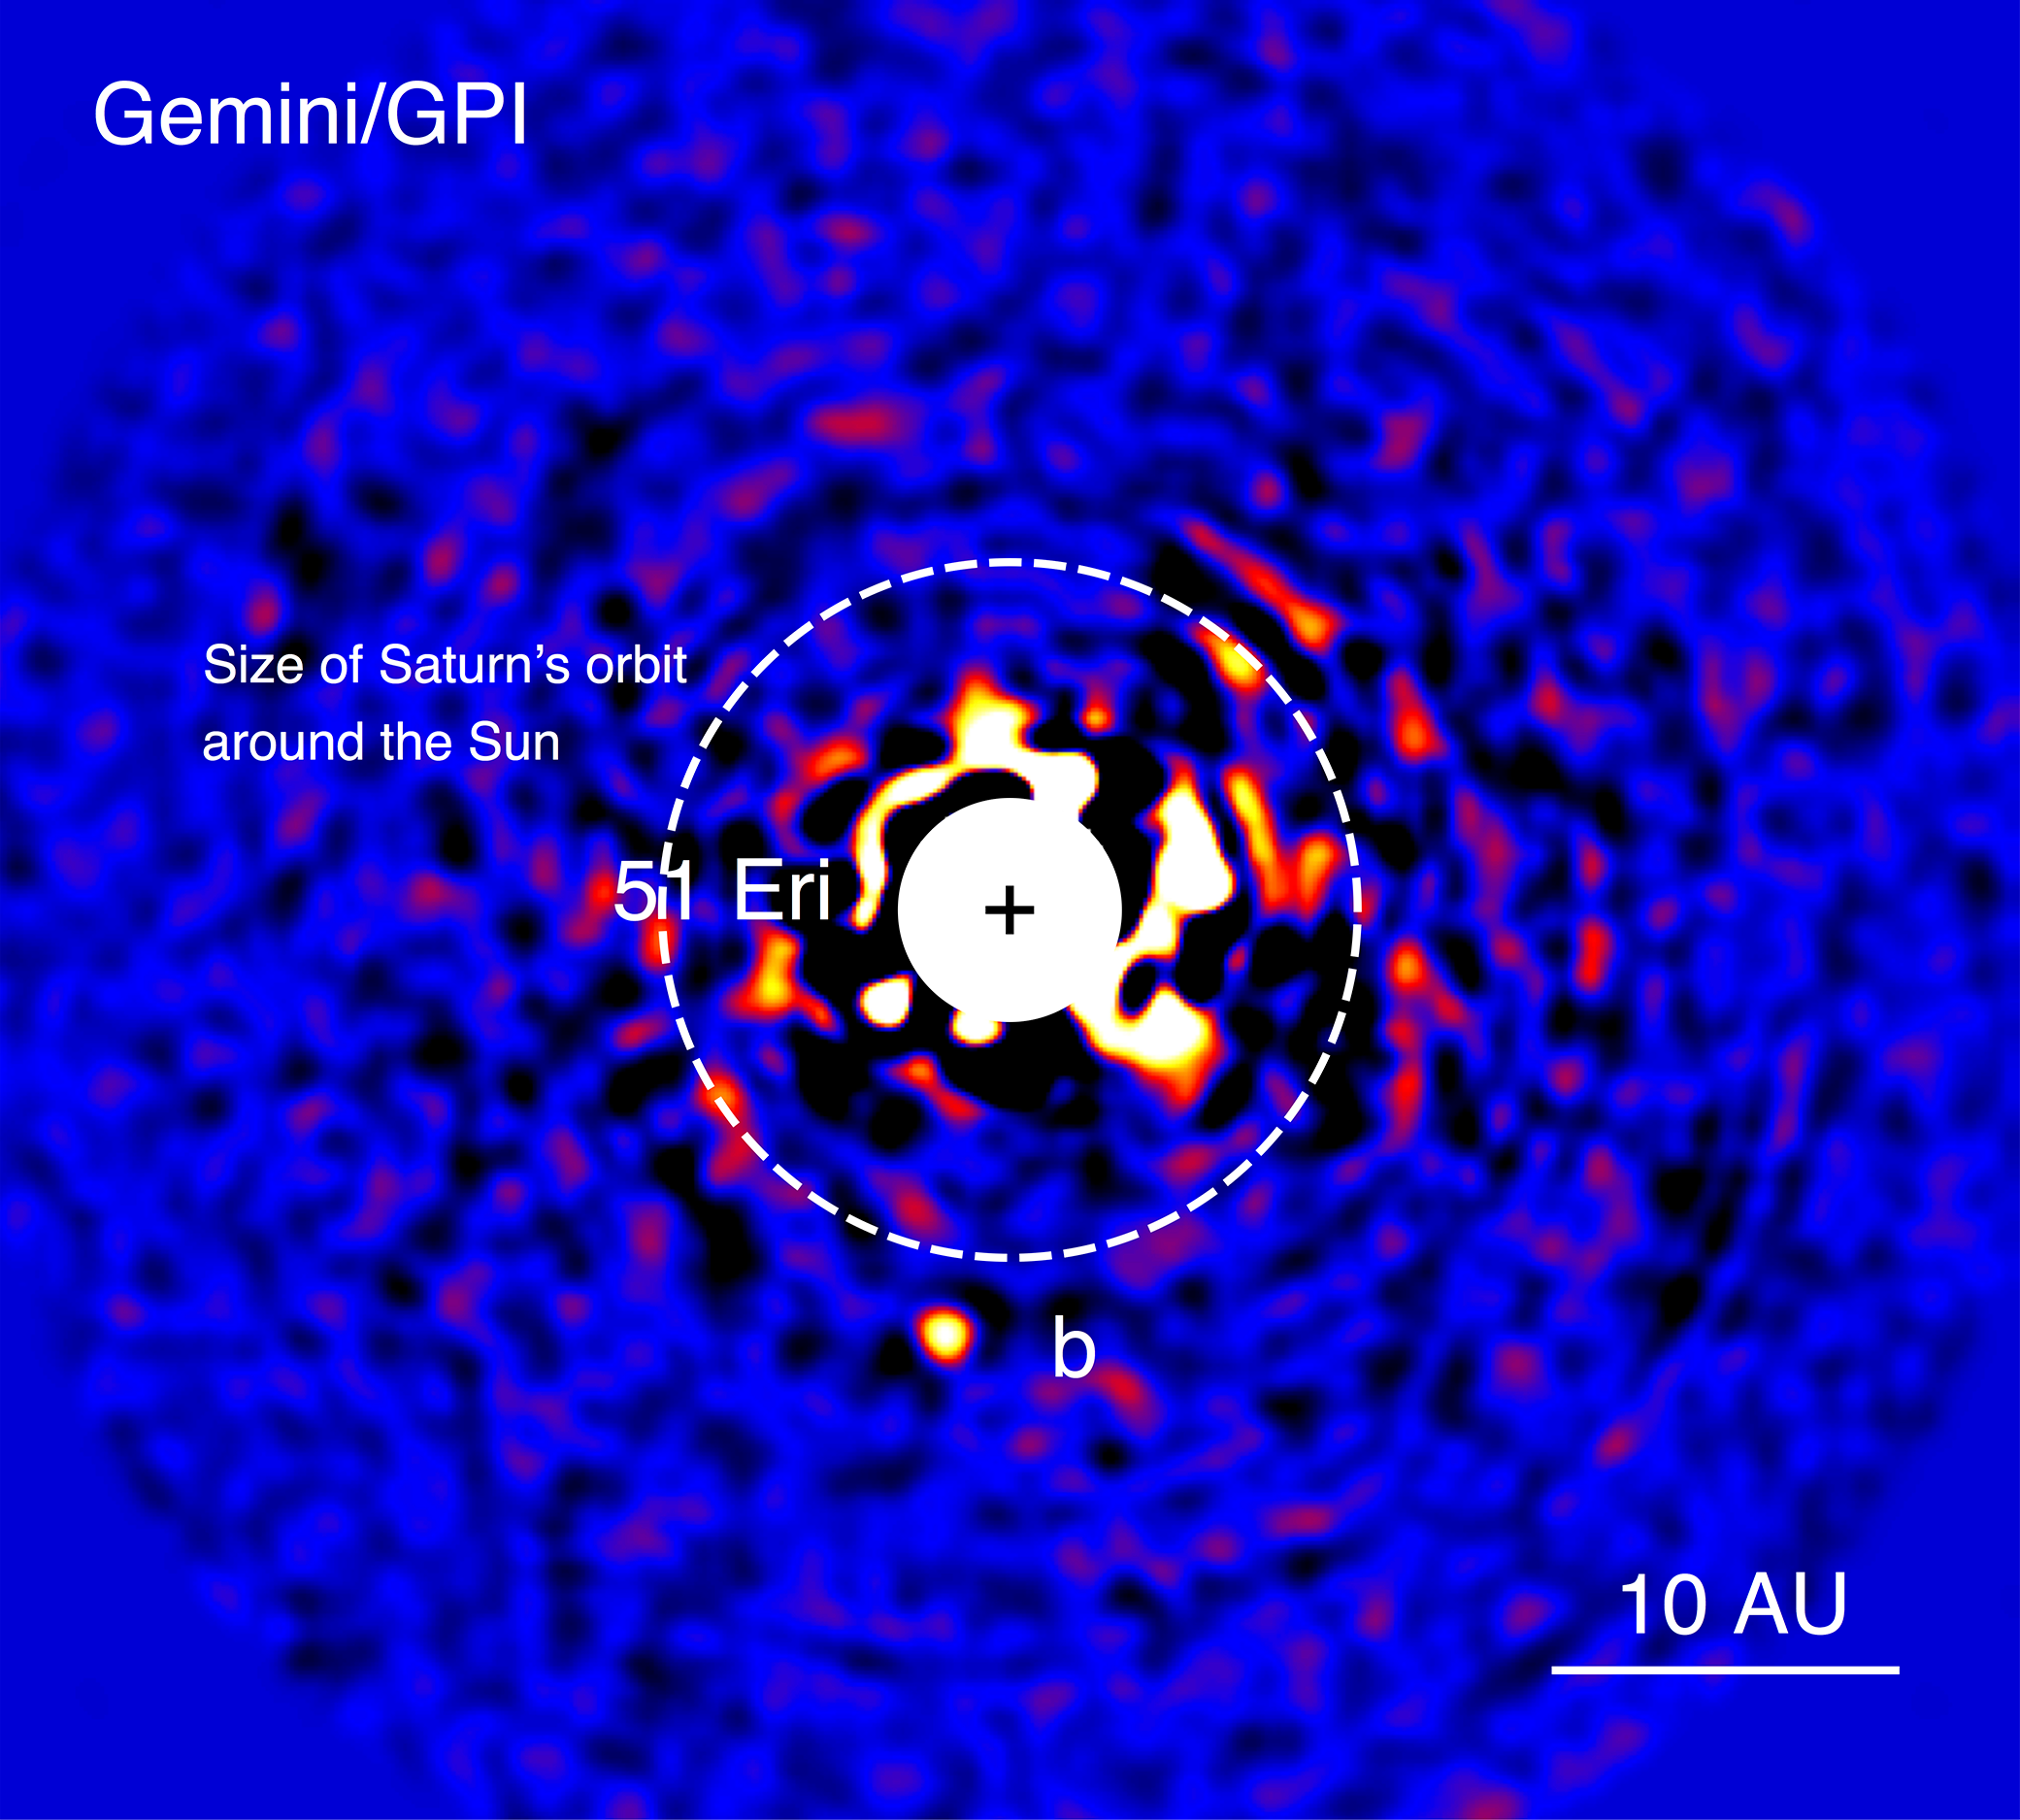
Exoplanet 51 Eridani b (Gemini)
This discovery image of a Jupiter-sized extrasolar planet orbiting the nearby star 51 Eridani was taken in near-infrared light in 2014 by the Gemini Planet Imager. The bright central star is hidden behind a mask in the center of the image to enable the detection of the...
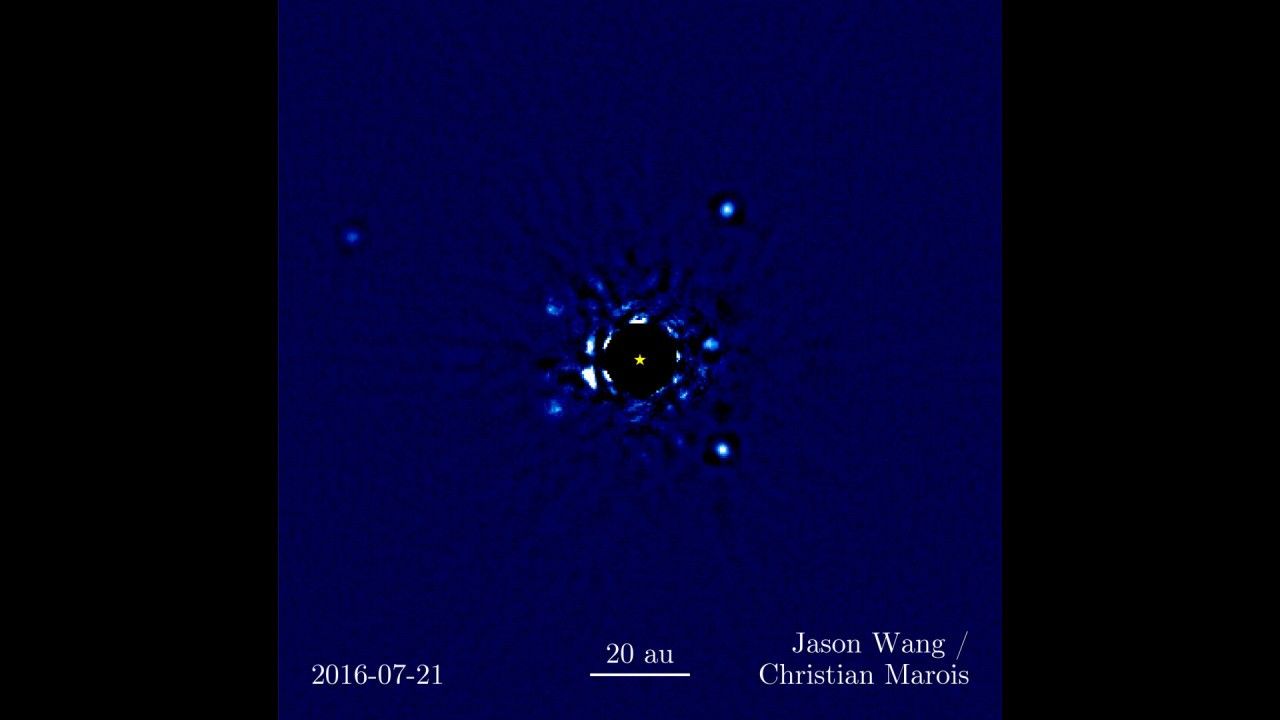
Planets Orbiting HR 8799
This video shows four Jupiter-sized exoplanets orbiting billions of miles away from their star in the nearby HR 8799 system. The planetary system is oriented face-on toward Earth, giving astronomers a unique bird’s-eye view of the planets’ motion. The exoplanets are orbiting so...
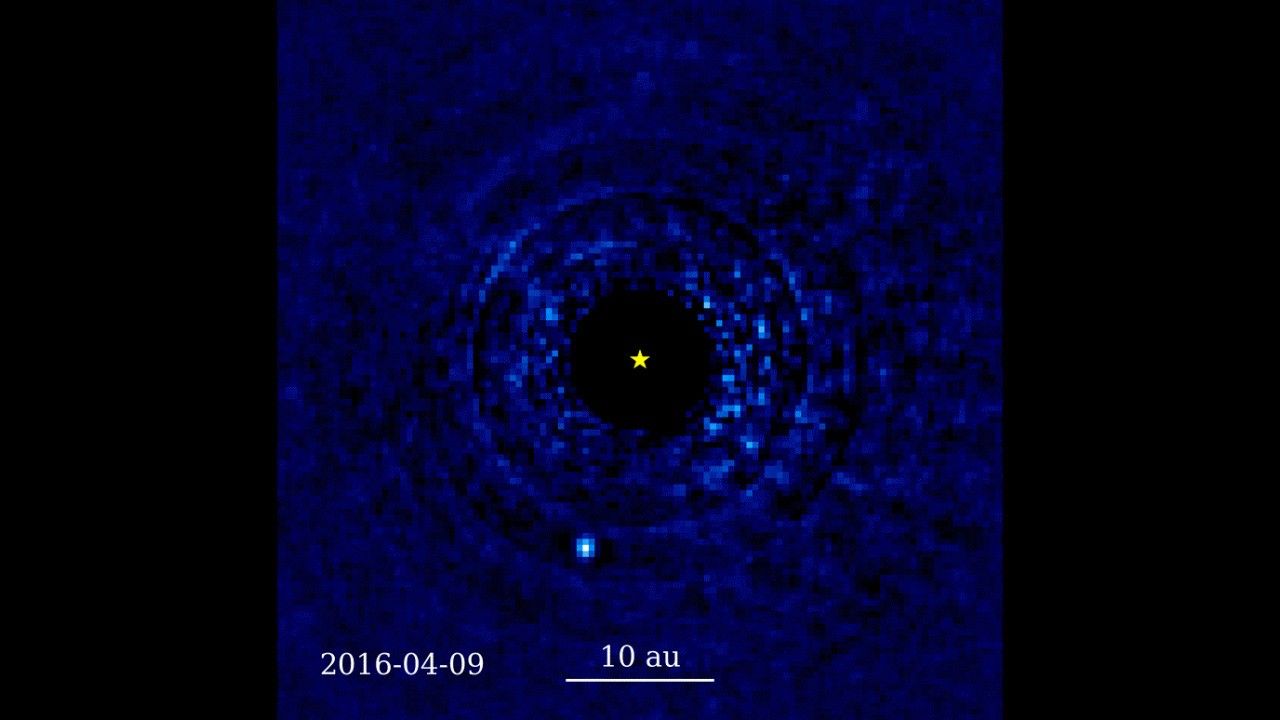
Planet Orbiting 51 Eridani
This video shows a Jupiter-sized exoplanet orbiting far away — roughly 11 billion miles — from a nearby, Sun-like star, 51 Eridani. The planetary system is oriented face-on toward Earth, giving astronomers a unique bird’s-eye view of the planet’s motion. The video consists of...
Share
Details
Laura Betz
NASA’s Goddard Space Flight Center
Greenbelt, Maryland
laura.e.betz@nasa.gov
NASA, ESA, Rémi Soummer (STScI)


