


1 min read
Emission of Light by Hydrogen
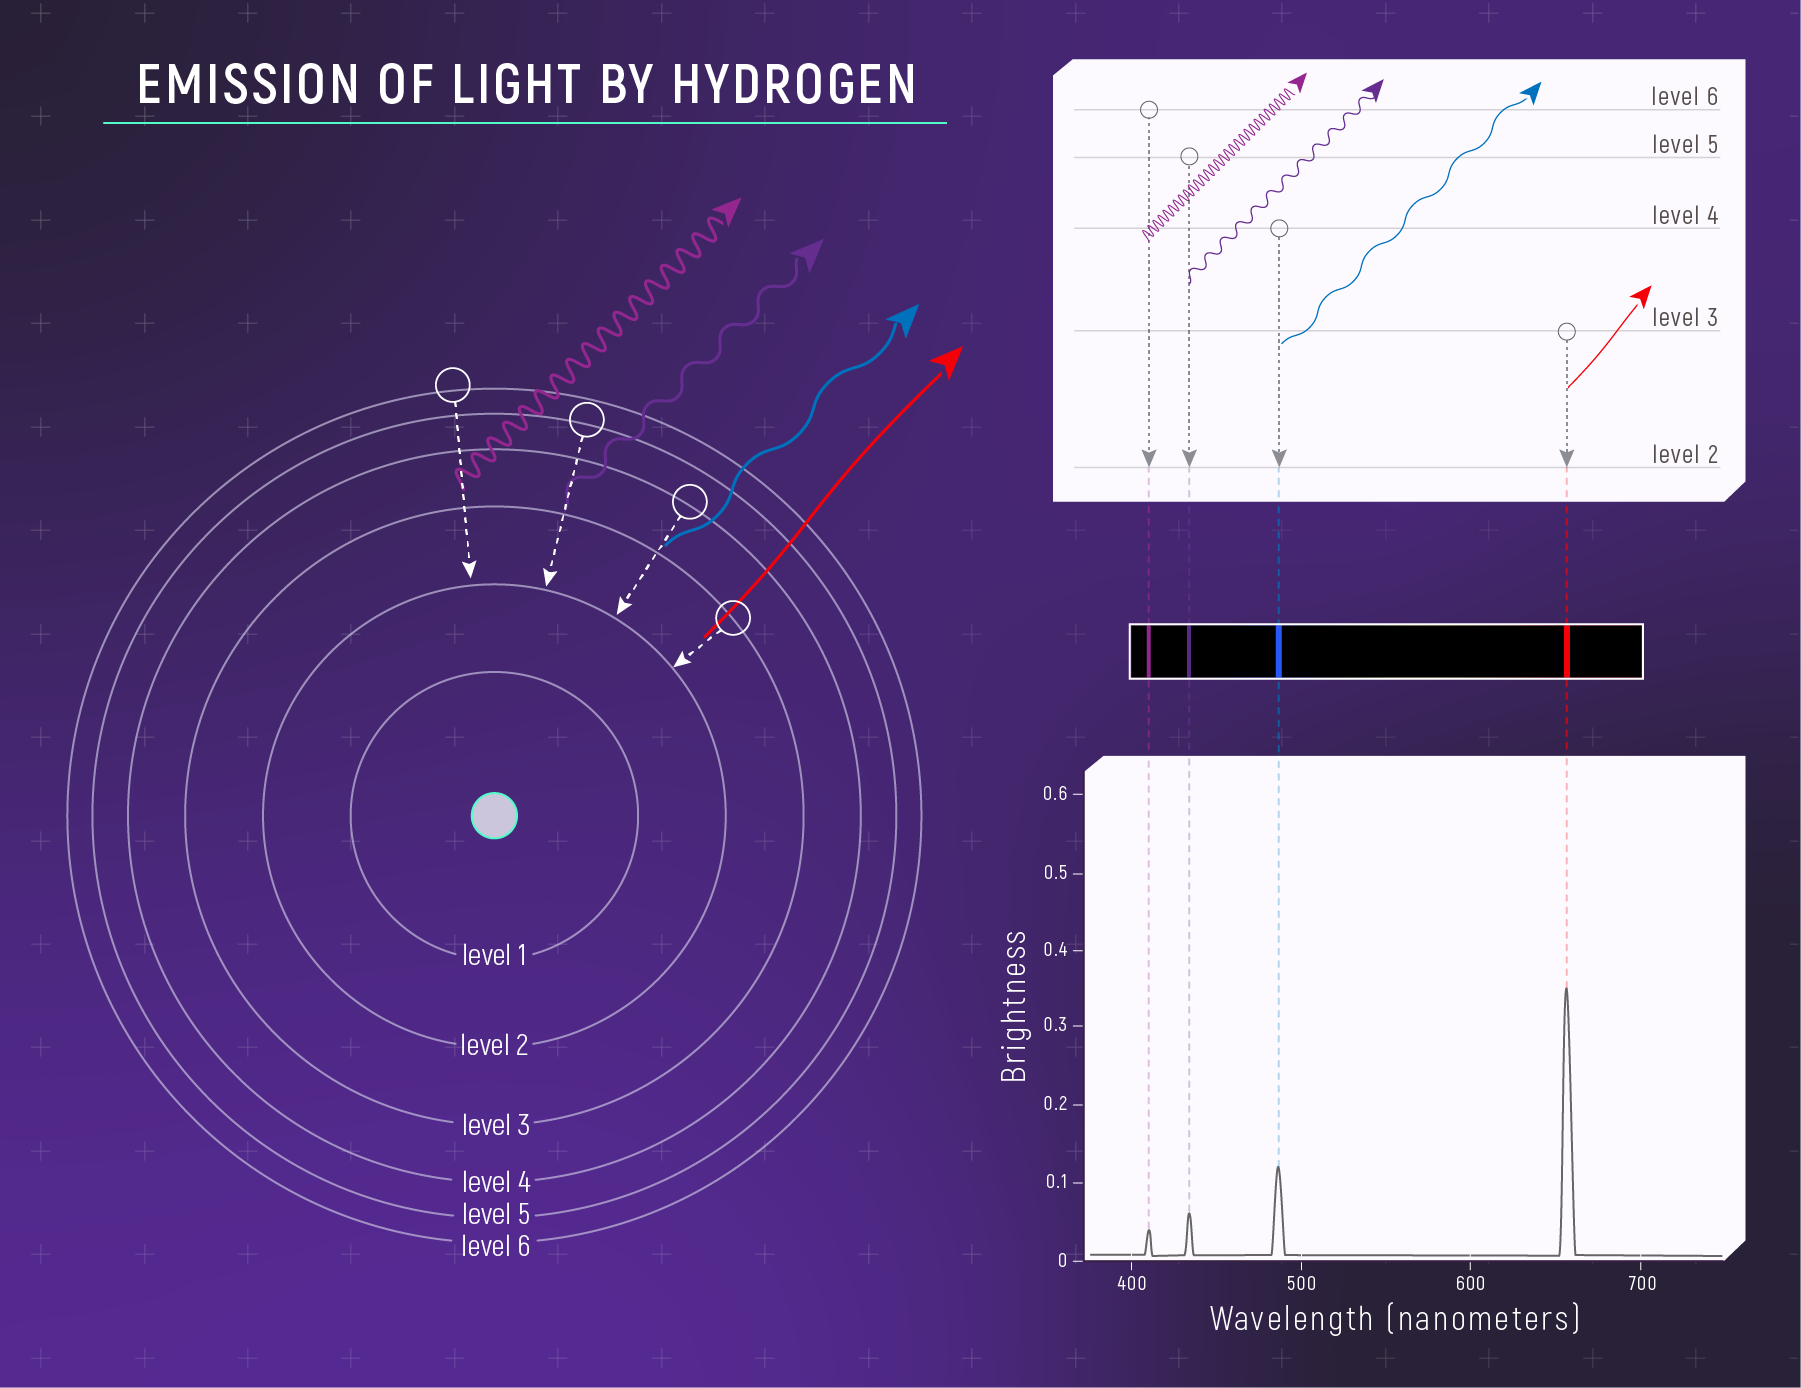
The relationship between a hydrogen atom and its emission spectrum. (Left) A simple model of a hydrogen atom showing four of the many possible “drops” the electron could make when it emits light. (Right) The relationship between the electron drop and the specific wavelengths of light that the atom emits. When an electron drops down from one energy level to another, it emits a very specific wavelength of light (i.e., it emits a photon with a specific energy). The farther the drop, the shorter the wavelength and the higher the energy of the photon. Wavelengths that are emitted appear as bright lines in the spectrum. This illustration shows a set of drops that correspond to emission of visible wavelengths (the Balmer Series).
Share
Details
Laura Betz
NASA’s Goddard Space Flight Center
Greenbelt, Maryland
laura.e.betz@nasa.gov
NASA, ESA, CSA, Leah Hustak (STScI)


