


1 min read
TRAPPIST-1 e Transmission Spectrum (NIRSpec)
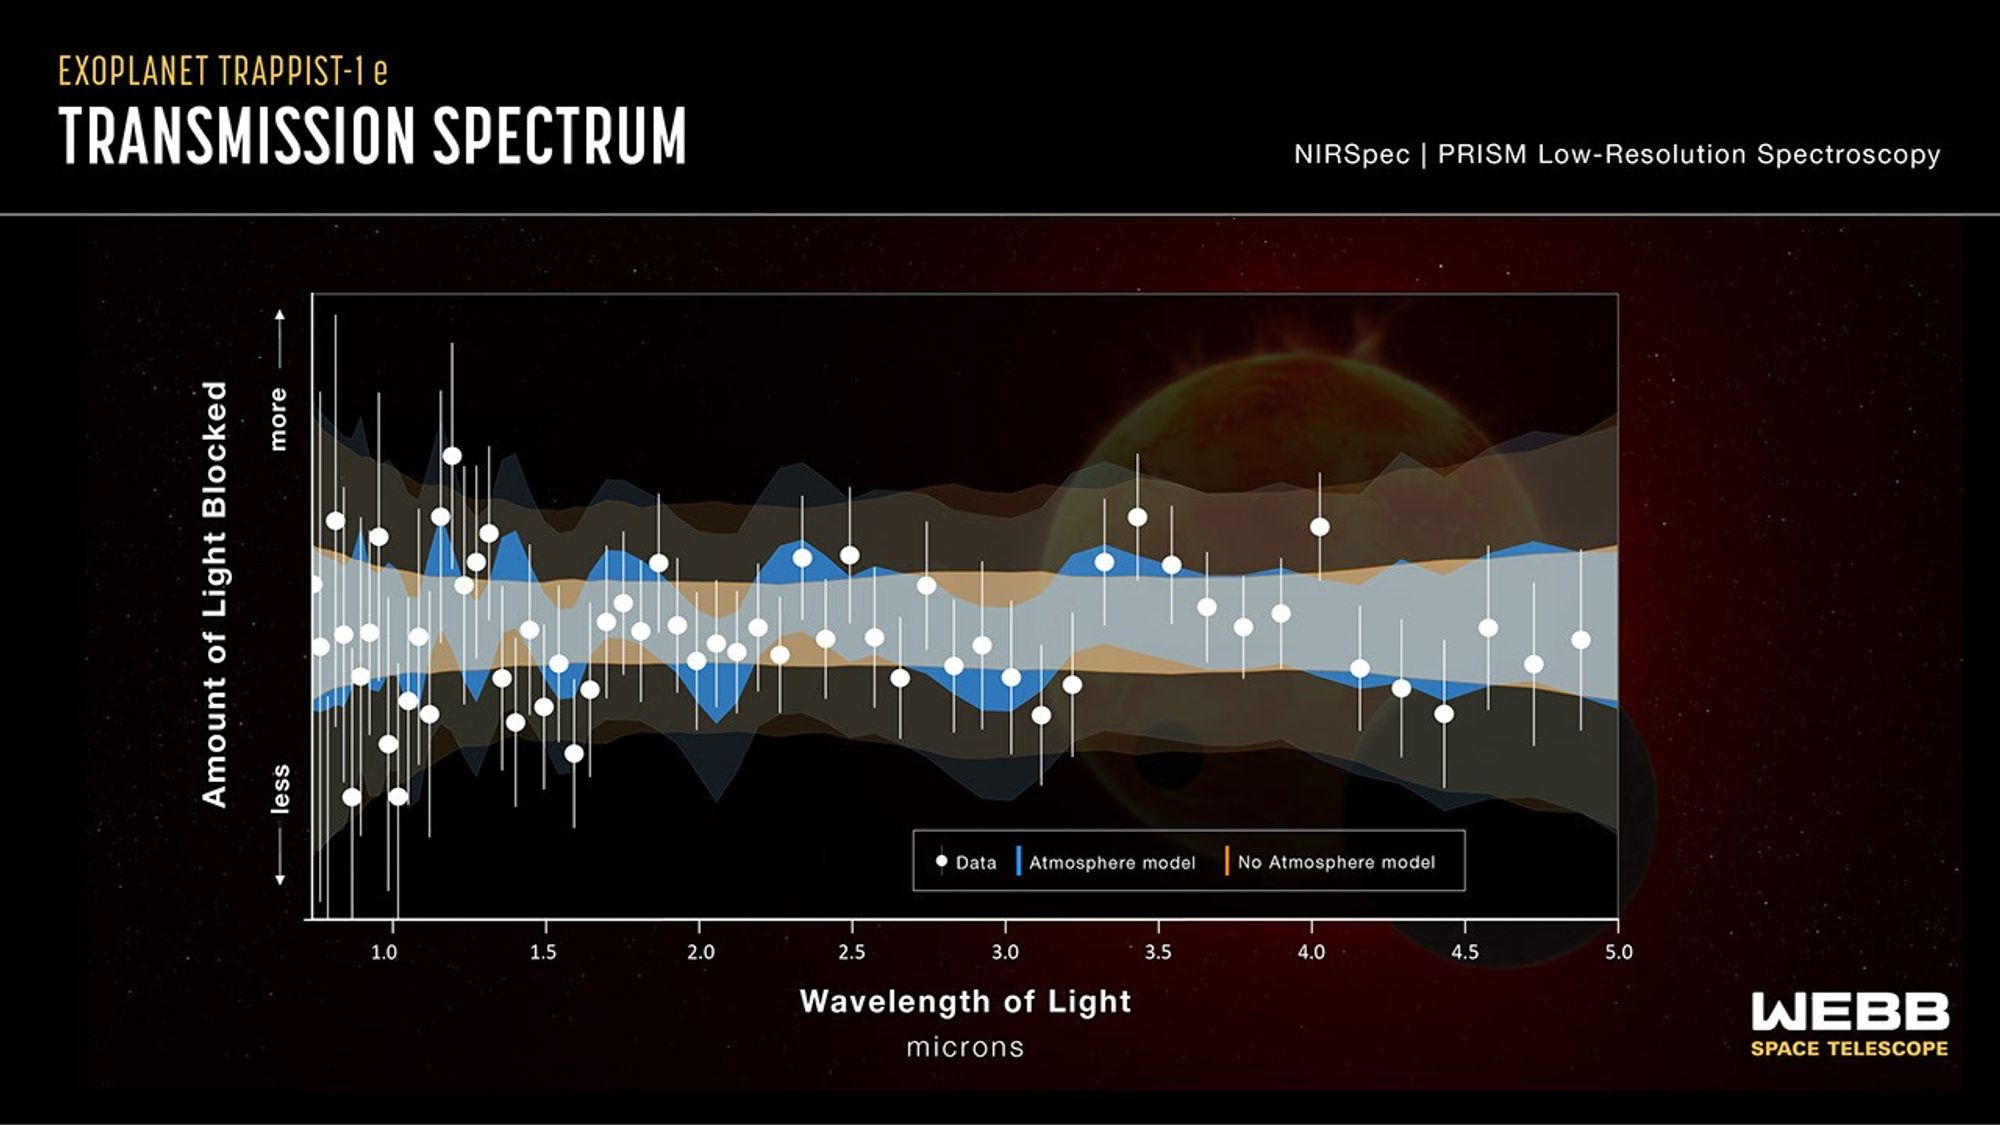
This transmission spectrum graph compares data collected by the NIRSpec (Near-Infrared Spectrograph) instrument on NASA’s James Webb Space Telescope with computer models of exoplanet TRAPPIST-1 e with (blue) and without (orange) an atmosphere. Narrower, darker colored bands show the most likely locations of data points for each model while wider, more transparent bands show areas that are less likely but still permitted by the models. The gray region shows where those two models overlap. Researchers can’t yet confidently rule out an atmosphere since many of the data points fit either scenario. As Webb makes additional observations of the exoplanet, researchers will be able to further refine and characterize the atmospheric readings. However, the existing data does indicate that the exoplanet does not have a thick, hydrogen-rich atmosphere because multiple prominent spikes would be detectable if hydrogen were present.
- Release DateSeptember 8, 2025
- Science ReleaseNASA Webb Looks at Earth-Sized, Habitable-Zone Exoplanet TRAPPIST-1 e
- CreditIllustration: NASA, ESA, CSA, STScI, Joseph Olmsted (STScI)
Related Images & Videos

Share
Details
Laura Betz
NASA’s Goddard Space Flight Center
Greenbelt, Maryland
laura.e.betz@nasa.gov


