


1 min read
Cosmic Evolution Early Release Science (CEERS) Survey (NIRCam Image)
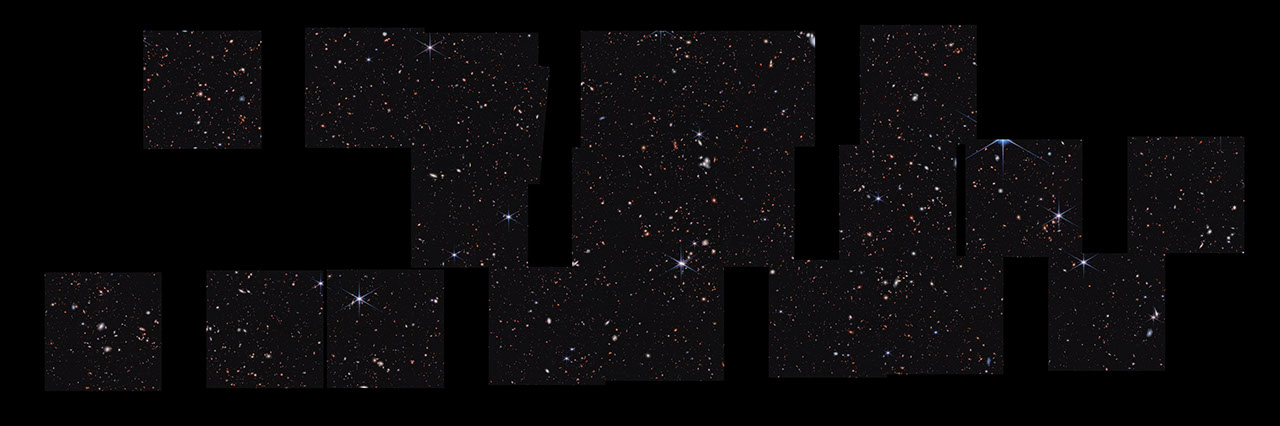
Stare deeply at this vast landscape. It was stitched together from multiple images captured by the James Webb Space Telescope in near-infrared light – and it is practically pulsing with activity.
To the right of center is a clump of bright white spiral galaxies that seem to be twisting into one another. Threaded throughout the scene are light pink spirals that look like pinwheels twirling in the wind. The bright foreground stars, set off in blue, announce themselves with Webb’s prominent eight-pointed diffraction spikes. Don’t miss an unconventional sight: In the bottom row, find the square second from far right. At its right edge, a misshapen blue galaxy is outfitted in blue-and-pink sparkling star clusters.
There is so much detail to explore in this panoramic vista, known as the Cosmic Evolution Early Release Science (CEERS) Survey. The galaxies that first caught the eyes of the researchers are those that haven’t appeared in any other images – Webb was the first to reveal their presence.
To find them, seek the tiniest, reddest dots speckled throughout this survey. The light from some of them has traveled for over 13 billion years to reach the telescope. The team followed up to obtain spectra with Webb, which led to the discovery of the most distant active supermassive black hole currently known, along with two more extremely distant active supermassive black holes that existed when the universe was only 1 billion years old. The additional studies also confirmed that eleven galaxies existed when the universe was only 470 to 675 million years. (Read about seven of these extremely distant galaxies.)
Want to be wowed again? Webb spent under an hour capturing each image in this field. Combined, they show off about 100,000 galaxies.
The CEERS Survey has already proven to researchers that Webb will help us learn an incredible amount about the early universe. “Galaxies appear earlier and in higher numbers than any of our predictions estimated,” said program lead Steven Finkelstein of the University of Texas at Austin. “There are so many new mysteries to explore.”
This field is one of Webb’s first observations, which is why we still know so little about it. Read more about what researchers will continue to seek in CEERS images and data.
About the Object
- R.A. PositionR.A. PositionRight ascension – analogous to longitude – is one component of an object's position.14:19:46
- Dec. PositionDec. PositionDeclination – analogous to latitude – is one component of an object's position.+52:53:37
- ConstellationConstellationOne of 88 recognized regions of the celestial sphere in which the object appears.Boötes
- DimensionsDimensionsThe physical size of the object or the apparent angle it subtends on the sky.Image is about 23 arcminutes across.
About the Data
- Data DescriptionData DescriptionProposal: A description of the observations, their scientific justification, and the links to the data available in the science archive.
Science Team: The astronomers who planned the observations and analyzed the data. "PI" refers to the Principal Investigator.This image was created with Webb data from proposal: 1345 (S. Finkelstein).
- InstrumentInstrumentThe science instrument used to produce the data.NIRCam
- Exposure DatesExposure DatesThe date(s) that the telescope made its observations and the total exposure time.20-21 Dec 2022, 24 Dec 2022
- FiltersFiltersThe camera filters that were used in the science observations.F115W, F150W, F200W, F277W, F356W, F444W
- Object NameObject NameA name or catalog number that astronomers use to identify an astronomical object.CEERS Survey, Extended Groth Strip
- Object DescriptionObject DescriptionThe type of astronomical object.Deep field survey
- Release DateJuly 6, 2023
- Science ReleaseWebb Detects Most Distant Active Supermassive Black Hole to Date
- CreditImage: NASA, ESA, CSA, Steve Finkelstein (UT Austin), Micaela Bagley (UT Austin), Rebecca Larson (UT Austin); Image Processing: Alyssa Pagan (STScI)
These images are a composite of separate exposures acquired by the James Webb Space Telescope using the NIRCam instrument. Several filters were used to sample wide wavelength ranges. The color results from assigning different hues (colors) to each monochromatic (grayscale) image associated with an individual filter. In this case, the assigned colors are: Blue: F115W+F150W Green: F200W + F277W Red: F356W + F444W
Related Images & Videos
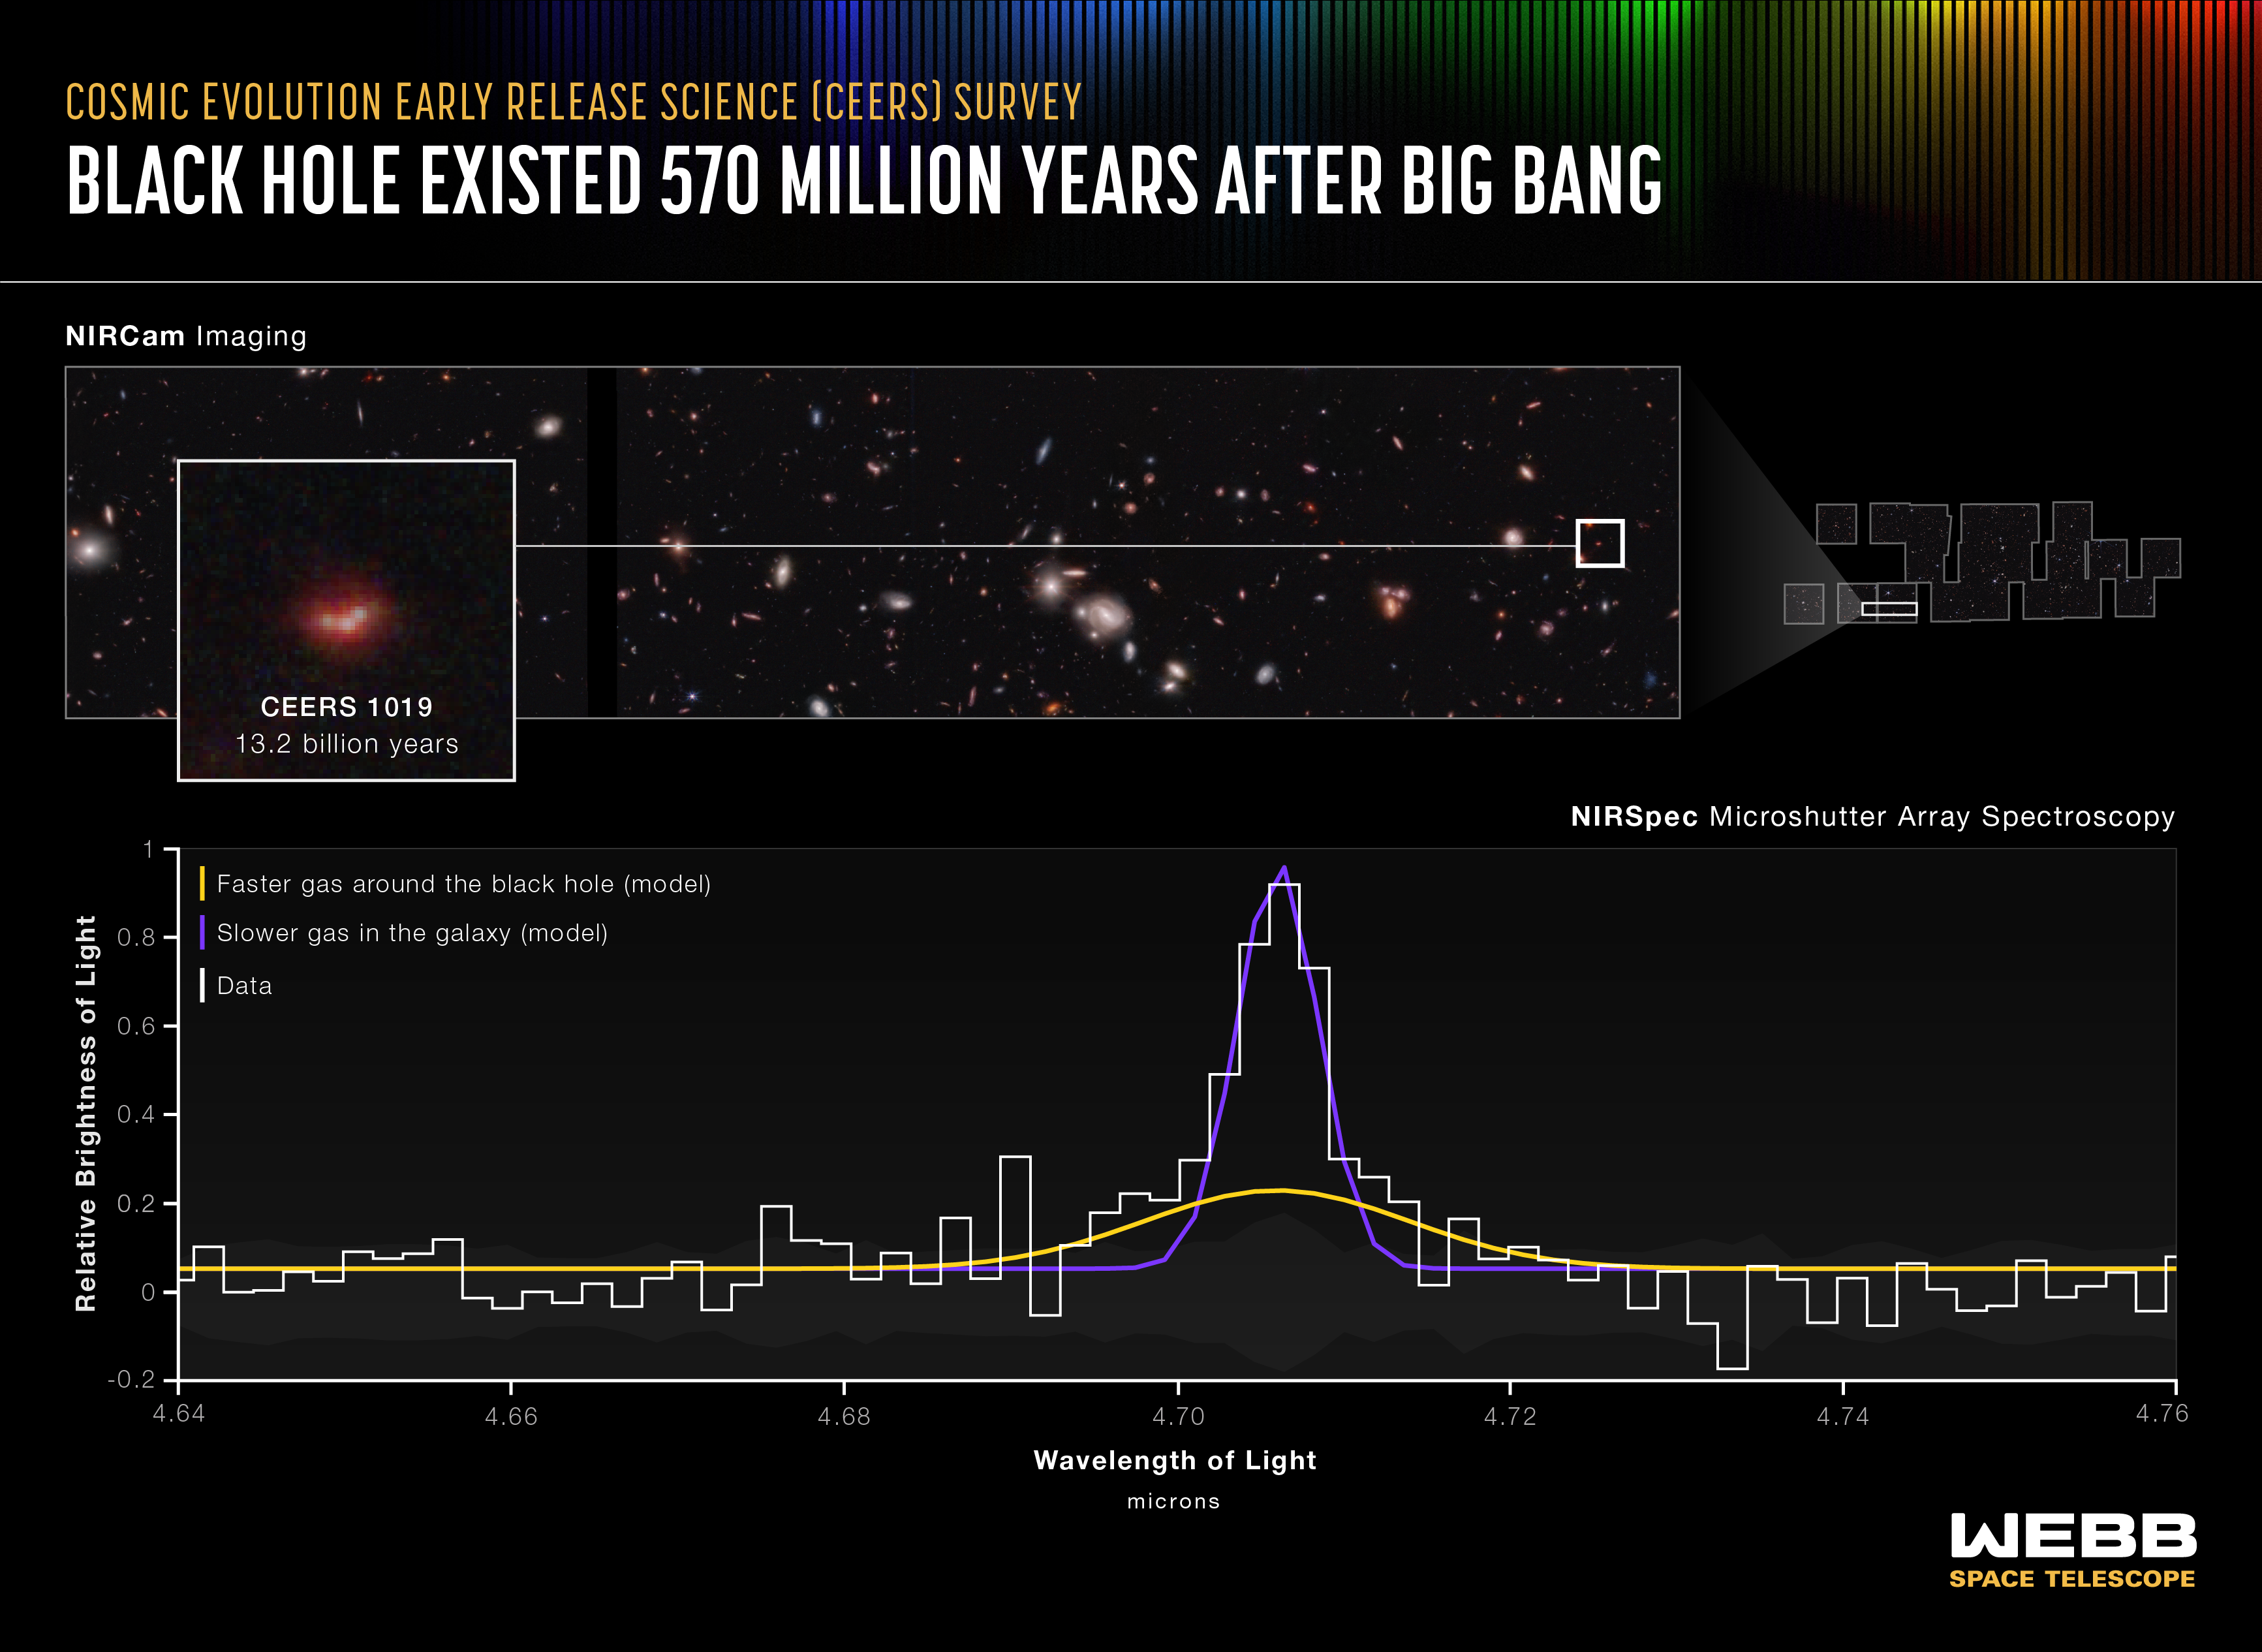
Black Hole Existed 570 Million Years After Big Bang (NIRSpec MSA Emission Spectrum)
Researchers have identified the most distant active supermassive black hole to date in the James Webb Space Telescope’s Cosmic Evolution Early Release Science (CEERS) Survey. The black hole, within galaxy CEERS 1019, existed just over 570 million years after the big bang and...
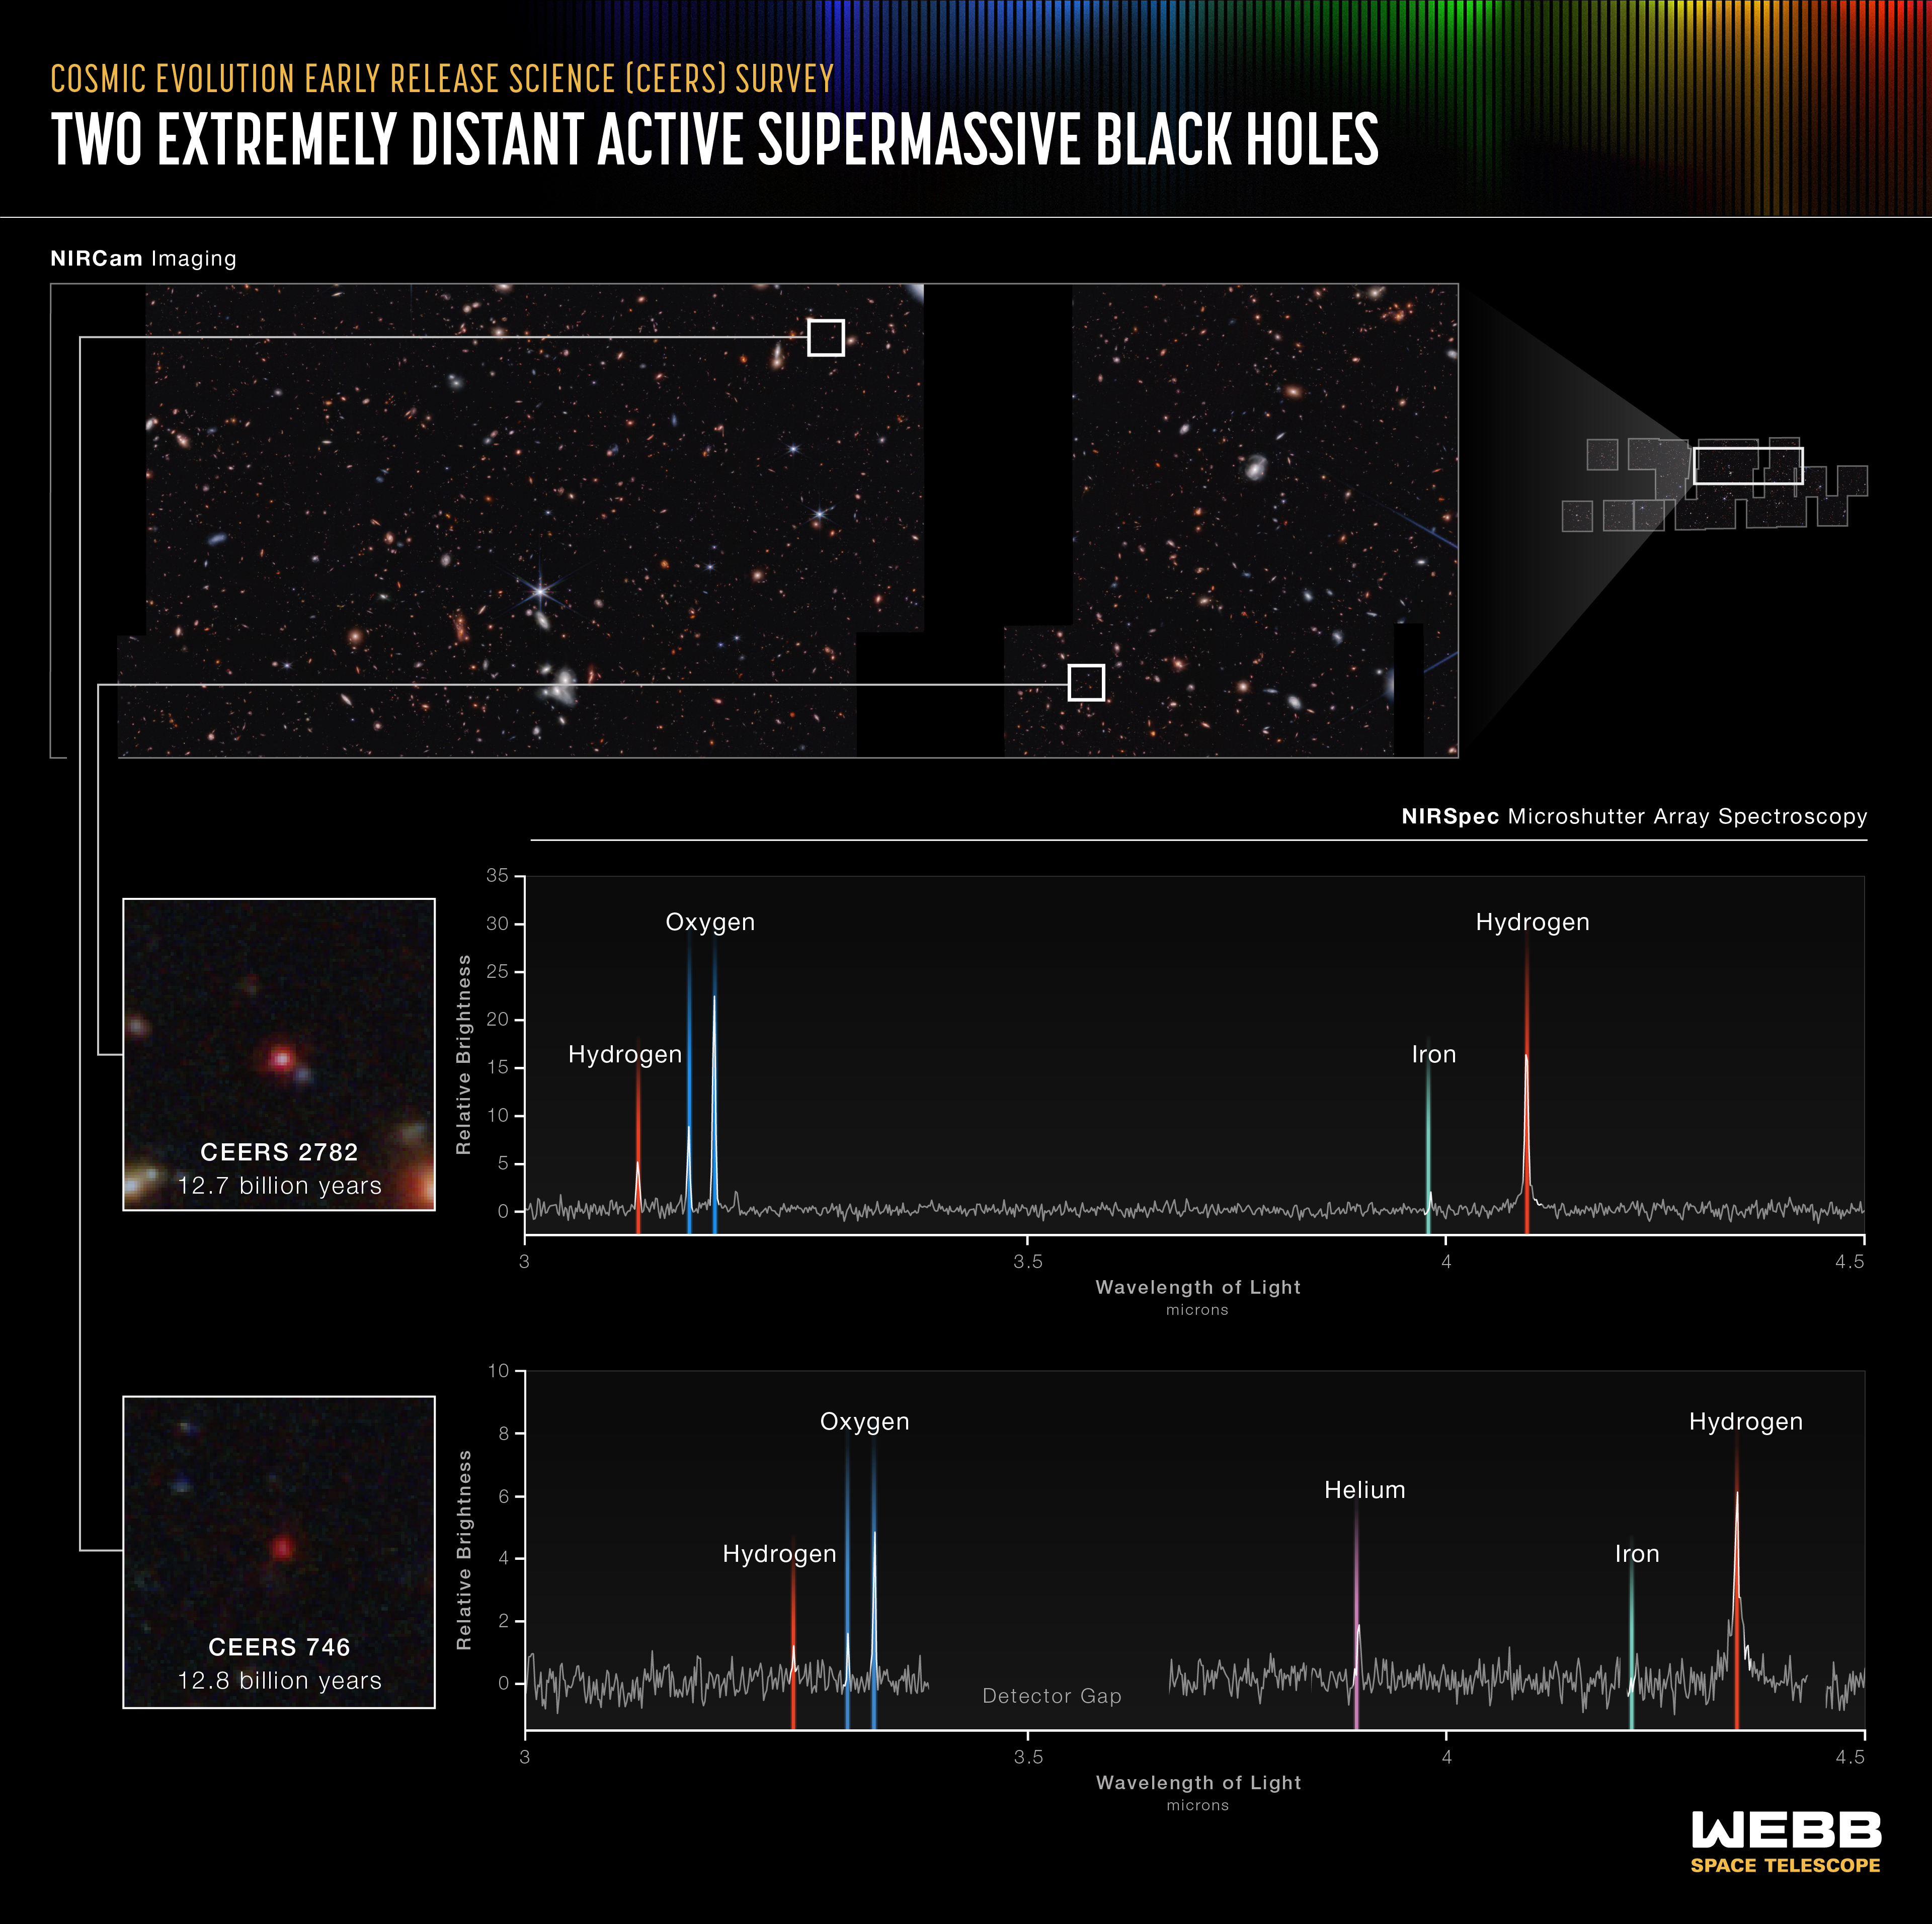
Two Extremely Distant Active Supermassive Black Holes (NIRSpec MSA Emission Spectra)
Researchers using data and images from the James Webb Space Telescope have already captured two of the smallest known supermassive black holes in the early universe. Webb’s spectra show that these black holes weigh only 10 million times the mass of the Sun. Other very distant...
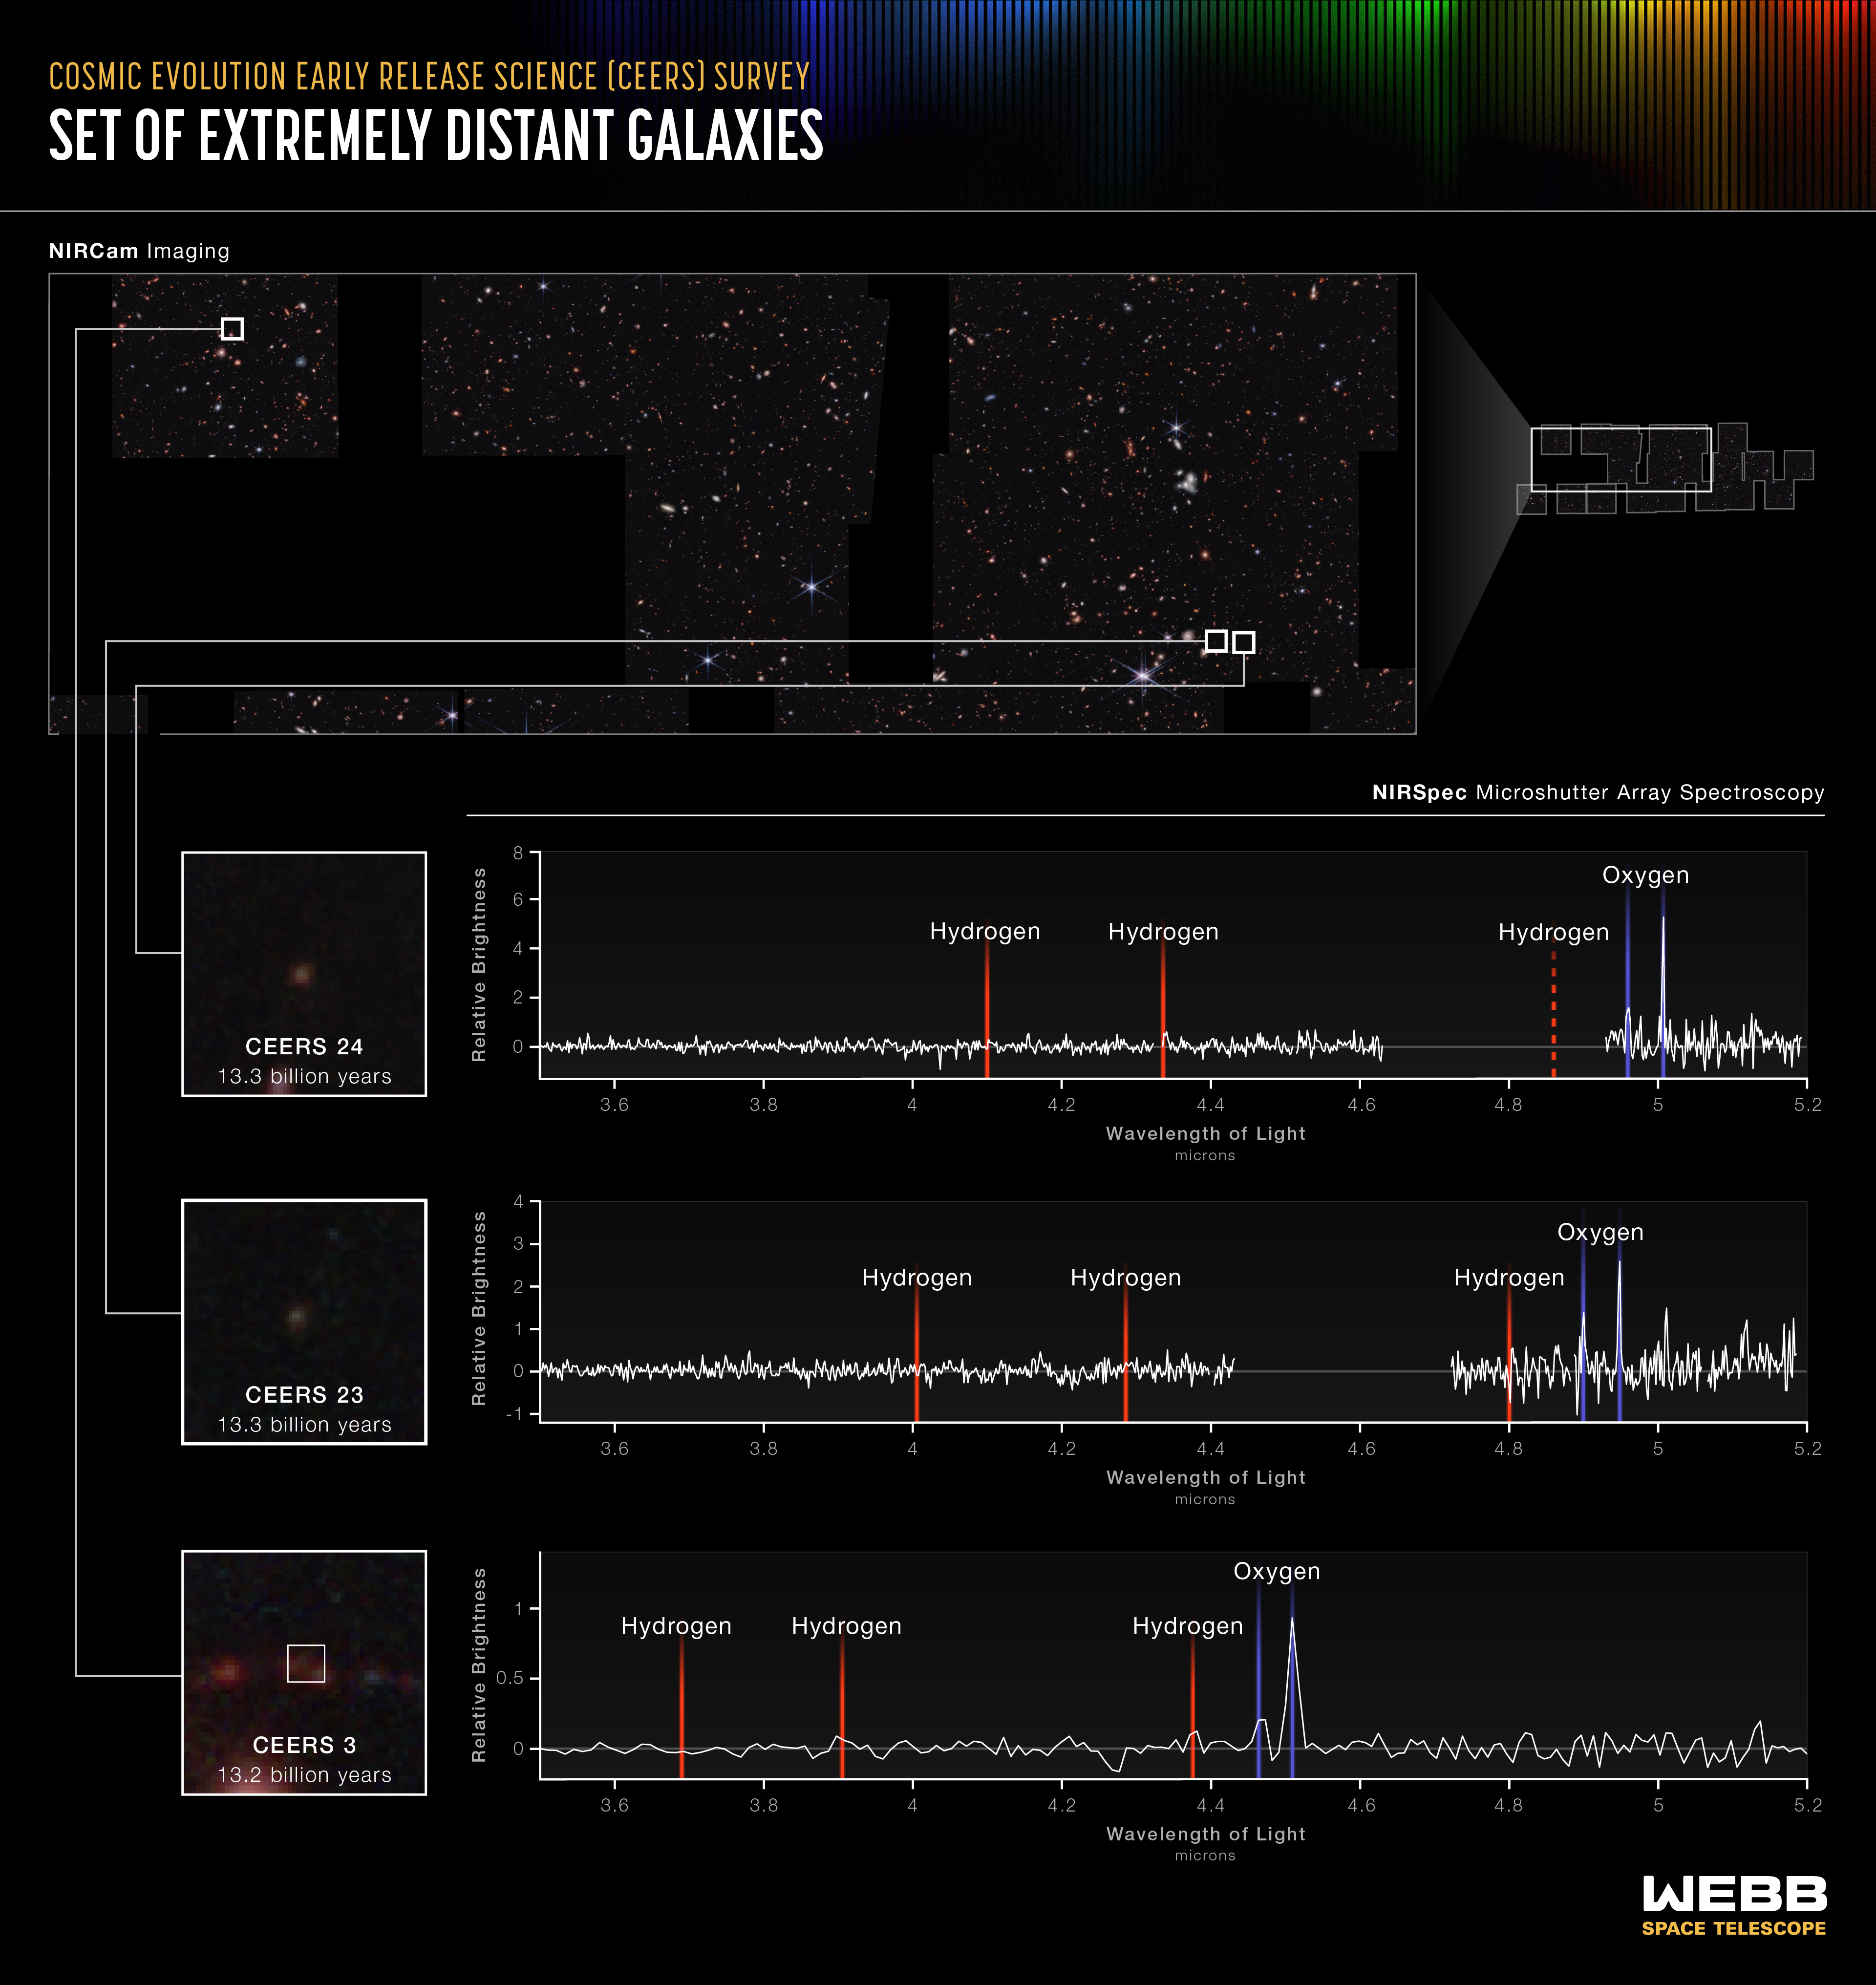
Set of Extremely Distant Galaxies (NIRSpec MSA Emission Spectra)
A team investigating data from Webb’s Cosmic Evolution Early Release Science (CEERS) Survey has already identified seven galaxies that existed when the universe was only 540 to 660 million years old. Some of the evidence is displayed above: Three lines appear in the same order –...
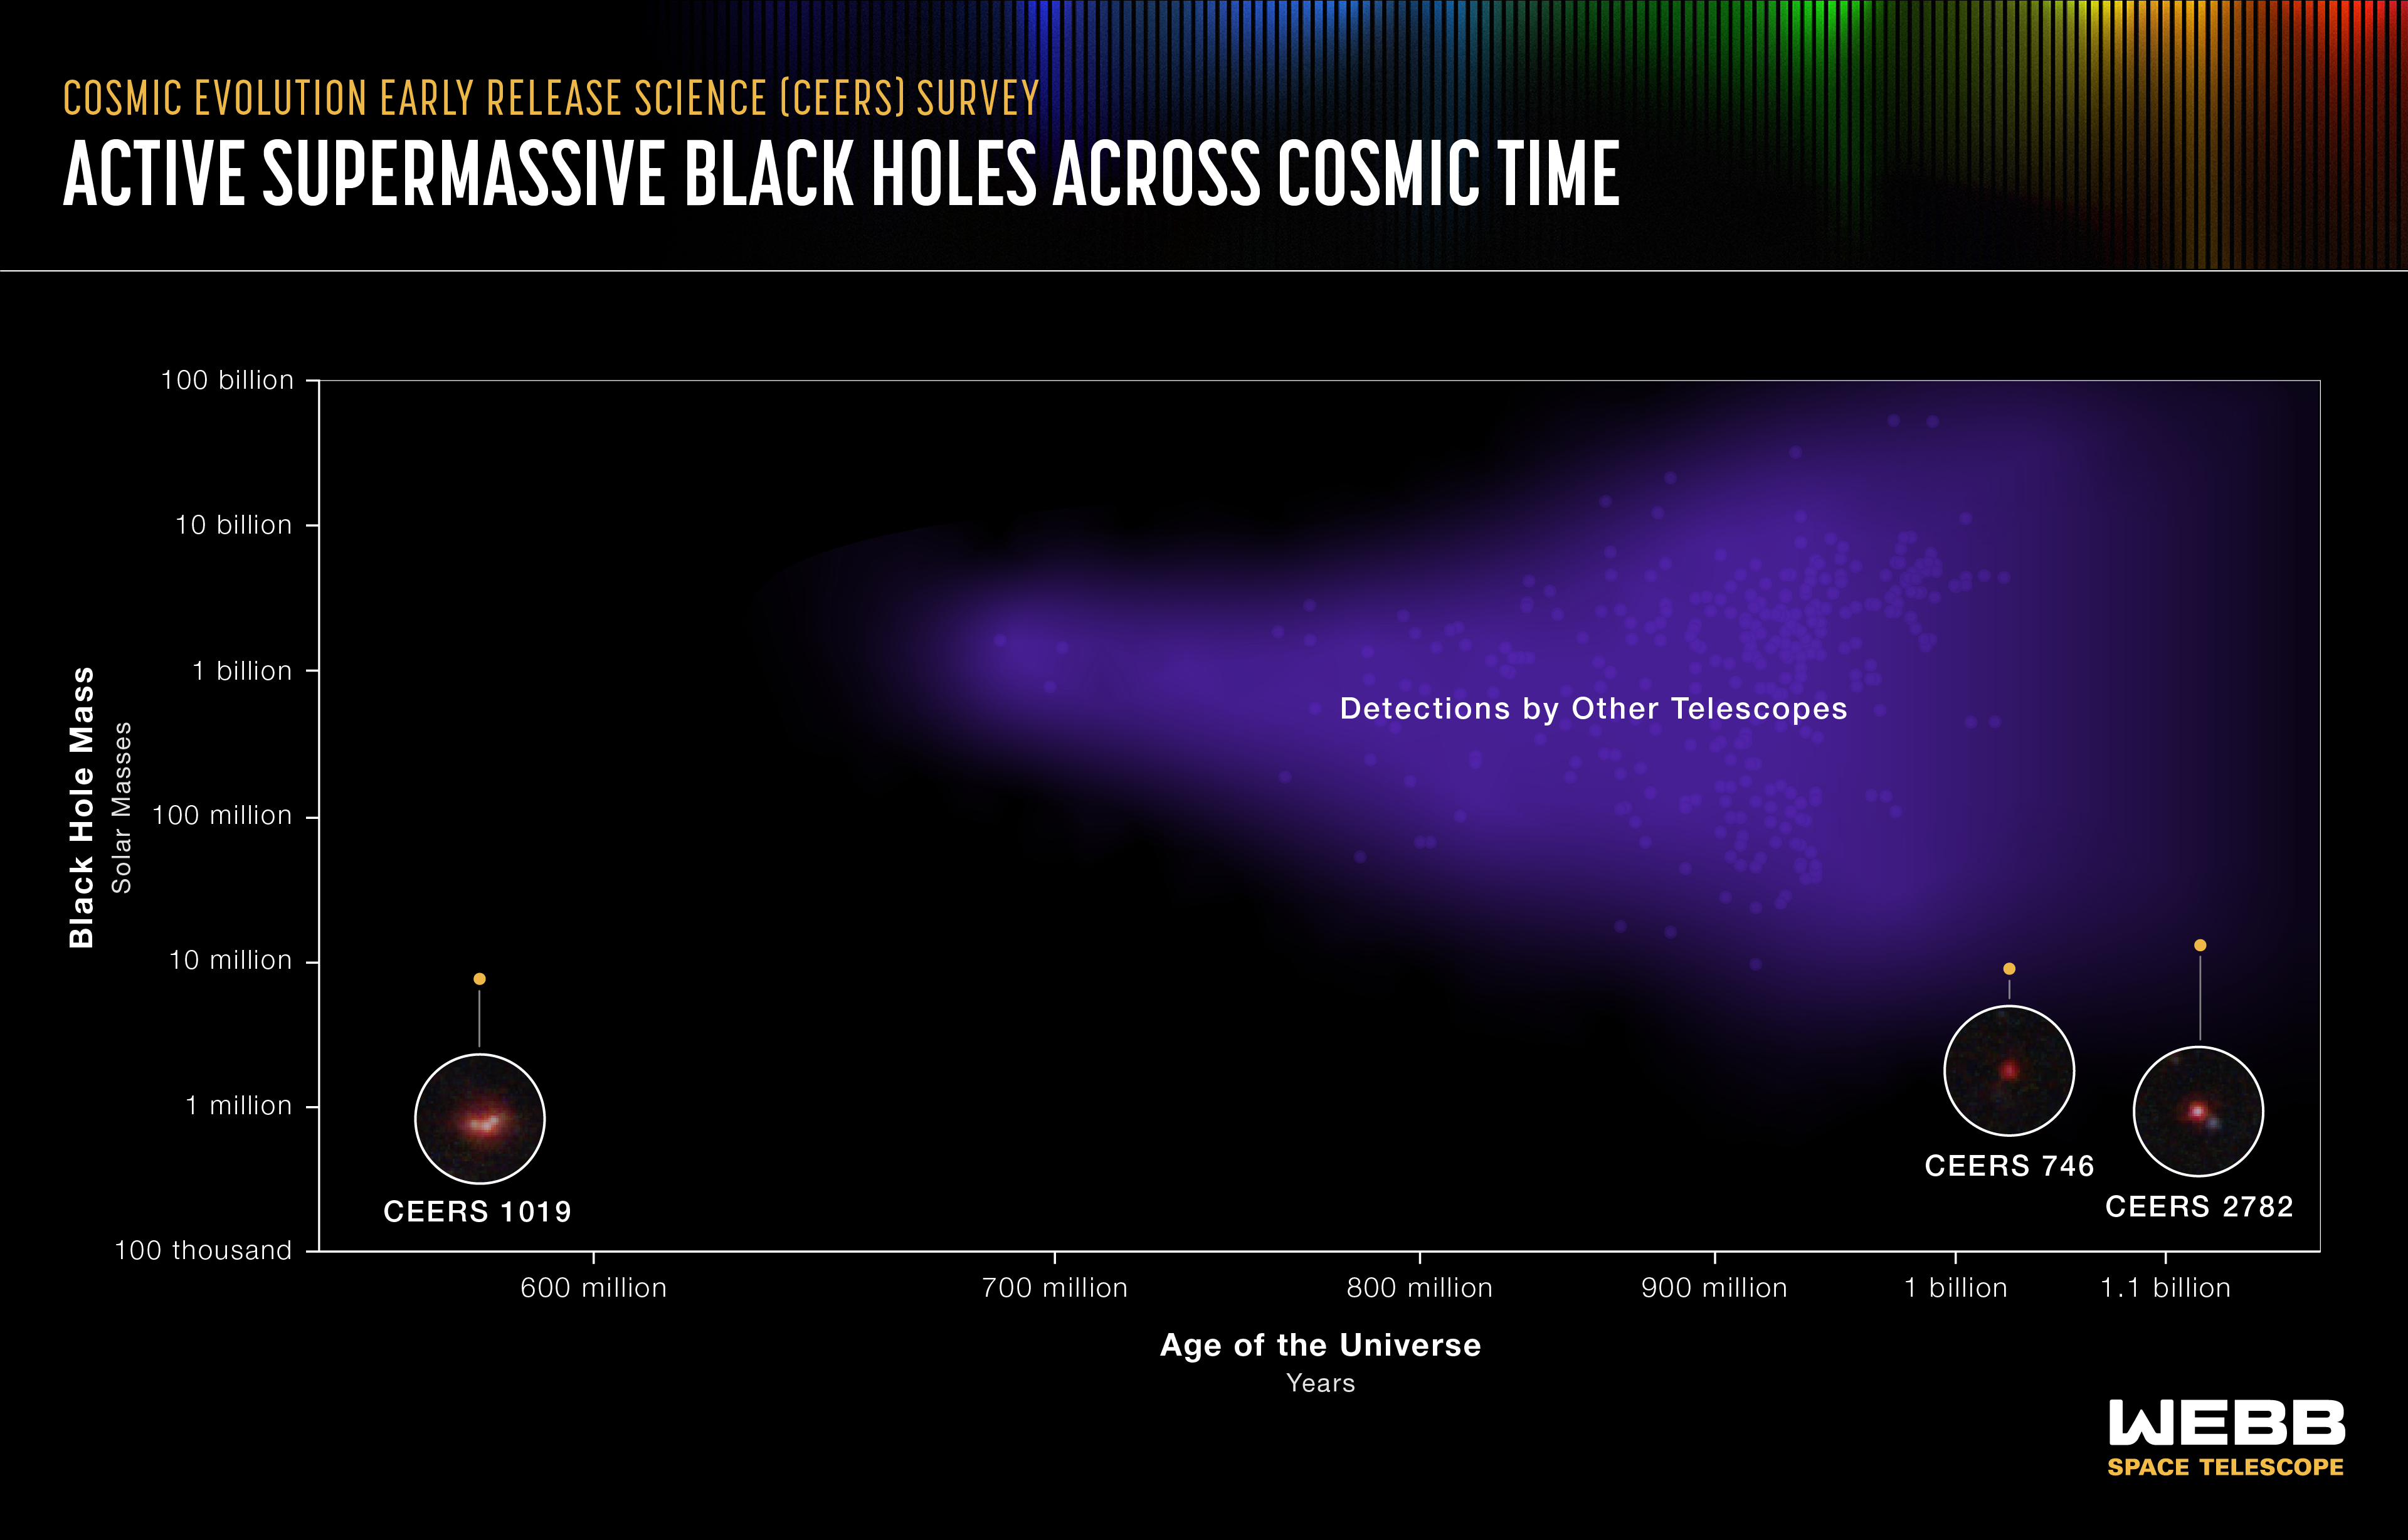
Active Supermassive Black Holes Across Cosmic Time
This graphic shows detections of the most distant active supermassive black holes currently known in the universe. They were identified by a range of telescopes, both in space and on the ground. Three were recently identified by in the James Webb Space Telescope’s Cosmic...
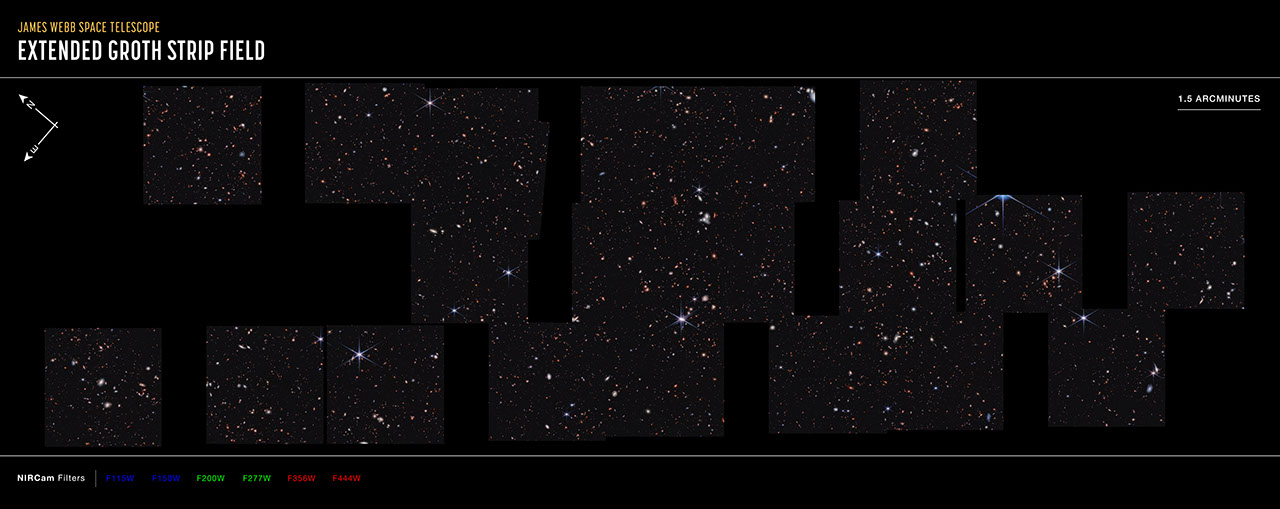
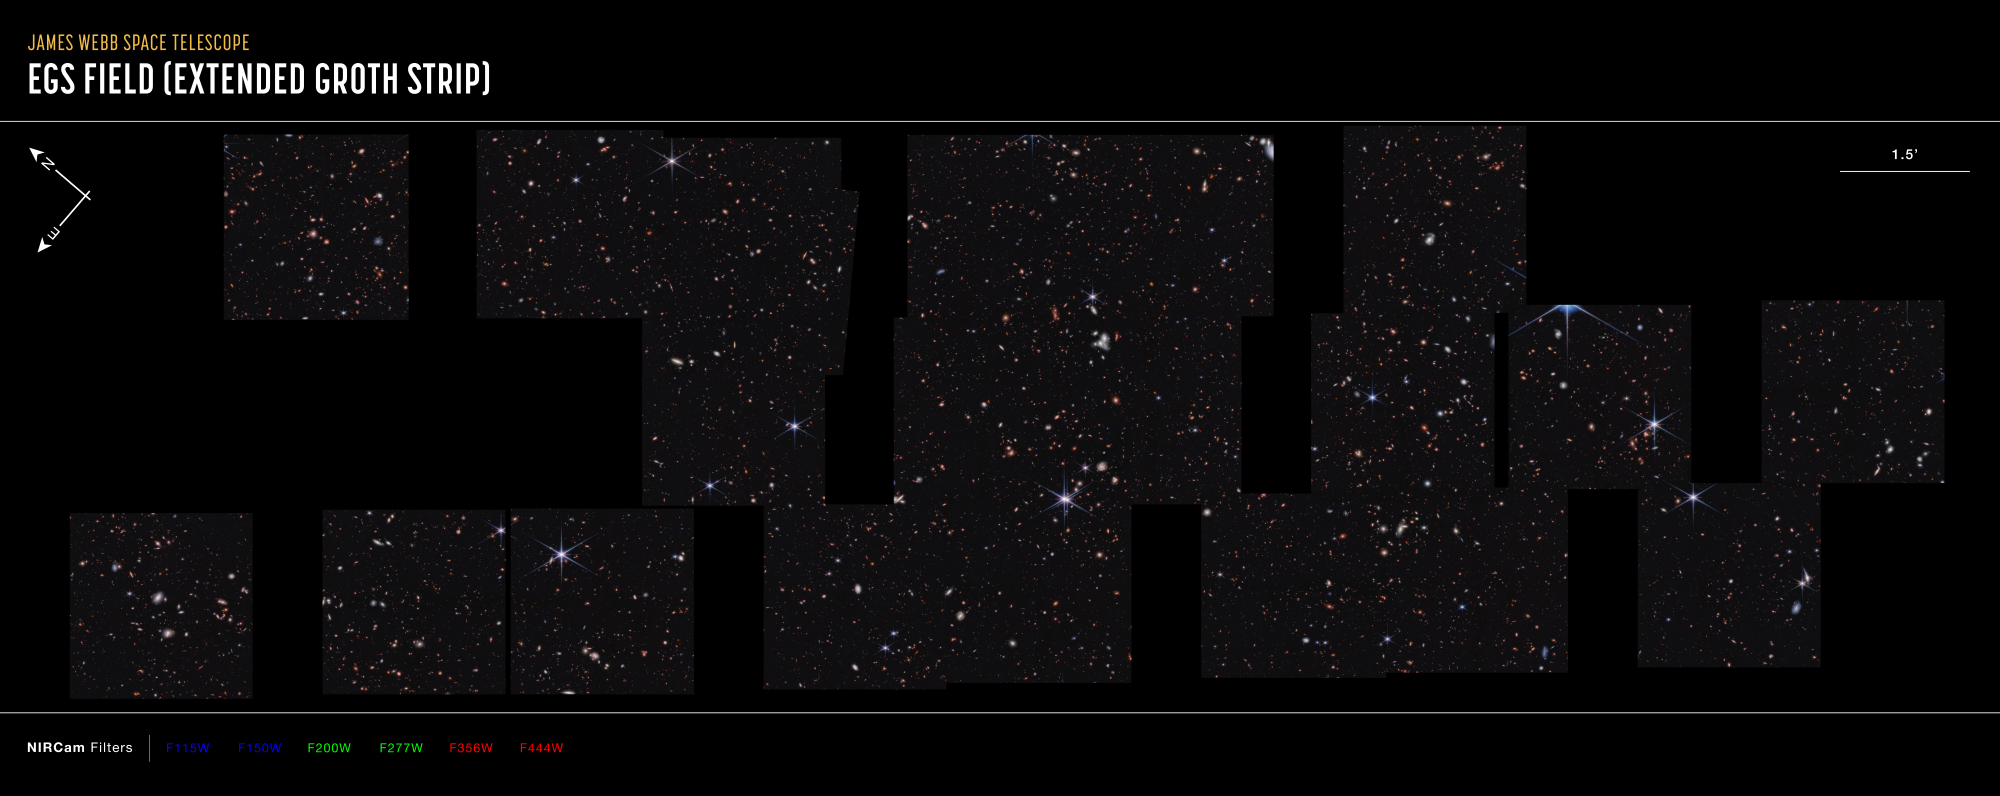
Cosmic Evolution Early Release Science (CEERS) Survey (NIRCam Compass Image)
Ten near-infrared pointings from NIRCam (the Near-Infrared Camera) aboard the James Webb Space Telescope were stitched together to create this mosaic, known as the Cosmic Evolution Early Release Science (CEERS) Survey. These observations are within the same region studied by the...
Share
Details
Laura Betz
NASA’s Goddard Space Flight Center
Greenbelt, Maryland
laura.e.betz@nasa.gov
NASA, ESA, CSA, Steve Finkelstein (UT Austin), Micaela Bagley (UT Austin), Rebecca Larson (UT Austin)
Alyssa Pagan (STScI)


