


1 min read
Exoplanet WASP-96 b (NIRISS Transit Light Curve)
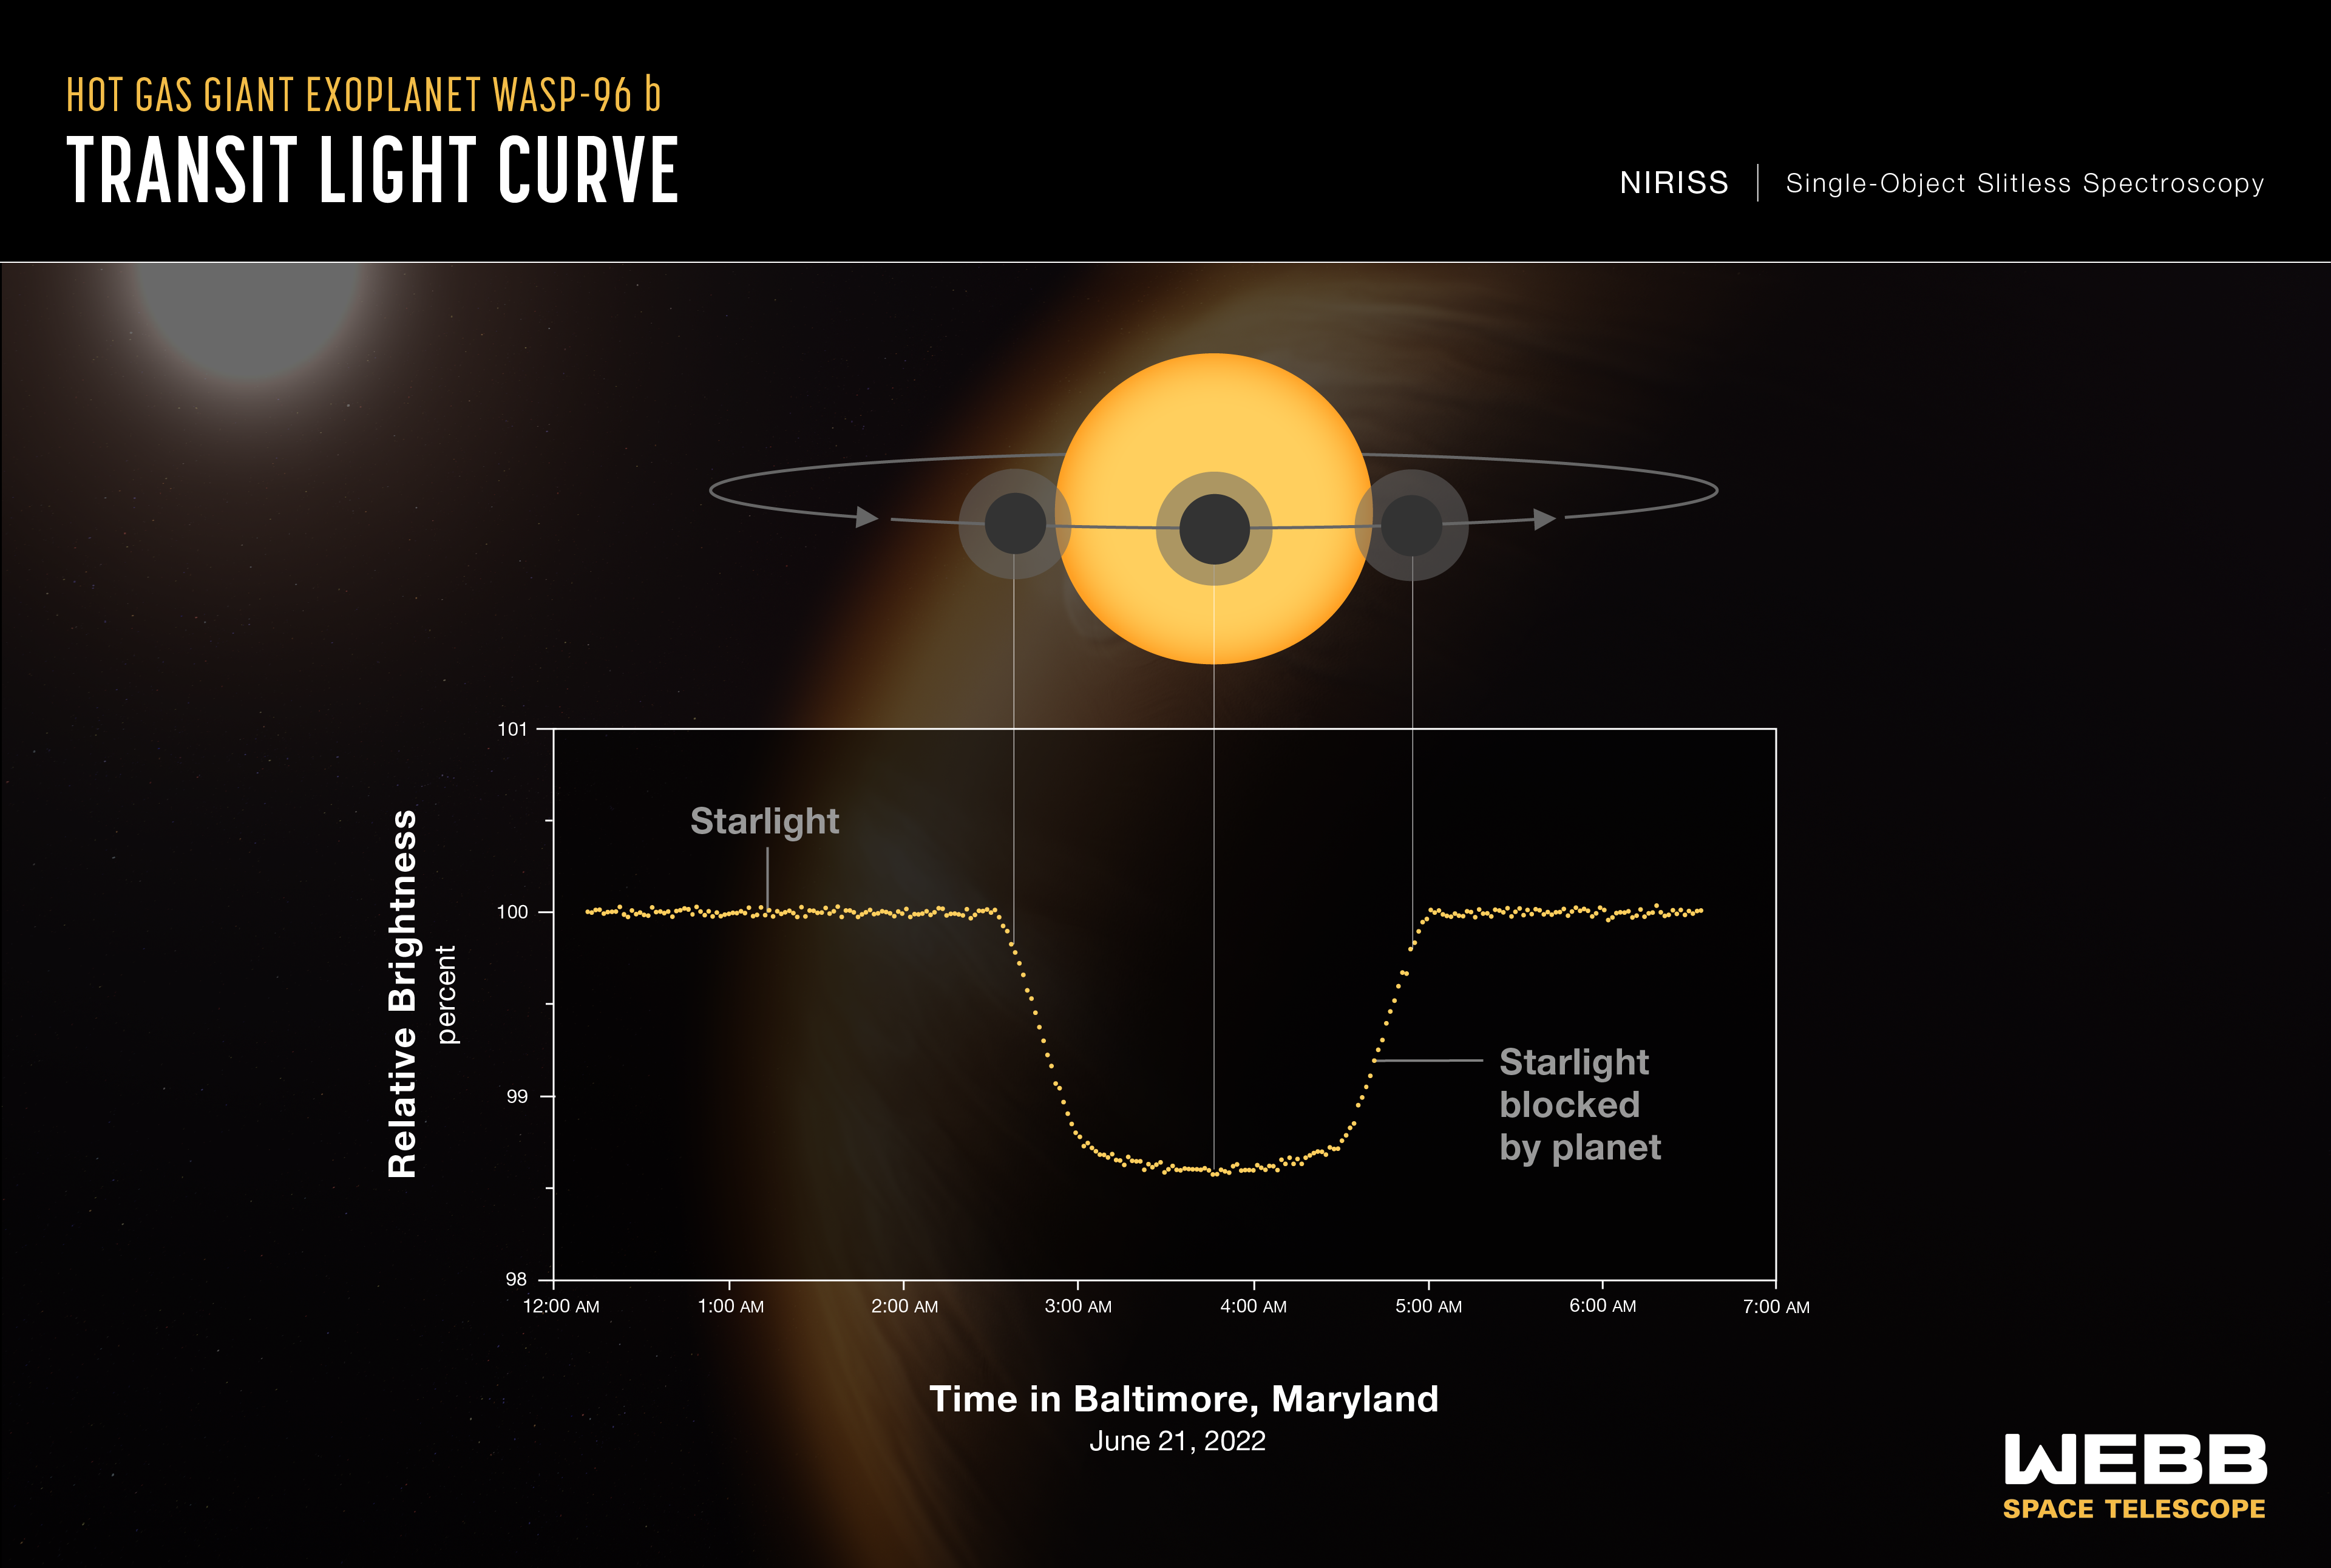
A light curve from Webb’s Near-Infrared Imager and Slitless Spectrograph (NIRISS) shows the change in brightness of light from the WASP-96 star system over time as the planet transits the star. A transit occurs when an orbiting planet moves between the star and the telescope, blocking some of the light from the star. This observation was made using NIRISS’s Single-Object Slitless Spectroscopy (SOSS) mode, which involves capturing the spectrum of a single bright object, like the star WASP-96, in a field of view.
To capture these data, Webb stared at the WASP-96 star system for 6 hours 23 minutes, beginning about 2½ hours before the transit and ending about 1½ hours after the transit was complete. The transit itself lasted for just under 2½ hours. The curve includes a total of 280 individual brightness measurements – one every 1.4 minutes.
Because the observation was made using a spectrograph, which spreads the light out into hundreds of individual wavelengths, each of the 280 points on the graph represents the combined brightness of thousands of wavelengths of infrared light.
The actual dimming caused by the planet is extremely small: The difference between the brightest and dimmest points is less than 1.5 percent. NIRISS is ideally suited for this observation because it has the ability to observe relatively bright targets over time, along with the sensitivity needed to measure such small differences in brightness: In this observation, the instrument was able to measure differences in brightness as small as 0.02 percent.
Although the presence, size, mass, and orbit of the planet had already been determined based on previous transit observations, this transit light curve can be used to confirm and refine existing measurements, such as the planet’s diameter, the timing of the transit, and the planet’s orbital properties.
WASP-96 b is a hot gas giant exoplanet that orbits a Sun-like star roughly 1,150 light-years away, in the constellation Phoenix. The planet orbits extremely close to its star (less than 1/20th the distance between Earth and the Sun) and completes one orbit in less than 3½ Earth-days. The planet’s discovery, from ground-based observations, was announced in 2014.
The background illustration of WASP-96 b and its Sun-like star is based on current understanding of the planet from both NIRISS spectroscopy and previous ground- and space-based observations. Webb has not captured a direct image of the planet or its atmosphere.
NIRISS was contributed by the Canadian Space Agency. The instrument was designed and built by Honeywell in collaboration with the Université de Montréal and the National Research Council Canada.
For a full array of Webb’s first images and spectra, including downloadable files, please visit: https://webbtelescope.org/news/first-images
Extended Description and Image Alt Text
Extended Description
Infographic titled “Hot Gas Giant Exoplanet WASP-96 b Transit Light Curve, NIRISS Single-Object Slitless Spectroscopy.”
The graphic has two parts. At the top is a diagram showing a planet transiting (moving in front of) its star. Below the diagram is a graph showing the change in relative brightness of the star-planet system over time. The diagram and graph are aligned vertically to show the relationship between the geometry of the star-planet system as the planet orbits, and the measurements on the graph.
Diagram
At the center is a bright orange circle representing the star. A gray line looping around the star represents the orbital path of the plant. The line has two arrows pointing counter-clockwise to indicate the direction of motion of the planet. Three dark gray circles surrounded by light gray haloes represent the planet and its thick atmosphere at three different times during the orbit. From left to right: 1) At the beginning of the transit when the planet begins to move in front of the star; 2) in the middle of the transit when the planet is directly in front of the star; and 3) at the end of the transit as the planet ceases to block any part of the star.
Graph
Below the transit diagram is a graph of Relative Brightness in percent on the vertical y-axis versus Time in Baltimore, Maryland, on June 21, 2022 on the horizontal x-axis.
Axes
The y-axis ranges from 98 percent relative brightness at the origin at the bottom to 101 percent at the top, with tick marks every 0.5 percent and labels every 1 percent. The x-axis ranges from 12 o’clock a.m. at the origin on the left to 7 o’clock a.m. at the far right. There are labeled tick marks every hour.
Data
The graph consist of 280 data points that together form a U-shaped valley with flat plains on either side. The curve is almost perfectly symmetrical about the lowest point of the valley. The points are not connected, but are dense enough that they almost appear to be connected.
The first data point is at about 12:10 a.m. and the last is at about 6:30 a.m. There is one data point approximately every 1.4 minutes.
Between the beginning of the curve at 12:10 a.m. and the beginning of the transit at about 2:30 a.m., the relative brightness of the star-planet system remains flat at almost exactly 100%. There is very little variability in brightness from point to point.
Around 2:30 a.m., the brightness begins to decrease at a steady rate. Around 3:00 a.m., it levels off at a relative brightness of about 98.5 percent. The curve continues with a slightly concave-up shape until about 4:30 a.m. when it begins to rise, showing a steady increase in brightness. The rise continues until the end of the transit at about 5:00 a.m. when the brightness levels off again at 100 percent. The curve then remains almost flat, with almost no variability, until the last data point at about 6:30 a.m.
There are two labels on the curve. The flat segment of 100 percent relative brightness to the left of the U-shaped valley is labeled “Starlight.” The U-shaped portion of the curve with brightness less than 100 percent is labeled “Starlight blocked by planet.”
Relationship between the Diagram and Graph
A vertical gray line connects each of the three planet positions in the diagram to the corresponding points on the light curve. From left to right: 1) A small portion of the right side of the planet blocks the star and the relative brightness begins to decrease; 2) the entire planet is in front of the star and the relative brightness is at its lowest point (the center of the U-shaped valley); 3) a small portion of the left side of the planet is blocking the star and the relative brightness is almost back up to 100 percent.
Background
In the background of the graphic is an illustration of the planet and its star. The planet has a thick fuzzy orangish atmosphere with hints of cloud formations. The star is bright yellowish-white.
Image Alt Text
Transit light curve of hot gas giant exoplanet WASP-96 b showing the change in brightness of the star-planet system as the planet moves in front of the star.
About the Object
- R.A. PositionR.A. PositionRight ascension – analogous to longitude – is one component of an object's position.00:04:11.18
- Dec. PositionDec. PositionDeclination – analogous to latitude – is one component of an object's position.-47:21:38.29
- ConstellationConstellationOne of 88 recognized regions of the celestial sphere in which the object appears.Phoenix
- DistanceDistanceThe physical distance from Earth to the astronomical object. Distances within our solar system are usually measured in Astronomical Units (AU). Distances between stars are usually measured in light-years. Interstellar distances can also be measured in parsecs.350 parsecs (1.150 light-years)
- DimensionsDimensionsThe physical size of the object or the apparent angle it subtends on the sky.1.2 times the radius of Jupiter (13.5 times the radius of Earth) 0.48 times the mass of Jupiter (153 times mass of Earth)
About the Data
- Data DescriptionData DescriptionProposal: A description of the observations, their scientific justification, and the links to the data available in the science archive.
Science Team: The astronomers who planned the observations and analyzed the data. "PI" refers to the Principal Investigator.This image was created with Webb data from proposal 2734. It is part of Webb Early Release Observations.
The Early Release Observations and associated materials were developed, executed, and compiled by the ERO production team:
Jaclyn Barrientes, Claire Blome, Hannah Braun, Matthew Brown, Margaret Carruthers, Dan Coe, Joseph DePasquale, Nestor Espinoza, Macarena Garcia Marin, Karl Gordon, Alaina Henry, Leah Hustak, Andi James, Ann Jenkins, Anton Koekemoer, Stephanie LaMassa, David Law, Alexandra Lockwood, Amaya Moro-Martin, Susan Mullally, Alyssa Pagan, Dani Player, Klaus Pontoppidan, Charles Proffitt, Christine Pulliam, Leah Ramsay, Swara Ravindranath, Neill Reid, Massimo Robberto, Elena Sabbi, Leonardo Ubeda.
The EROs were also made possible by the foundational efforts and support from the JWST instruments, STScI planning and scheduling, Data Management teams, and Office of Public Outreach.
- InstrumentInstrumentThe science instrument used to produce the data.Near-Infrared Imager and Slitless Spectrograph (NIRISS), time-series Single-Object Slitless Spectroscopy (SOSS) mode
- Exposure DatesExposure DatesThe date(s) that the telescope made its observations and the total exposure time.June 21, 2022 (6.4-hour observation)
- Object NameObject NameA name or catalog number that astronomers use to identify an astronomical object.WASP-96 b
- Object DescriptionObject DescriptionThe type of astronomical object.Hot Gas Giant Exoplanet
- Release DateJuly 12, 2022
- Science ReleaseNASA’s Webb Reveals Steamy Atmosphere of Distant Planet in Detail
- CreditIllustration: NASA, ESA, CSA, STScI
Related Images & Videos
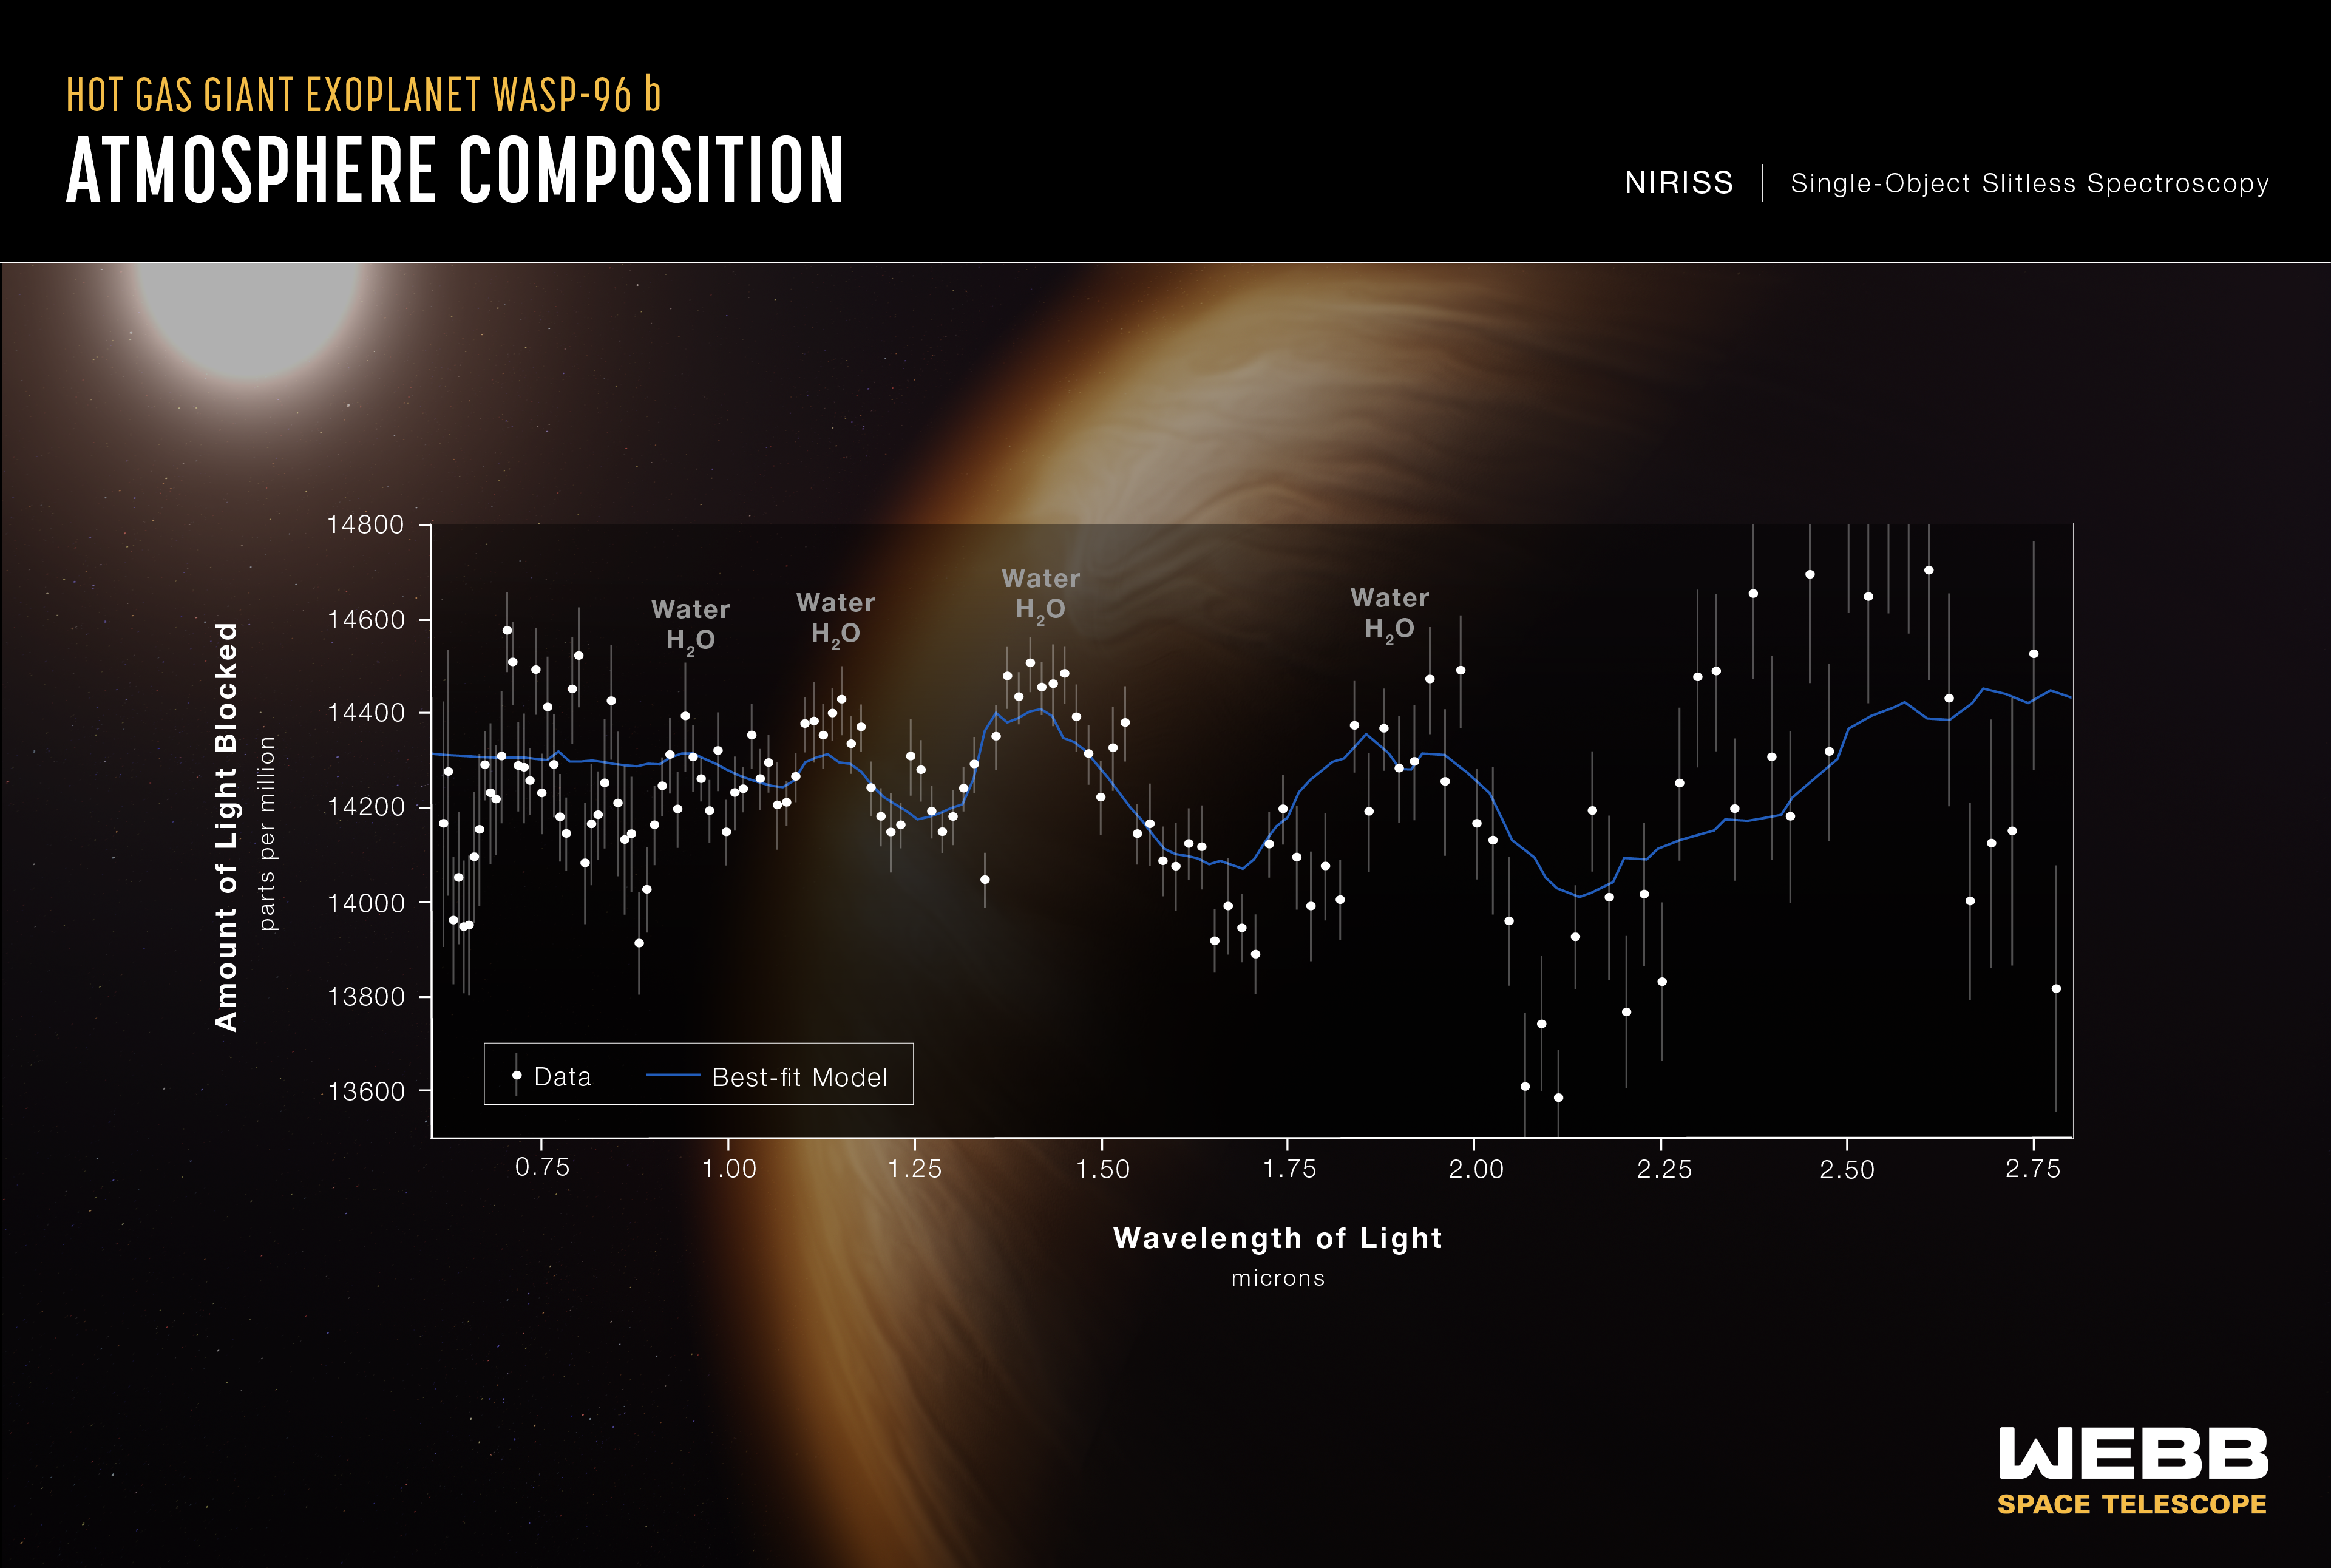
Exoplanet WASP-96 b (NIRISS Transmission Spectrum)
A transmission spectrum made from a single observation using Webb’s Near-Infrared Imager and Slitless Spectrograph (NIRISS) reveals atmospheric characteristics of the hot gas giant exoplanet WASP-96 b. A transmission spectrum is made by comparing starlight filtered through a...
Share
Details
Laura Betz
NASA’s Goddard Space Flight Center
Greenbelt, Maryland
laura.e.betz@nasa.gov
NASA, ESA, CSA, STScI


