


1 min read
Exoplanet WASP-96 b (NIRISS Transmission Spectrum)
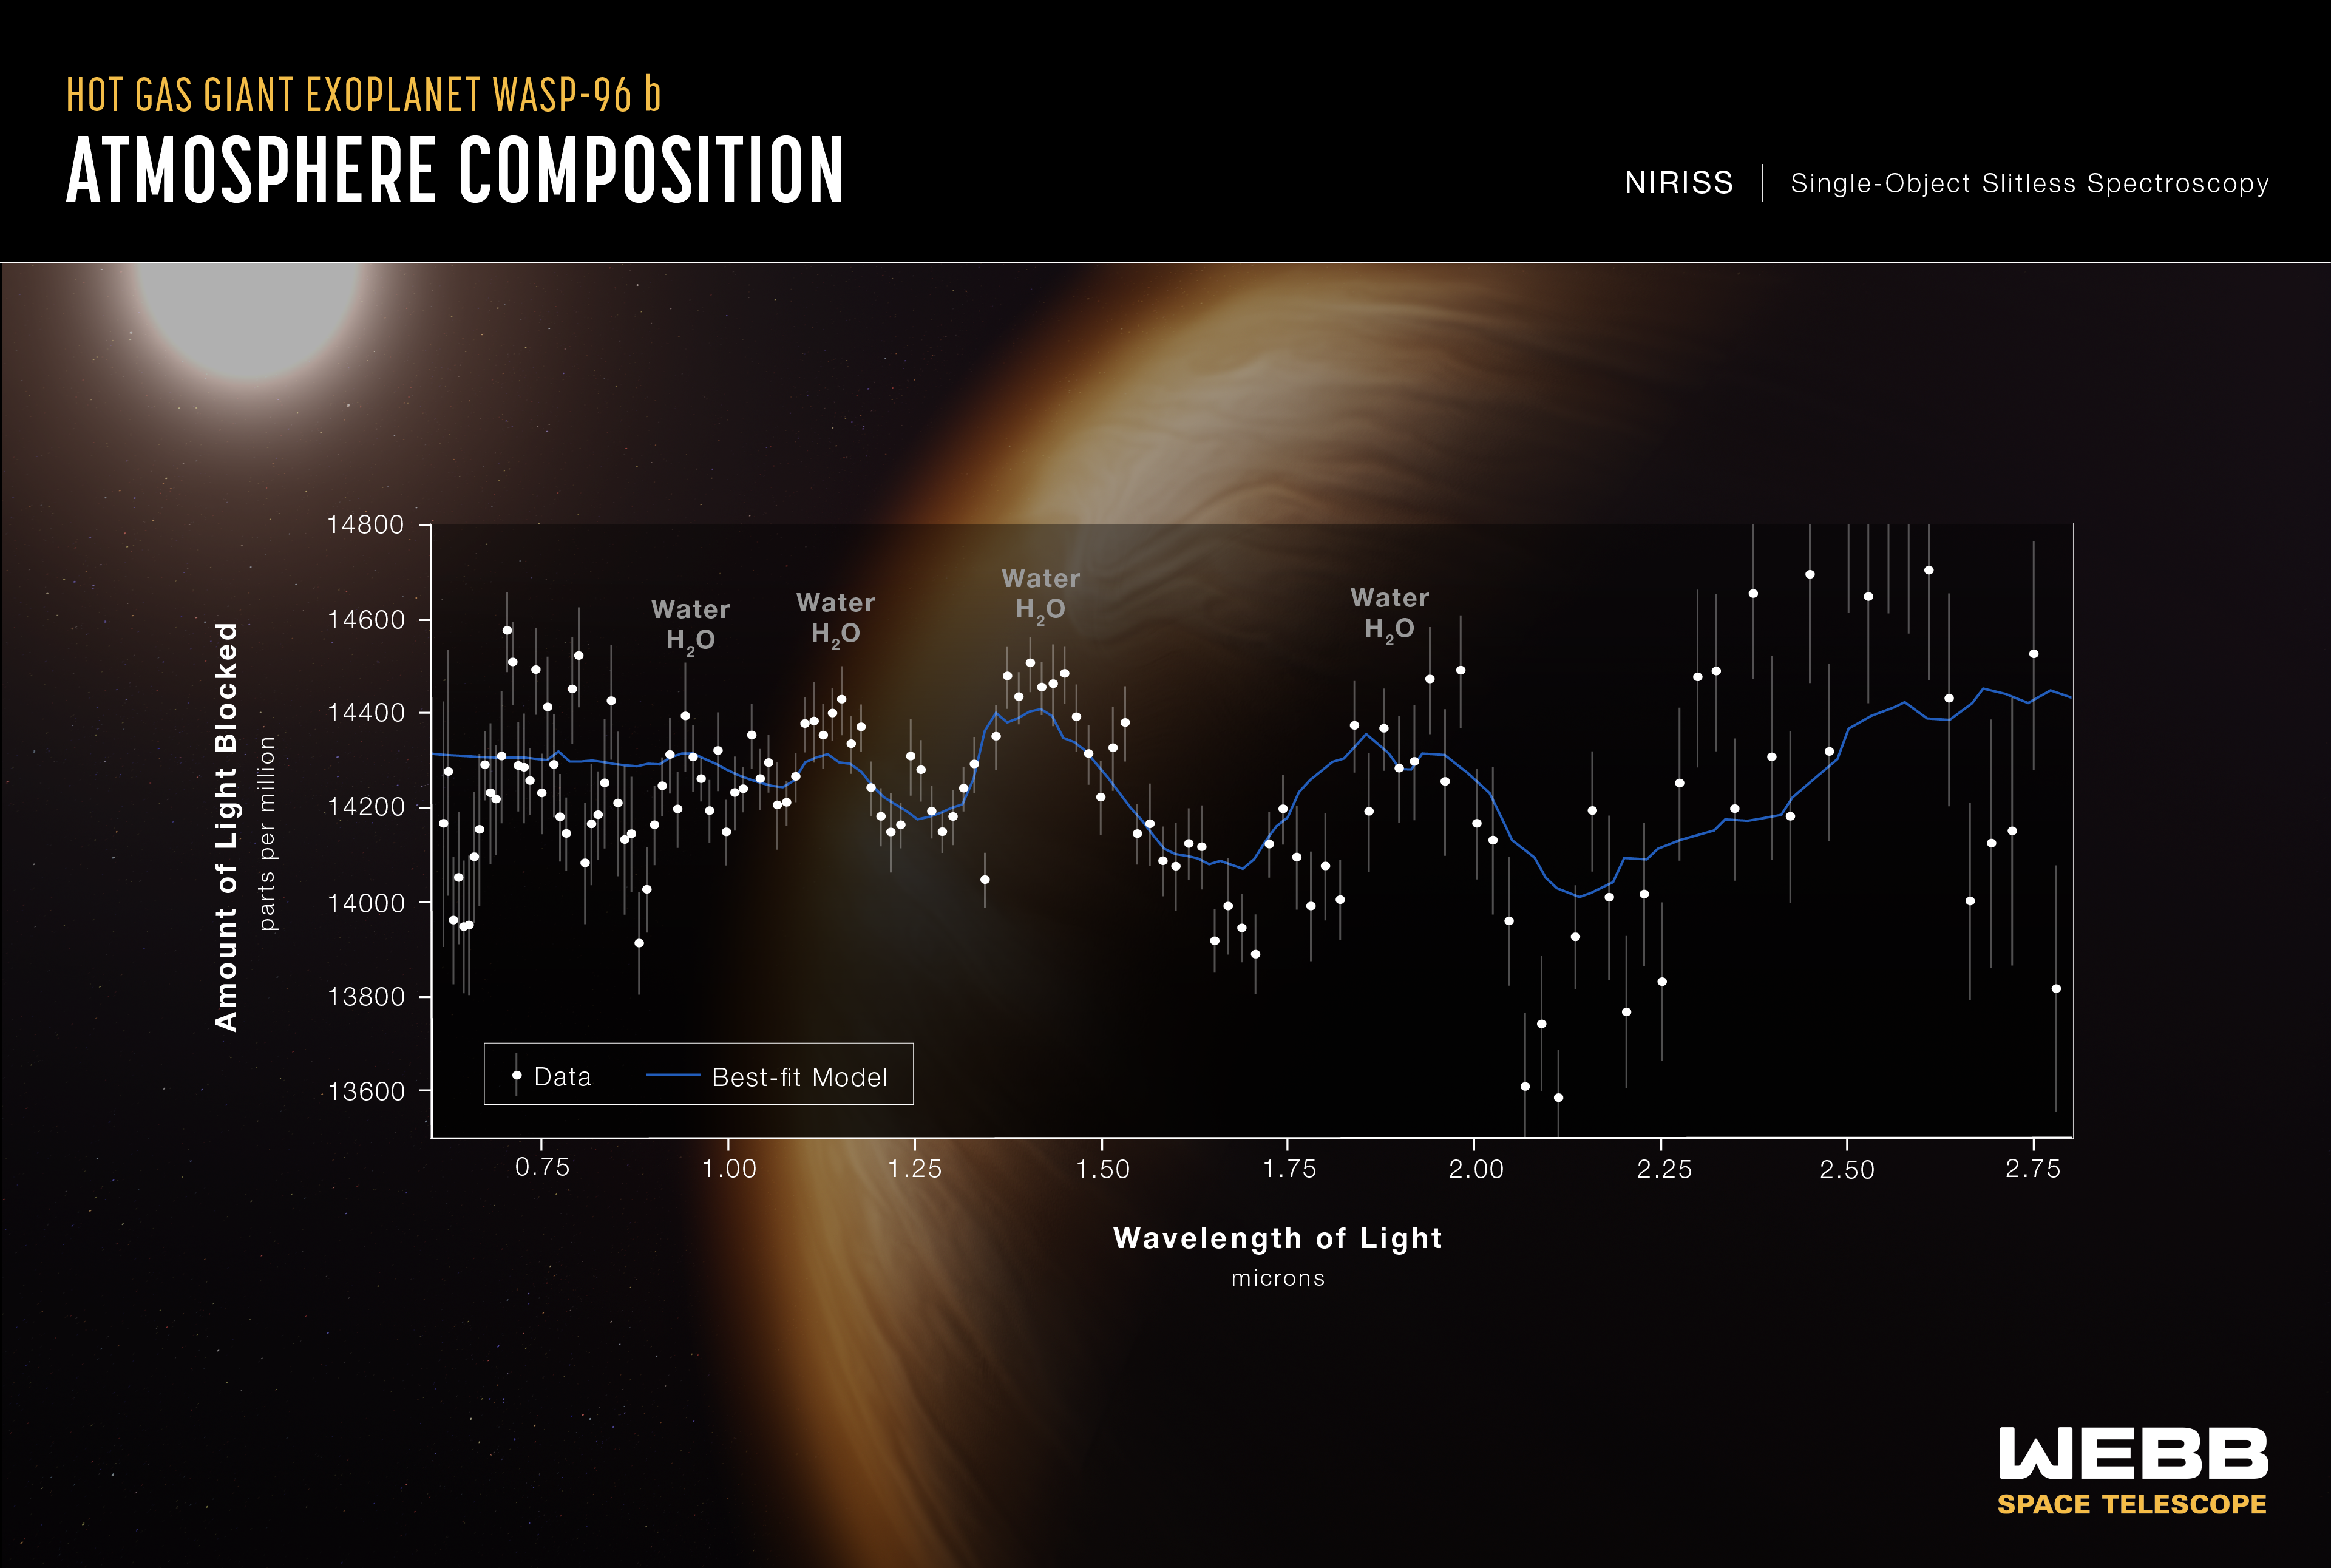
A transmission spectrum made from a single observation using Webb’s Near-Infrared Imager and Slitless Spectrograph (NIRISS) reveals atmospheric characteristics of the hot gas giant exoplanet WASP-96 b.
A transmission spectrum is made by comparing starlight filtered through a planet’s atmosphere as it moves across the star, to the unfiltered starlight detected when the planet is beside the star. Each of the 141 data points (white circles) on this graph represents the amount of a specific wavelength of light that is blocked by the planet and absorbed by its atmosphere.
In this observation, the wavelengths detected by NIRISS range from 0.6 microns (red) to 2.8 microns (in the near-infrared). The amount of starlight blocked ranges from about 13,600 parts per million (1.36 percent) to 14,700 parts per million (1.47 percent).
Researchers are able to detect and measure the abundances of key gases in a planet’s atmosphere based on the absorption pattern – the locations and heights of peaks on the graph: each gas has a characteristic set of wavelengths that it absorbs. The temperature of the atmosphere can be calculated based in part on the height of the peaks: a hotter planet has taller peaks. Other characteristics, like the presence of haze and clouds, can be inferred based on the overall shape of different portions of the spectrum.
The gray lines extending above and below each data point are error bars that show the uncertainty of each measurement, or the reasonable range of actual possible values. For a single observation, the error on these measurements is remarkably small.
The blue line is a best-fit model that takes into account the data, the known properties of WASP-96 b and its star (e.g., size, mass, temperature), and assumed characteristics of the atmosphere. Researchers can vary the parameters in the model – changing unknown characteristics like cloud height in the atmosphere and abundances of various gases – to get a better fit and further understand what the atmosphere is really like. The difference between the best-fit model shown here and the data simply reflects the additional work to be done in analyzing and interpreting the data and the planet.
Although full analysis of the spectrum will take additional time, it is possible to draw a number of preliminary conclusions. The labeled peaks in the spectrum indicate the presence of water vapor. The height of the water peaks, which is less than expected based on previous observations, is evidence for the presence of clouds that suppress the water vapor features. The gradual downward slope of the left side of the spectrum (shorter wavelengths) is indicative of possible haze. The height of the peaks along with other characteristics of the spectrum is used to calculate an atmospheric temperature of about 1350°F (725°C).
This is the most detailed infrared exoplanet transmission spectrum ever collected, the first transmission spectrum that includes wavelengths longer than 1.6 microns with such high resolution and accuracy, and the first to cover the entire wavelength range from 0.6 microns (visible red light) to 2.8 microns (near-infrared) in a single shot. The speed with which researchers have been able to make confident interpretations of the spectrum is further testament to the quality of the data.
The observation was made using NIRISS’s Single-Object Slitless Spectroscopy (SOSS) mode, which involves capturing the spectrum of a single bright object, like the star WASP-96, in a field of view.
WASP-96 b is a hot gas giant exoplanet that orbits a Sun-like star roughly 1,150 light-years away, in the constellation Phoenix. The planet orbits extremely close to its star (less than 1/20th the distance between Earth and the Sun) and completes one orbit in less than 3½ Earth-days. The planet’s discovery, based on ground-based observations, was announced in 2014. The star, WASP-96, is somewhat older than the Sun, but is about the same size, mass, temperature, and color.
The background illustration of WASP-96 b and its star is based on current understanding of the planet from both NIRISS spectroscopy and previous ground- and space-based observations. Webb has not captured a direct image of the planet or its atmosphere.
NIRISS was contributed by the Canadian Space Agency. The instrument was designed and built by Honeywell in collaboration with the Université de Montréal and the National Research Council Canada.
For a full array of Webb’s first images and spectra, including downloadable files, please visit: https://webbtelescope.org/news/first-images
Extended Description and Image Alt Text
Extended Description
Graphic titled “Hot Gas Giant Exoplanet WASP-96 b Atmosphere Composition, NIRISS Single-Object Slitless Spectroscopy.”
The graphic shows a transmission spectrum in the form of a graph of the Amount of Light Blocked by the planet’s atmosphere in parts per million on the vertical y-axis versus Wavelength of Light in microns on the horizontal x-axis.
Graph
Axes
The y-axis ranges from 13,500 parts per million (less light blocked) at the bottom to 14,800 parts per million (more light blocked) at the top, with labeled tick marks are labeled every 200 parts per million, starting at 13,600.
The x-axis ranges from 0.6 microns on the left to 2.8 microns on the right, with labeled tick marks every 0.25 microns, starting at 0.75 microns.
Key
The graph includes a key showing that the solid white circles centered on gray vertical lines represent data points, and a blue solid line represents a best-fit model.
Data and Model
The graph consists of 141 data points, each with a gray error bar. The points range in value from 13,589 to 14,883 parts per million. The data points are not connected. They follow a jagged trend from left to right, with a number of broad peaks and valleys. The lengths of the error bars vary from a minimum of plus or minus 43 to a maximum of plus or minus 314. The error bars are smallest between about 1 and 1.3 microns, generally increasing in length toward the left from 1 to 0.6 microns, and toward the right from about 1.3 to 2.8 microns.
A solid blue line with several prominent peaks and valleys represents the best-fit model. The model begins at the far left with a very slight downward slope toward the right with a small peak around 0.95 microns, and another peak at about 1.15 microns. The line then becomes more sinuous, forming a taller, broader peak centered at about 1.4 microns and a slightly shorter broad peak at 1.9 microns. Starting around 2.15 microns, the line trends back upward with a wavy slope of about 30 degrees.
The blue best-fit model line generally follows the trend of the data. It intersects some data points, but does not match the data perfectly. The match between the model and data is clearest between about 0.9 and 1.65 microns.
The four most prominent peaks, which are visible in both the data and the model, are labeled “Water, H2O.”
Background
In the background of the graphic is an illustration of the planet and its star. The planet has a fuzzy orangish atmosphere with hints of cloud formations below. The star is bright yellowish-white.
Image Alt Text
Transmission spectrum of the hot gas giant exoplanet WASP-96 b captured using Webb's NIRISS Single-Object Slitless Spectroscopy with an illustration of the planet and its star in the background.
About the Object
- R.A. PositionR.A. PositionRight ascension – analogous to longitude – is one component of an object's position.00:04:11.18
- Dec. PositionDec. PositionDeclination – analogous to latitude – is one component of an object's position.-47:21:38.29
- ConstellationConstellationOne of 88 recognized regions of the celestial sphere in which the object appears.Phoenix
- DistanceDistanceThe physical distance from Earth to the astronomical object. Distances within our solar system are usually measured in Astronomical Units (AU). Distances between stars are usually measured in light-years. Interstellar distances can also be measured in parsecs.350 parsecs (1,150 light-years)
- DimensionsDimensionsThe physical size of the object or the apparent angle it subtends on the sky.1.2 times the radius of Jupiter (13.5 times the radius of Earth)0.48 times the mass of Jupiter (153 times mass of Earth)
About the Data
- Data DescriptionData DescriptionProposal: A description of the observations, their scientific justification, and the links to the data available in the science archive.
Science Team: The astronomers who planned the observations and analyzed the data. "PI" refers to the Principal Investigator.This image was created with Webb data from proposal 2734. It is part of Webb Early Release Observations.
The Early Release Observations and associated materials were developed, executed, and compiled by the ERO production team:
Jaclyn Barrientes, Claire Blome, Hannah Braun, Matthew Brown, Margaret Carruthers, Dan Coe, Joseph DePasquale, Nestor Espinoza, Macarena Garcia Marin, Karl Gordon, Alaina Henry, Leah Hustak, Andi James, Ann Jenkins, Anton Koekemoer, Stephanie LaMassa, David Law, Alexandra Lockwood, Amaya Moro-Martin, Susan Mullally, Alyssa Pagan, Dani Player, Klaus Pontoppidan, Charles Proffitt, Christine Pulliam, Leah Ramsay, Swara Ravindranath, Neill Reid, Massimo Robberto, Elena Sabbi, Leonardo Ubeda.
The EROs were also made possible by the foundational efforts and support from the JWST instruments, STScI planning and scheduling, Data Management teams, and Office of Public Outreach.
- InstrumentInstrumentThe science instrument used to produce the data.Near-Infrared Imager and Slitless Spectrograph (NIRISS), time-series Single-Object Slitless Spectroscopy (SOSS) mode
- Exposure DatesExposure DatesThe date(s) that the telescope made its observations and the total exposure time.June 21, 2022 (6.4-hour observation time)
- Object NameObject NameA name or catalog number that astronomers use to identify an astronomical object.WASP-96 b
- Object DescriptionObject DescriptionThe type of astronomical object.Hot Gas Giant Exoplanet
- Release DateJuly 12, 2022
- Science ReleaseNASA’s Webb Reveals Steamy Atmosphere of Distant Planet in Detail
- CreditIllustration: NASA, ESA, CSA, STScI
Related Images & Videos
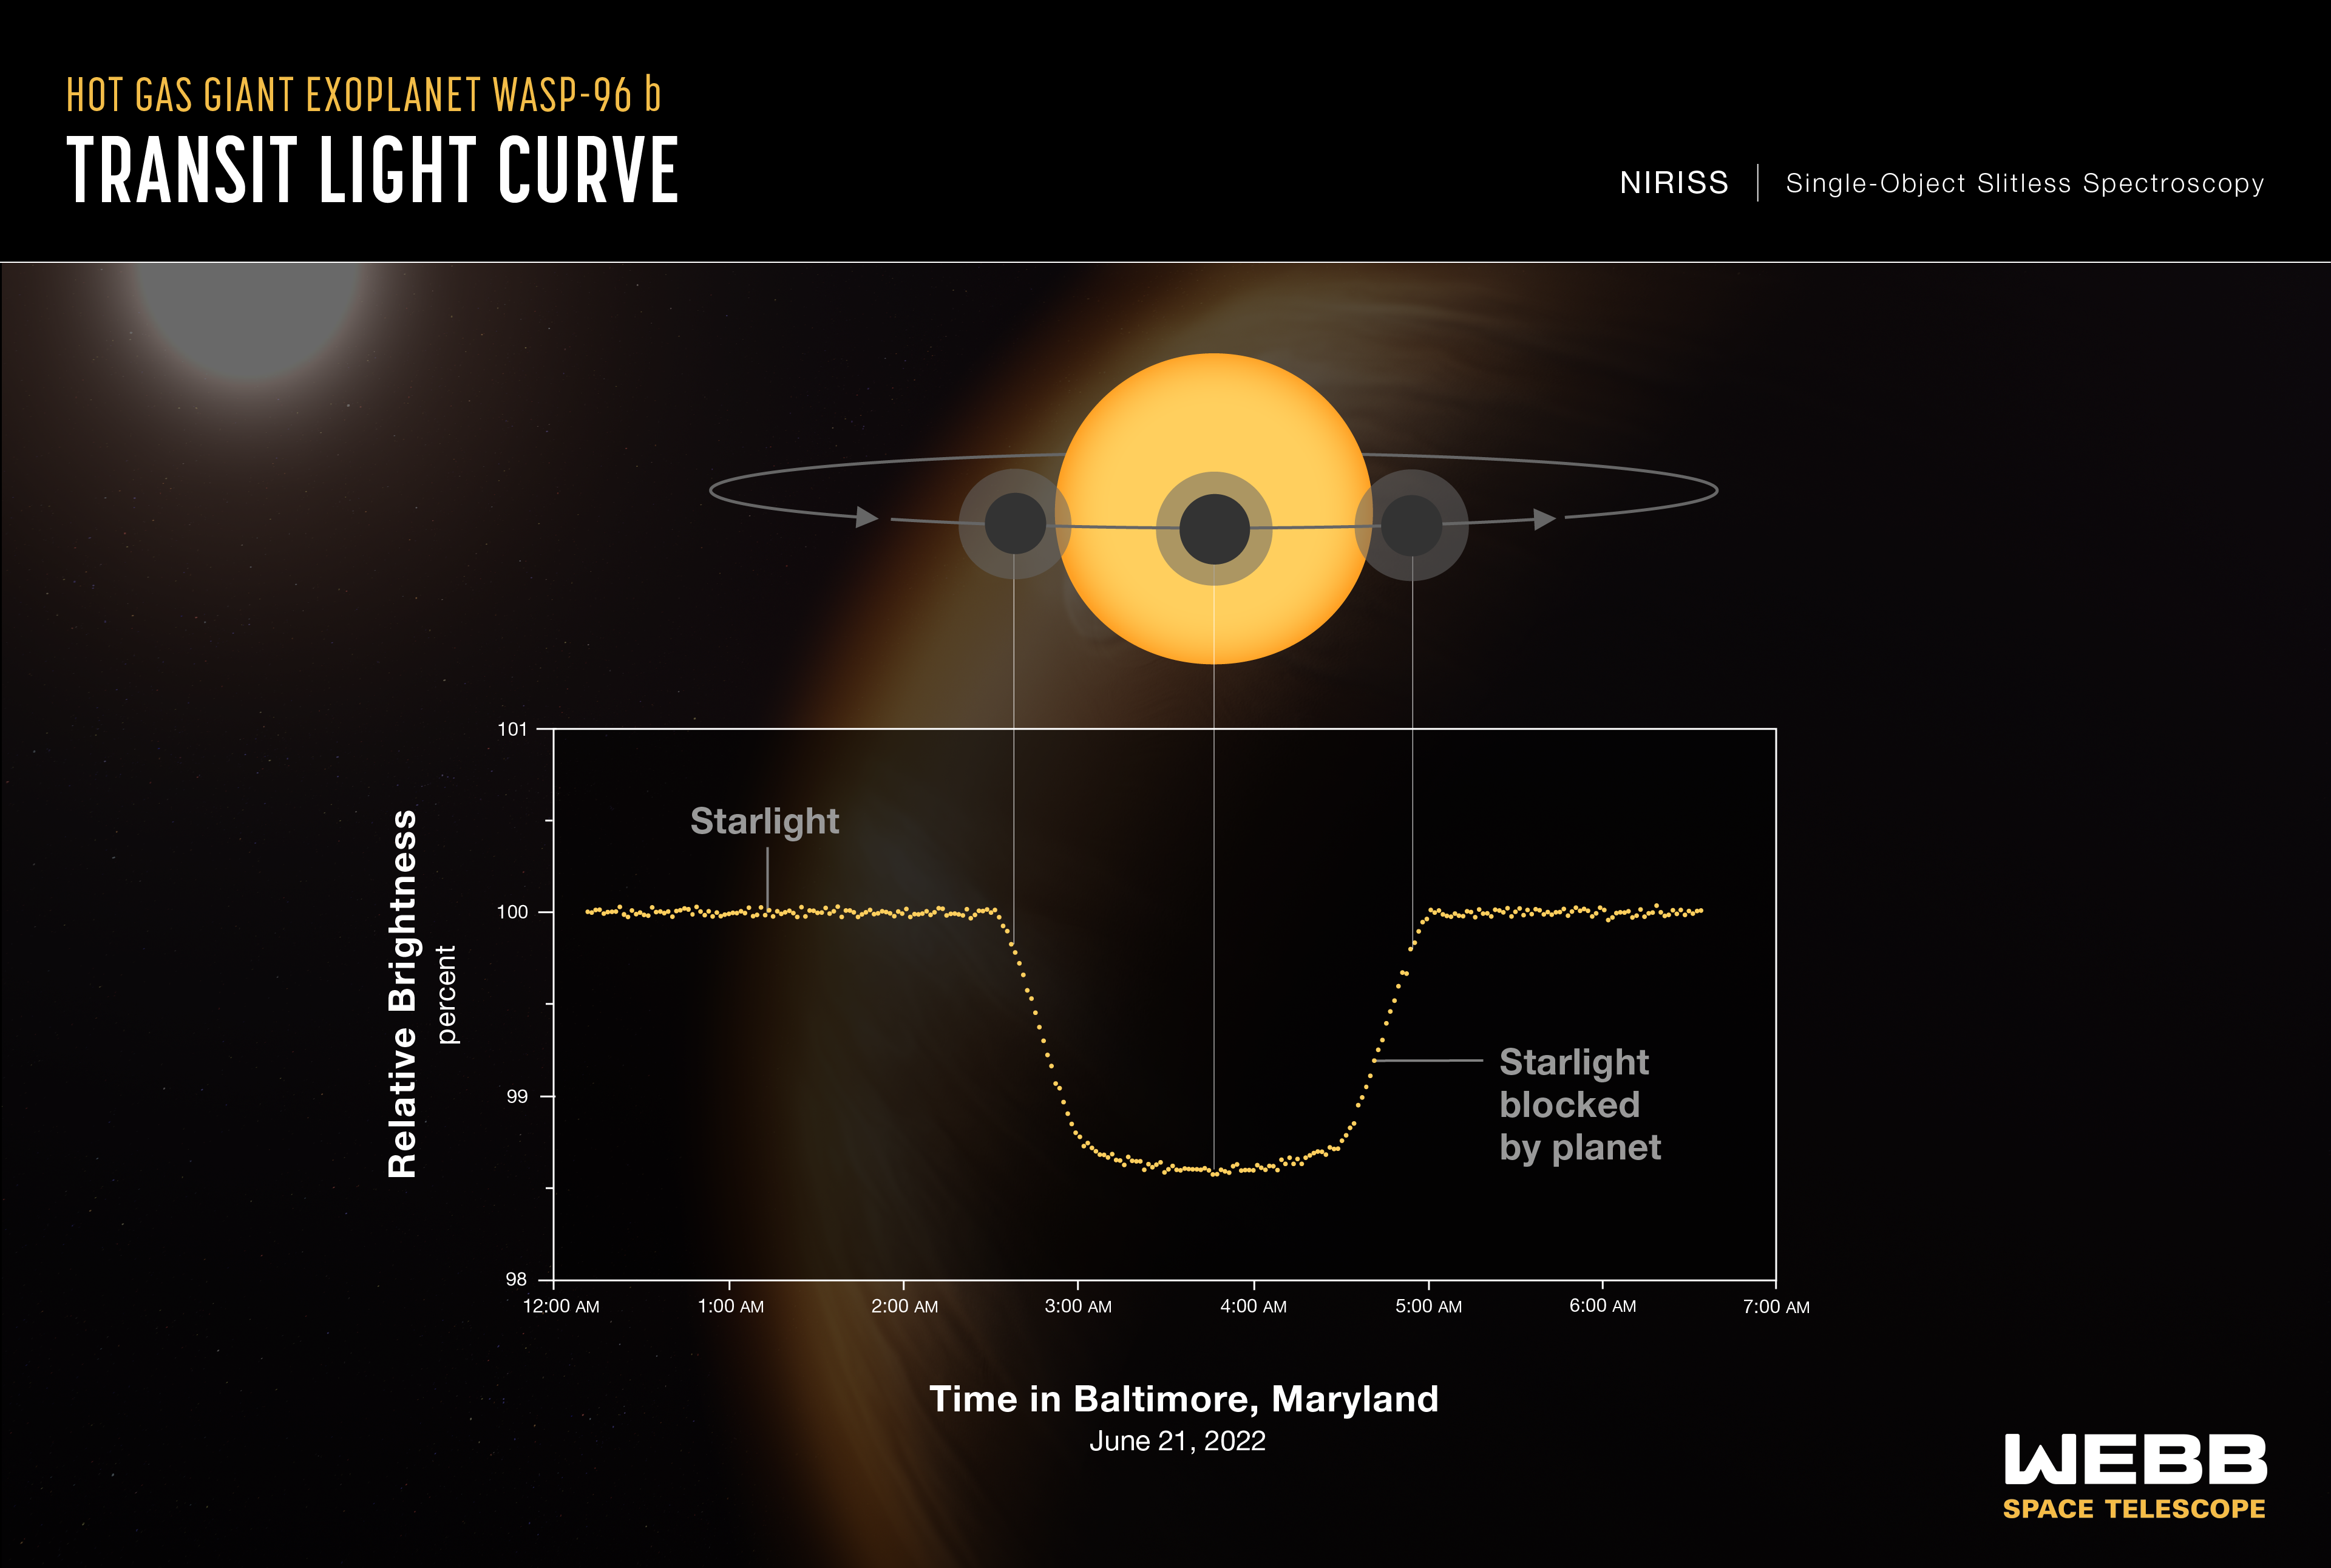
Exoplanet WASP-96 b (NIRISS Transit Light Curve)
A light curve from Webb’s Near-Infrared Imager and Slitless Spectrograph (NIRISS) shows the change in brightness of light from the WASP-96 star system over time as the planet transits the star. A transit occurs when an orbiting planet moves between the star and the telescope,...
Share
Details
Laura Betz
NASA’s Goddard Space Flight Center
Greenbelt, Maryland
laura.e.betz@nasa.gov
NASA, ESA, CSA, STScI


