Suggested Searches

1 min read

Galaxy CEERS 4233-42232: Comparison With Quasar Spectrum  

Infographic titled Galaxy CEERS 4233-42232, comparison with quasar spectrum.  Text at top right reads NIRSpec, Multi-Object Spectroscopy. Vertical Y axis of graph is labeled Brightness, more with an arrow pointing up and less with an arrow pointing down. Horizontal X axis is labeled Velocity of Gas (miles/second) in increments of one thousand starting with negative 4,000 on the left to 4,000 on the right. The spectrum of the galaxy is shown with a white line that peaks sharply at zero. The spectrum of the quasar example is shown with a dashed blue line that also peaks at zero, but with less brightness and a broader base that begins to increase in brightness at negative 1,000 miles per second the  and declines to at about 1,500 miles per second.

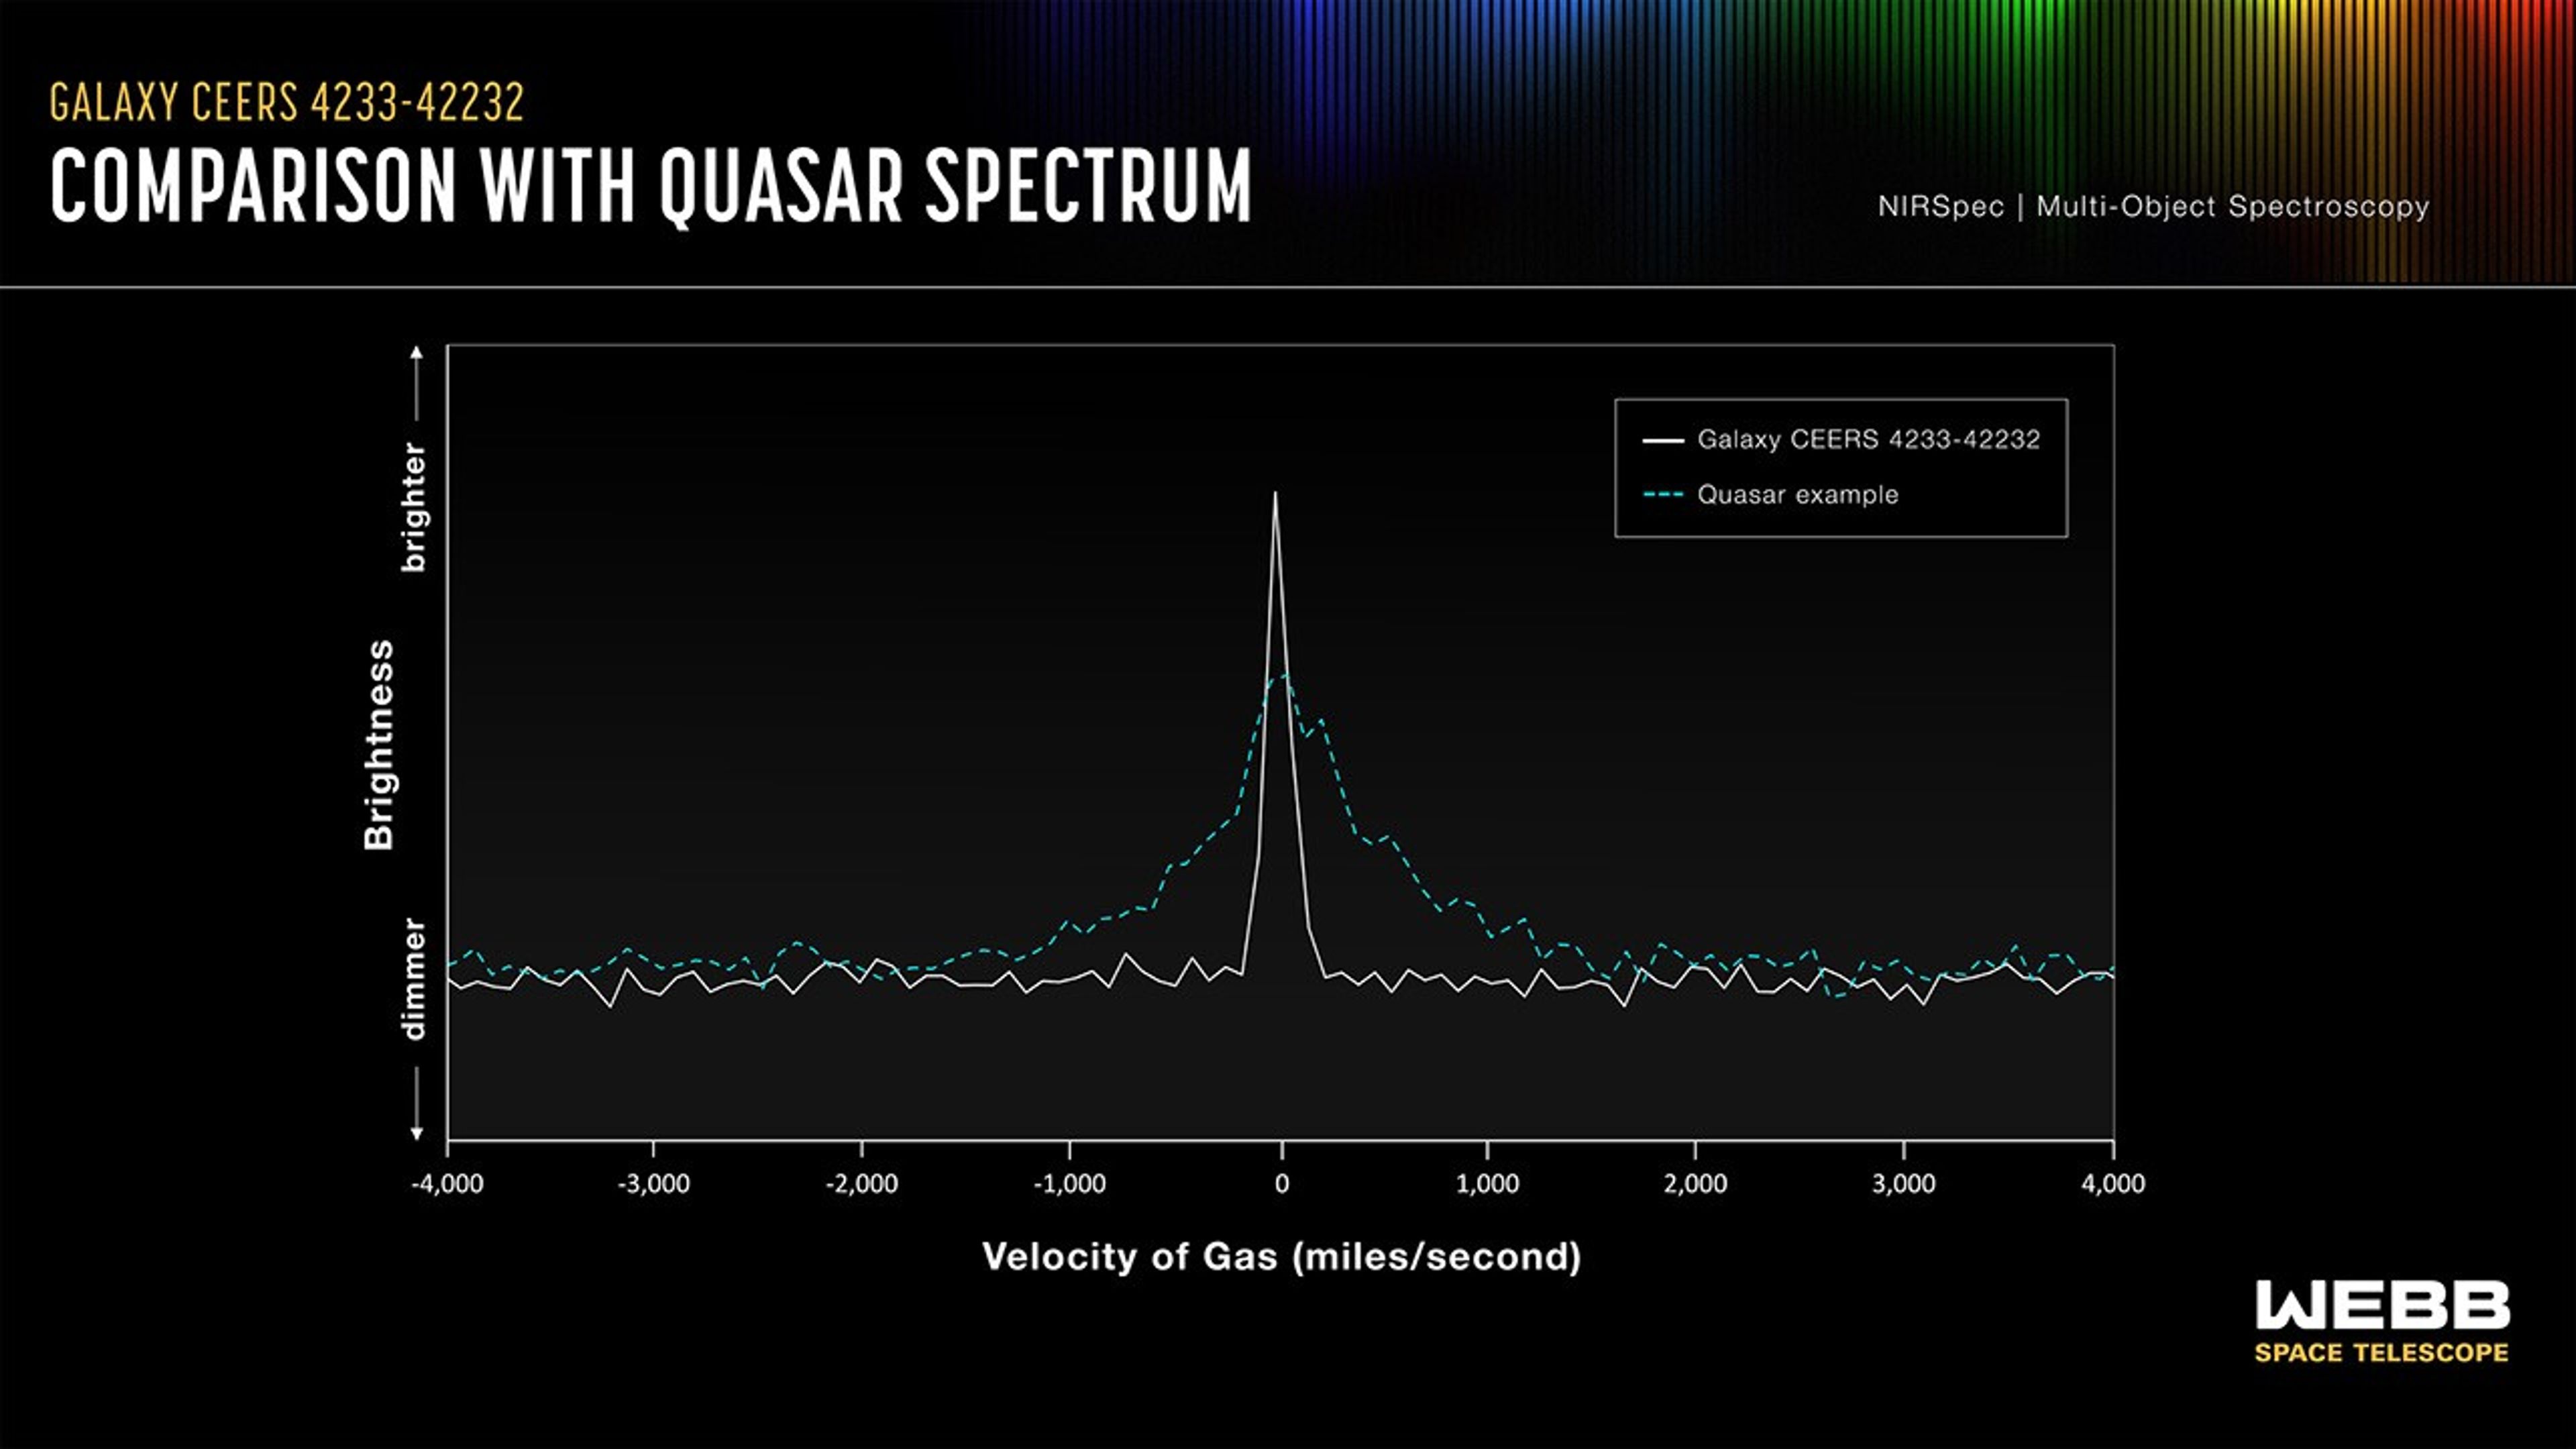
This graphic illustrates the pronounced narrow peak of the spectra that caught researchers’ attention in a small sample of galaxies, represented here by the galaxy CEERS 4233-42232. It is the combination of a narrower-than-expected spectra, along with a tiny, point-like appearance, that makes these galaxies stand out. Typically, distant point-like light sources are quasars, but quasar spectra have a much broader shape. 

  • Release Date
    January 6, 2026
  • Science Release
    Scientists Identify ‘Astronomy’s Platypus’ with NASA’s Webb Telescope
  • Credit
    Illustration: NASA, ESA, CSA, Joseph Olmsted (STScI)

Downloads

  • Full res (For Display), 3840 × 2160
    jpg (557.64 KB)
  • Full res (For Print), 3840 × 2160
    tif (6.01 MB)
  • For Display (Half Res), 1920 × 1080
    jpg (200.67 KB)

Share

Details

Last Updated
Jan 06, 2026
Contact
Media

Laura Betz
NASA’s Goddard Space Flight Center
Greenbelt, Maryland
laura.e.betz@nasa.gov