


1 min read
Galaxy Protocluster (NIRCam Image)
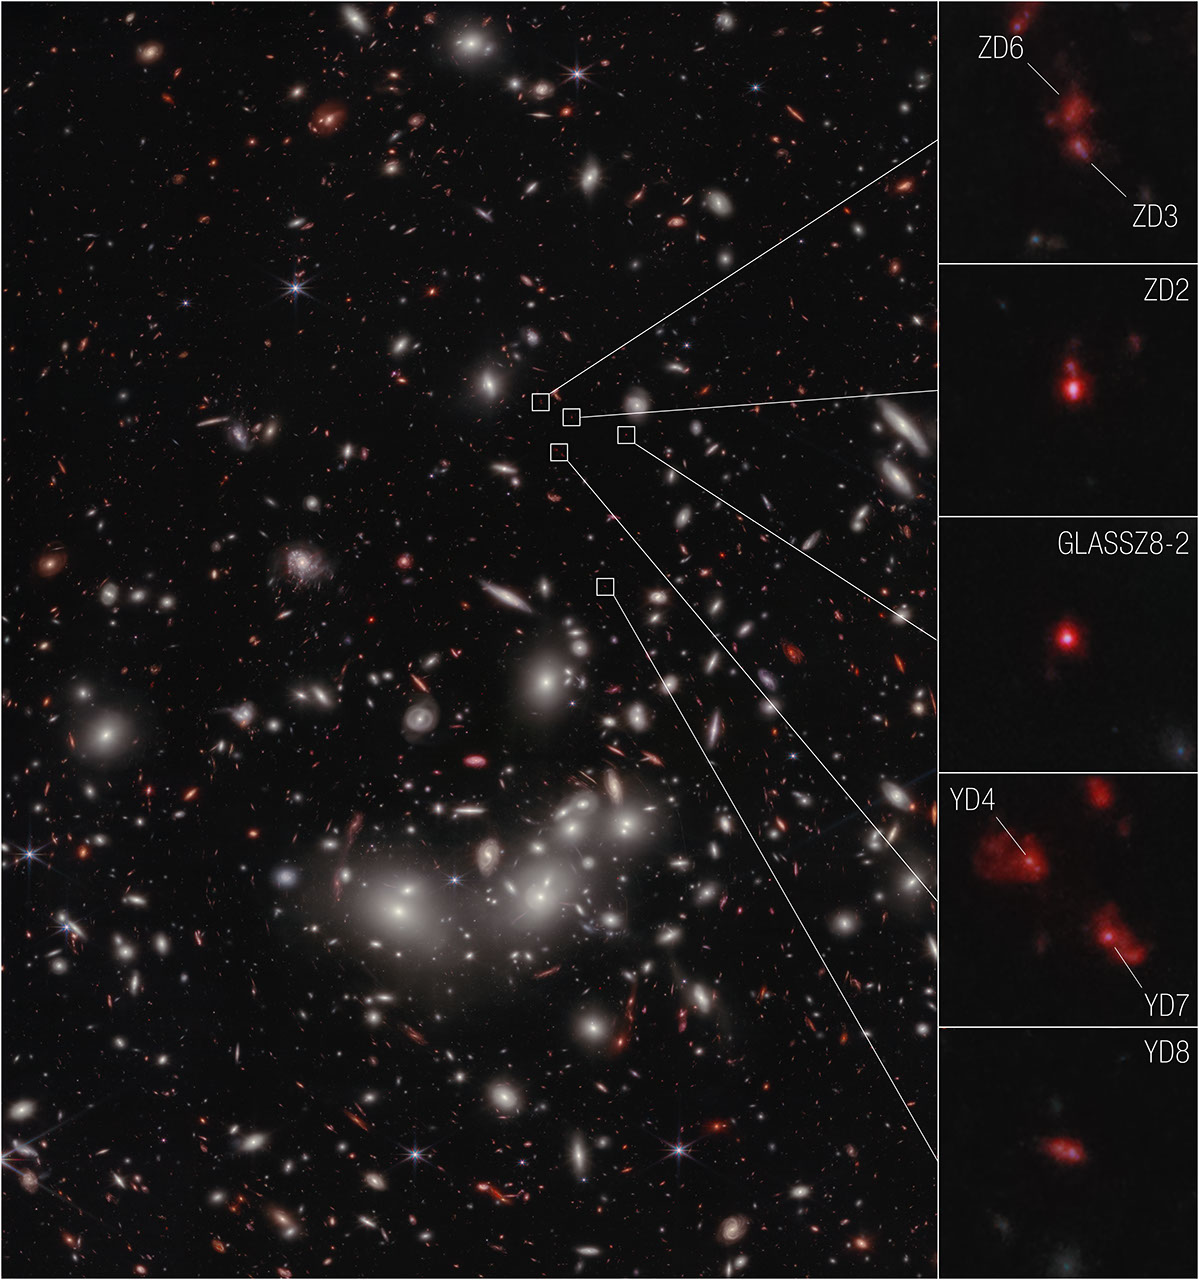
The seven galaxies highlighted in this James Webb Space Telescope image have been confirmed to be at a distance that astronomers refer to as redshift 7.9, which correlates to 650 million years after the big bang. This makes them the earliest galaxies yet to be spectroscopically confirmed as part of a developing cluster.
Astronomers used the telescope’s Near-Infrared Spectrograph (NIRSpec) instrument to precisely measure the distances and determine that the galaxies are part of a developing cluster. Galaxy YD4, previously estimated to be at a further distance based on imaging data alone, was able to be more accurately placed at the same redshift as the other galaxies. Before Webb, astronomers did not have high resolution imaging or spectral infrared data available to do this type of science.
At extreme distances, astronomers use the redshift reference to account for the fact that, as the universe expands, wavelengths of light are stretched and “shifted” to redder wavelengths, which are longer. Shorter wavelengths, for example ultraviolet and X-ray, are toward the bluer end of the electromagnetic spectrum. So extreme distances in the early universe are referenced by how much the light emitted there has been shifted as it traveled through space to be detected by a telescope.
About the Object
- R.A. PositionR.A. PositionRight ascension – analogous to longitude – is one component of an object's position.00:14:18.25
- Dec. PositionDec. PositionDeclination – analogous to latitude – is one component of an object's position.-30:22:46.04
- ConstellationConstellationOne of 88 recognized regions of the celestial sphere in which the object appears.Sculptor
- DistanceDistanceThe physical distance from Earth to the astronomical object. Distances within our solar system are usually measured in Astronomical Units (AU). Distances between stars are usually measured in light-years. Interstellar distances can also be measured in parsecs.3.5 billion light-years to main cluster
About the Data
- Data DescriptionData DescriptionProposal: A description of the observations, their scientific justification, and the links to the data available in the science archive.
Science Team: The astronomers who planned the observations and analyzed the data. "PI" refers to the Principal Investigator.This image was created with Webb data from proposal: 2561 (I. Labbe).
- InstrumentInstrumentThe science instrument used to produce the data.NIRCam
- Exposure DatesExposure DatesThe date(s) that the telescope made its observations and the total exposure time.2 Nov 2022, 15 Nov 2022
- FiltersFiltersThe camera filters that were used in the science observations.F115W, F150W, F200W, F277W, F356W, F444W
- Object NameObject NameA name or catalog number that astronomers use to identify an astronomical object.Pandora's Cluster, Abell 2744
- Object DescriptionObject DescriptionThe type of astronomical object.Galaxy Cluster and Gravitational Lens
- Release DateApril 24, 2023
- Science ReleaseWebb Reveals Early-Universe Prequel to Huge Galaxy Cluster
- CreditImage: NASA, ESA, CSA, Takahiro Morishita (Caltech/IPAC); Image Processing: Alyssa Pagan (STScI)
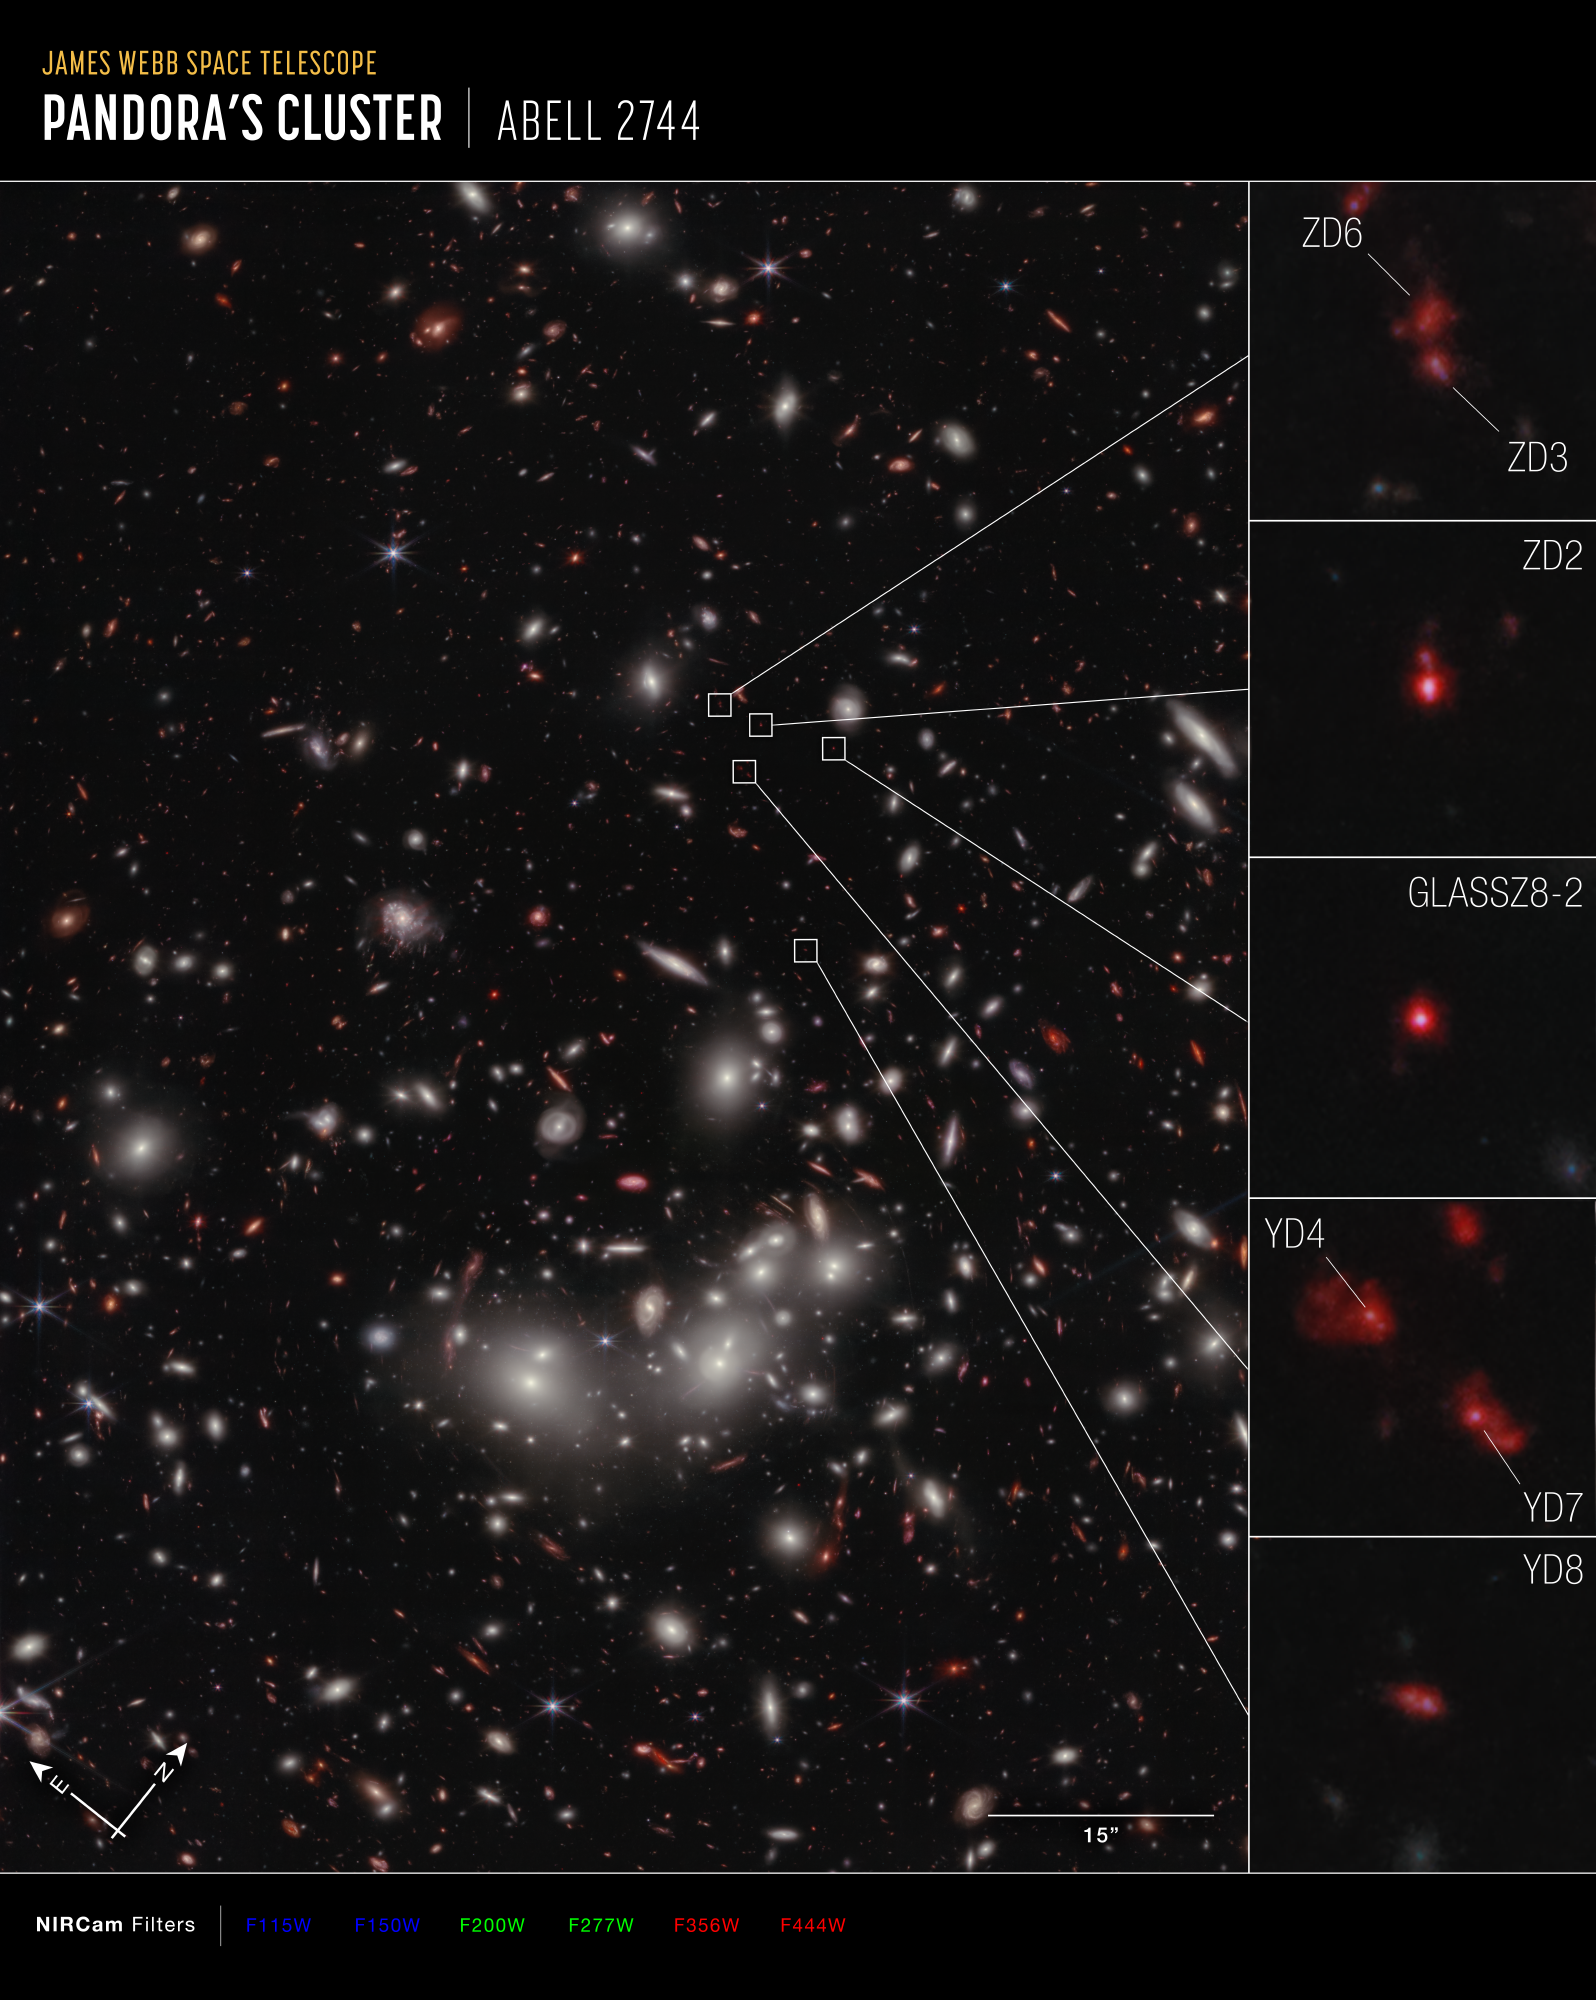
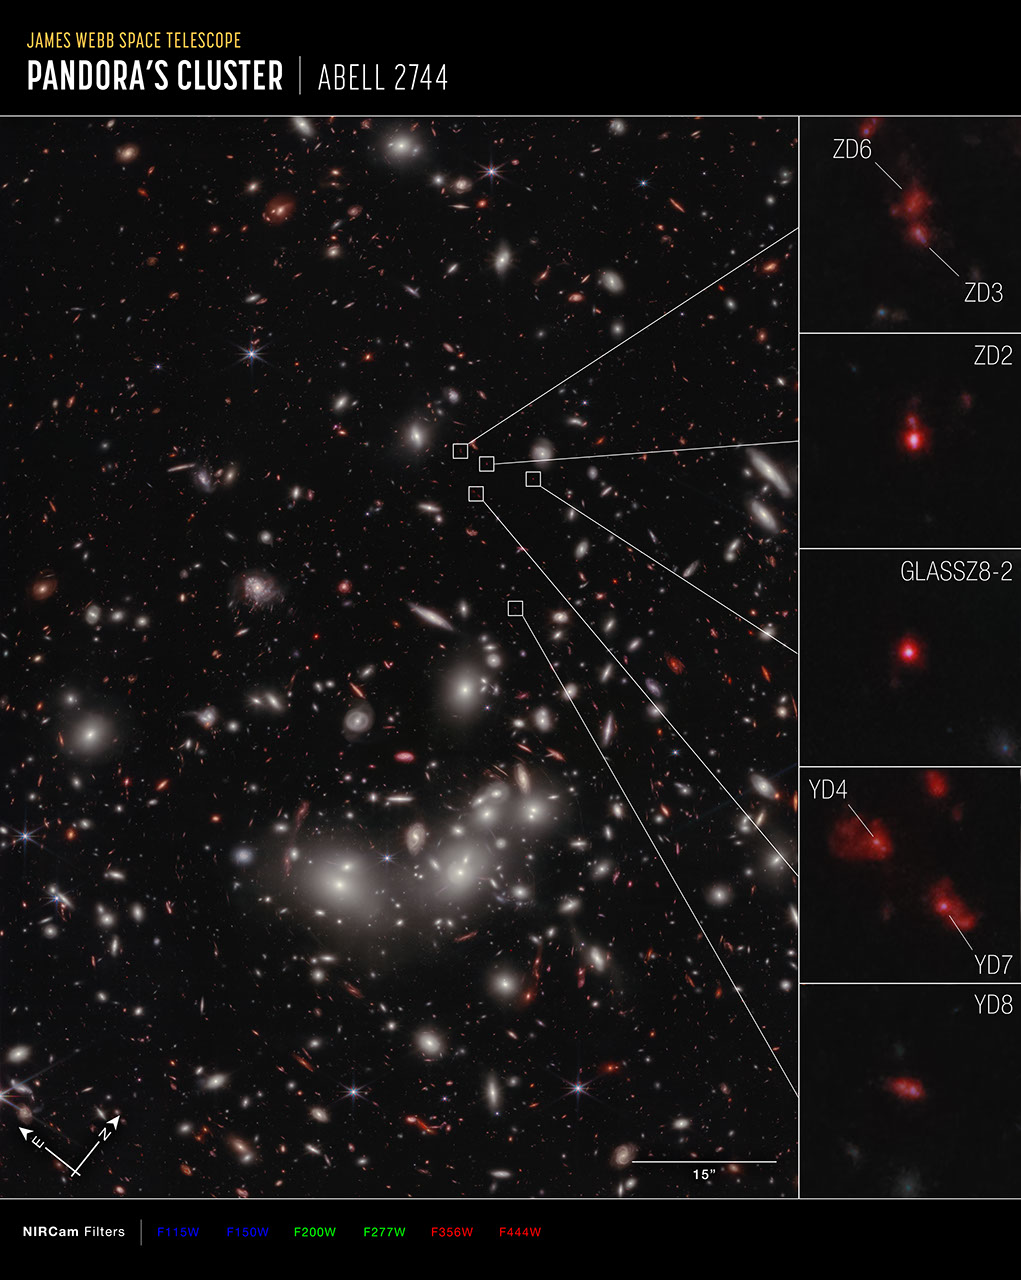
These images are a composite of separate exposures acquired by the James Webb Space Telescope using the NIRCam instrument. Several filters were used to sample specific wavelength ranges. The color results from assigning different hues (colors) to each monochromatic (grayscale) image associated with an individual filter. In this case, the assigned colors are: Blue: F115W+F150W, Green: F200W+F277W, Red: F356W+F444W
Related Images & Videos
Galaxy Protocluster (NIRCam Compass Image)
Image of a distant galaxy protocluster in the early universe, captured by the Near-Infrared Camera (NIRCam) on NASA’s James Webb Space Telescope, with compass arrows, scale bar, and color key for reference. The north and east compass arrows show the orientation of the image on...
Share
Details
Laura Betz
NASA’s Goddard Space Flight Center
Greenbelt, Maryland
laura.e.betz@nasa.gov
NASA, ESA, CSA, Takahiro Morishita (Caltech/IPAC)
Alyssa Pagan (STScI)


