


1 min read
Hot Gas-Giant Exoplanet WASP-43 b (Temperature Maps)
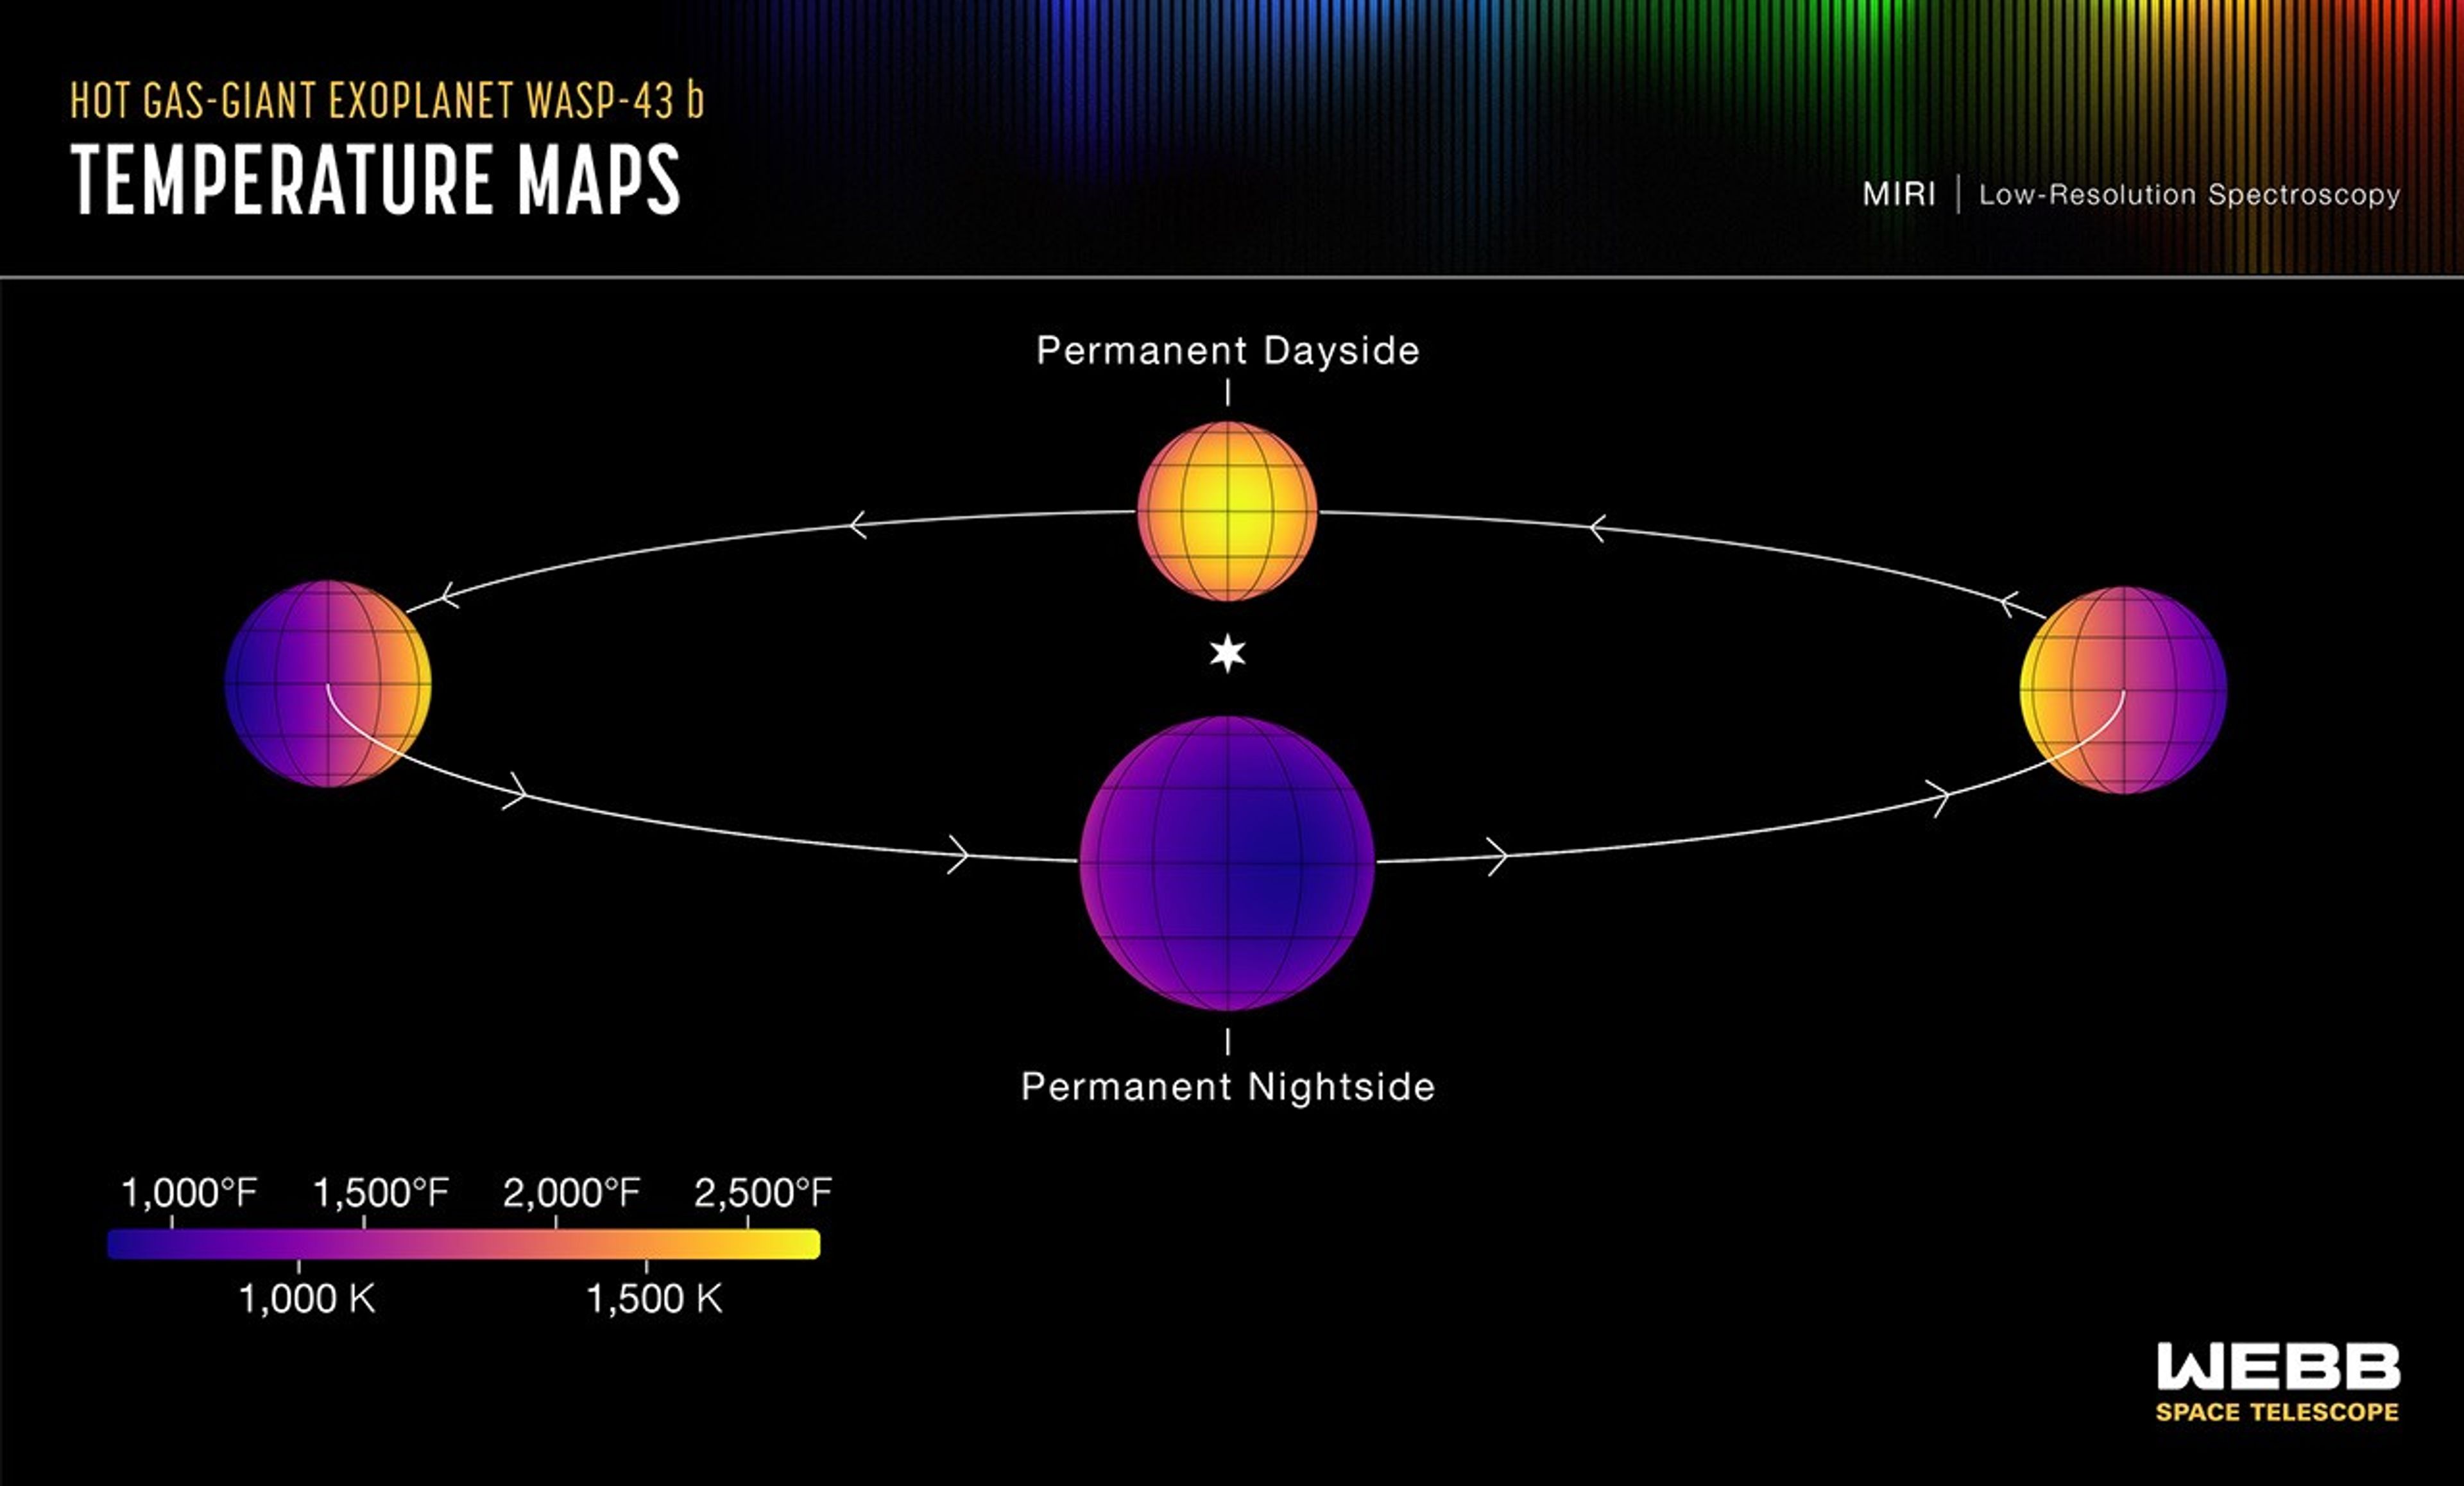
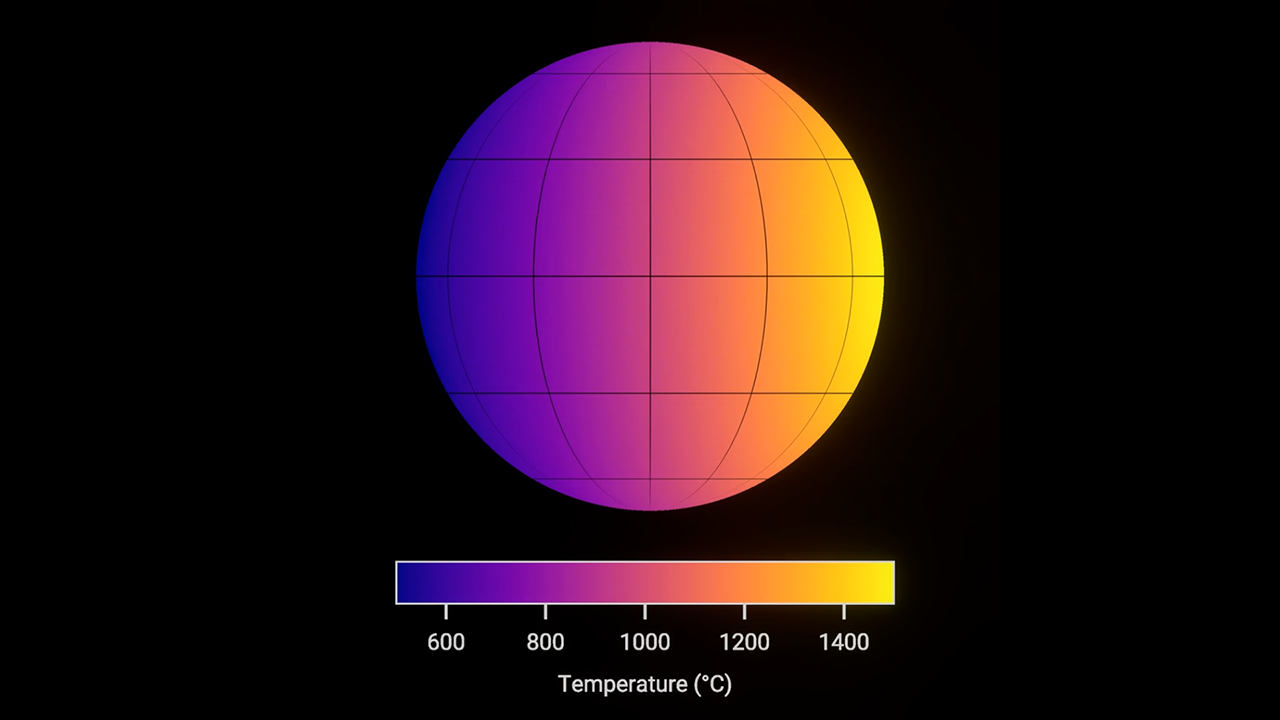
This set of maps shows the temperature of the visible side of the hot gas-giant exoplanet WASP-43 b, as the planet orbits its star.
The temperatures were calculated based on more than 8,000 brightness measurements of 5- to 12-micron mid-infrared light detected from the star-planet system by MIRI (the Mid-Infrared Instrument) on NASA’s James Webb Space Telescope. In general, the hotter an object is, the more mid-infrared light it gives off.
Because WASP-43 b orbits so close to its star (about 1.3 million miles, or 0.014 astronomical units), it is tidally locked: One side faces the star at all times, receiving continuous radiation, while the other faces away from the star in permanent darkness. This results in a clear temperature difference between the dayside and nightside. The amount of infrared light detected from the planet is greatest when the hot dayside faces the telescope, just before and after it passes behind the star (a phenomenon known as a secondary eclipse). The planet appears much dimmer in infrared light when the cooler nightside faces the telescope, as it moves across the star (the transit).
The exact difference in temperature, however, also depends on factors such as wind speeds and cloud cover. Based on the MIRI observations, WASP-43 b has an average temperature of about 2,280°F (1,250°C) on the dayside and 1,115°F (600°C) on the nightside. This is consistent with strong winds that carry heat around from the dayside to the nightside, and the presence of nightside clouds that prevent heat energy from escaping to space.
The temperature maps were made by carefully analyzing the change in temperature as different parts of the planet rotate into and out of view. The research indicates that the hottest point on the planet is not the point that receives the most light from the star (the substellar point, where the star is straight above in the sky). Instead, it is shifted about 7 degrees eastward. (This is why the maps look slightly off-center.) This is a result of strong equatorial winds, which blow at speeds upwards of 5,000 miles per hour, moving the hot air horizontally before it can radiate energy back out to space.
About the Object
- R.A. PositionR.A. PositionRight ascension – analogous to longitude – is one component of an object's position.10:19:37.96
- Dec. PositionDec. PositionDeclination – analogous to latitude – is one component of an object's position.-09:48:23.20
- ConstellationConstellationOne of 88 recognized regions of the celestial sphere in which the object appears.Sextans
- DistanceDistanceThe physical distance from Earth to the astronomical object. Distances within our solar system are usually measured in Astronomical Units (AU). Distances between stars are usually measured in light-years. Interstellar distances can also be measured in parsecs.280 light-years (87 parsecs)
About the Data
- InstrumentInstrumentThe science instrument used to produce the data.MIRI
- Exposure DatesExposure DatesThe date(s) that the telescope made its observations and the total exposure time.November 30 – December 2, 2022
- Object NameObject NameA name or catalog number that astronomers use to identify an astronomical object.WASP-43 b
- Object DescriptionObject DescriptionThe type of astronomical object.Hot Jupiter Exoplanet
- Release DateApril 30, 2024
- Science ReleaseNASA’s Webb Maps Weather on Planet 280 Light-Years Away
- CreditIllustration: NASA, ESA, CSA, Ralf Crawford (STScI); Science: Taylor Bell (BAERI), Joanna Barstow (The Open University), Michael Roman (University of Leicester)
Related Images & Videos

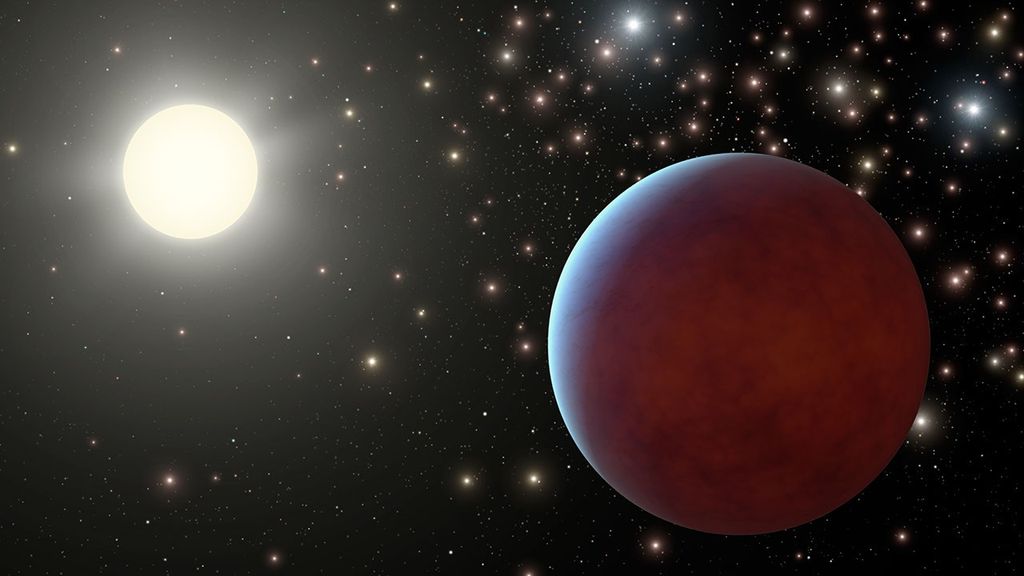
Hot Gas-Giant Exoplanet WASP-43 b (Artist's Concept)
This artist’s concept shows what the hot gas-giant exoplanet WASP-43 b could look like. WASP-43 b is a Jupiter-sized planet circling a star roughly 280 light-years away, in the constellation Sextans. The planet orbits at a distance of about 1.3 million miles (0.014 astronomical...
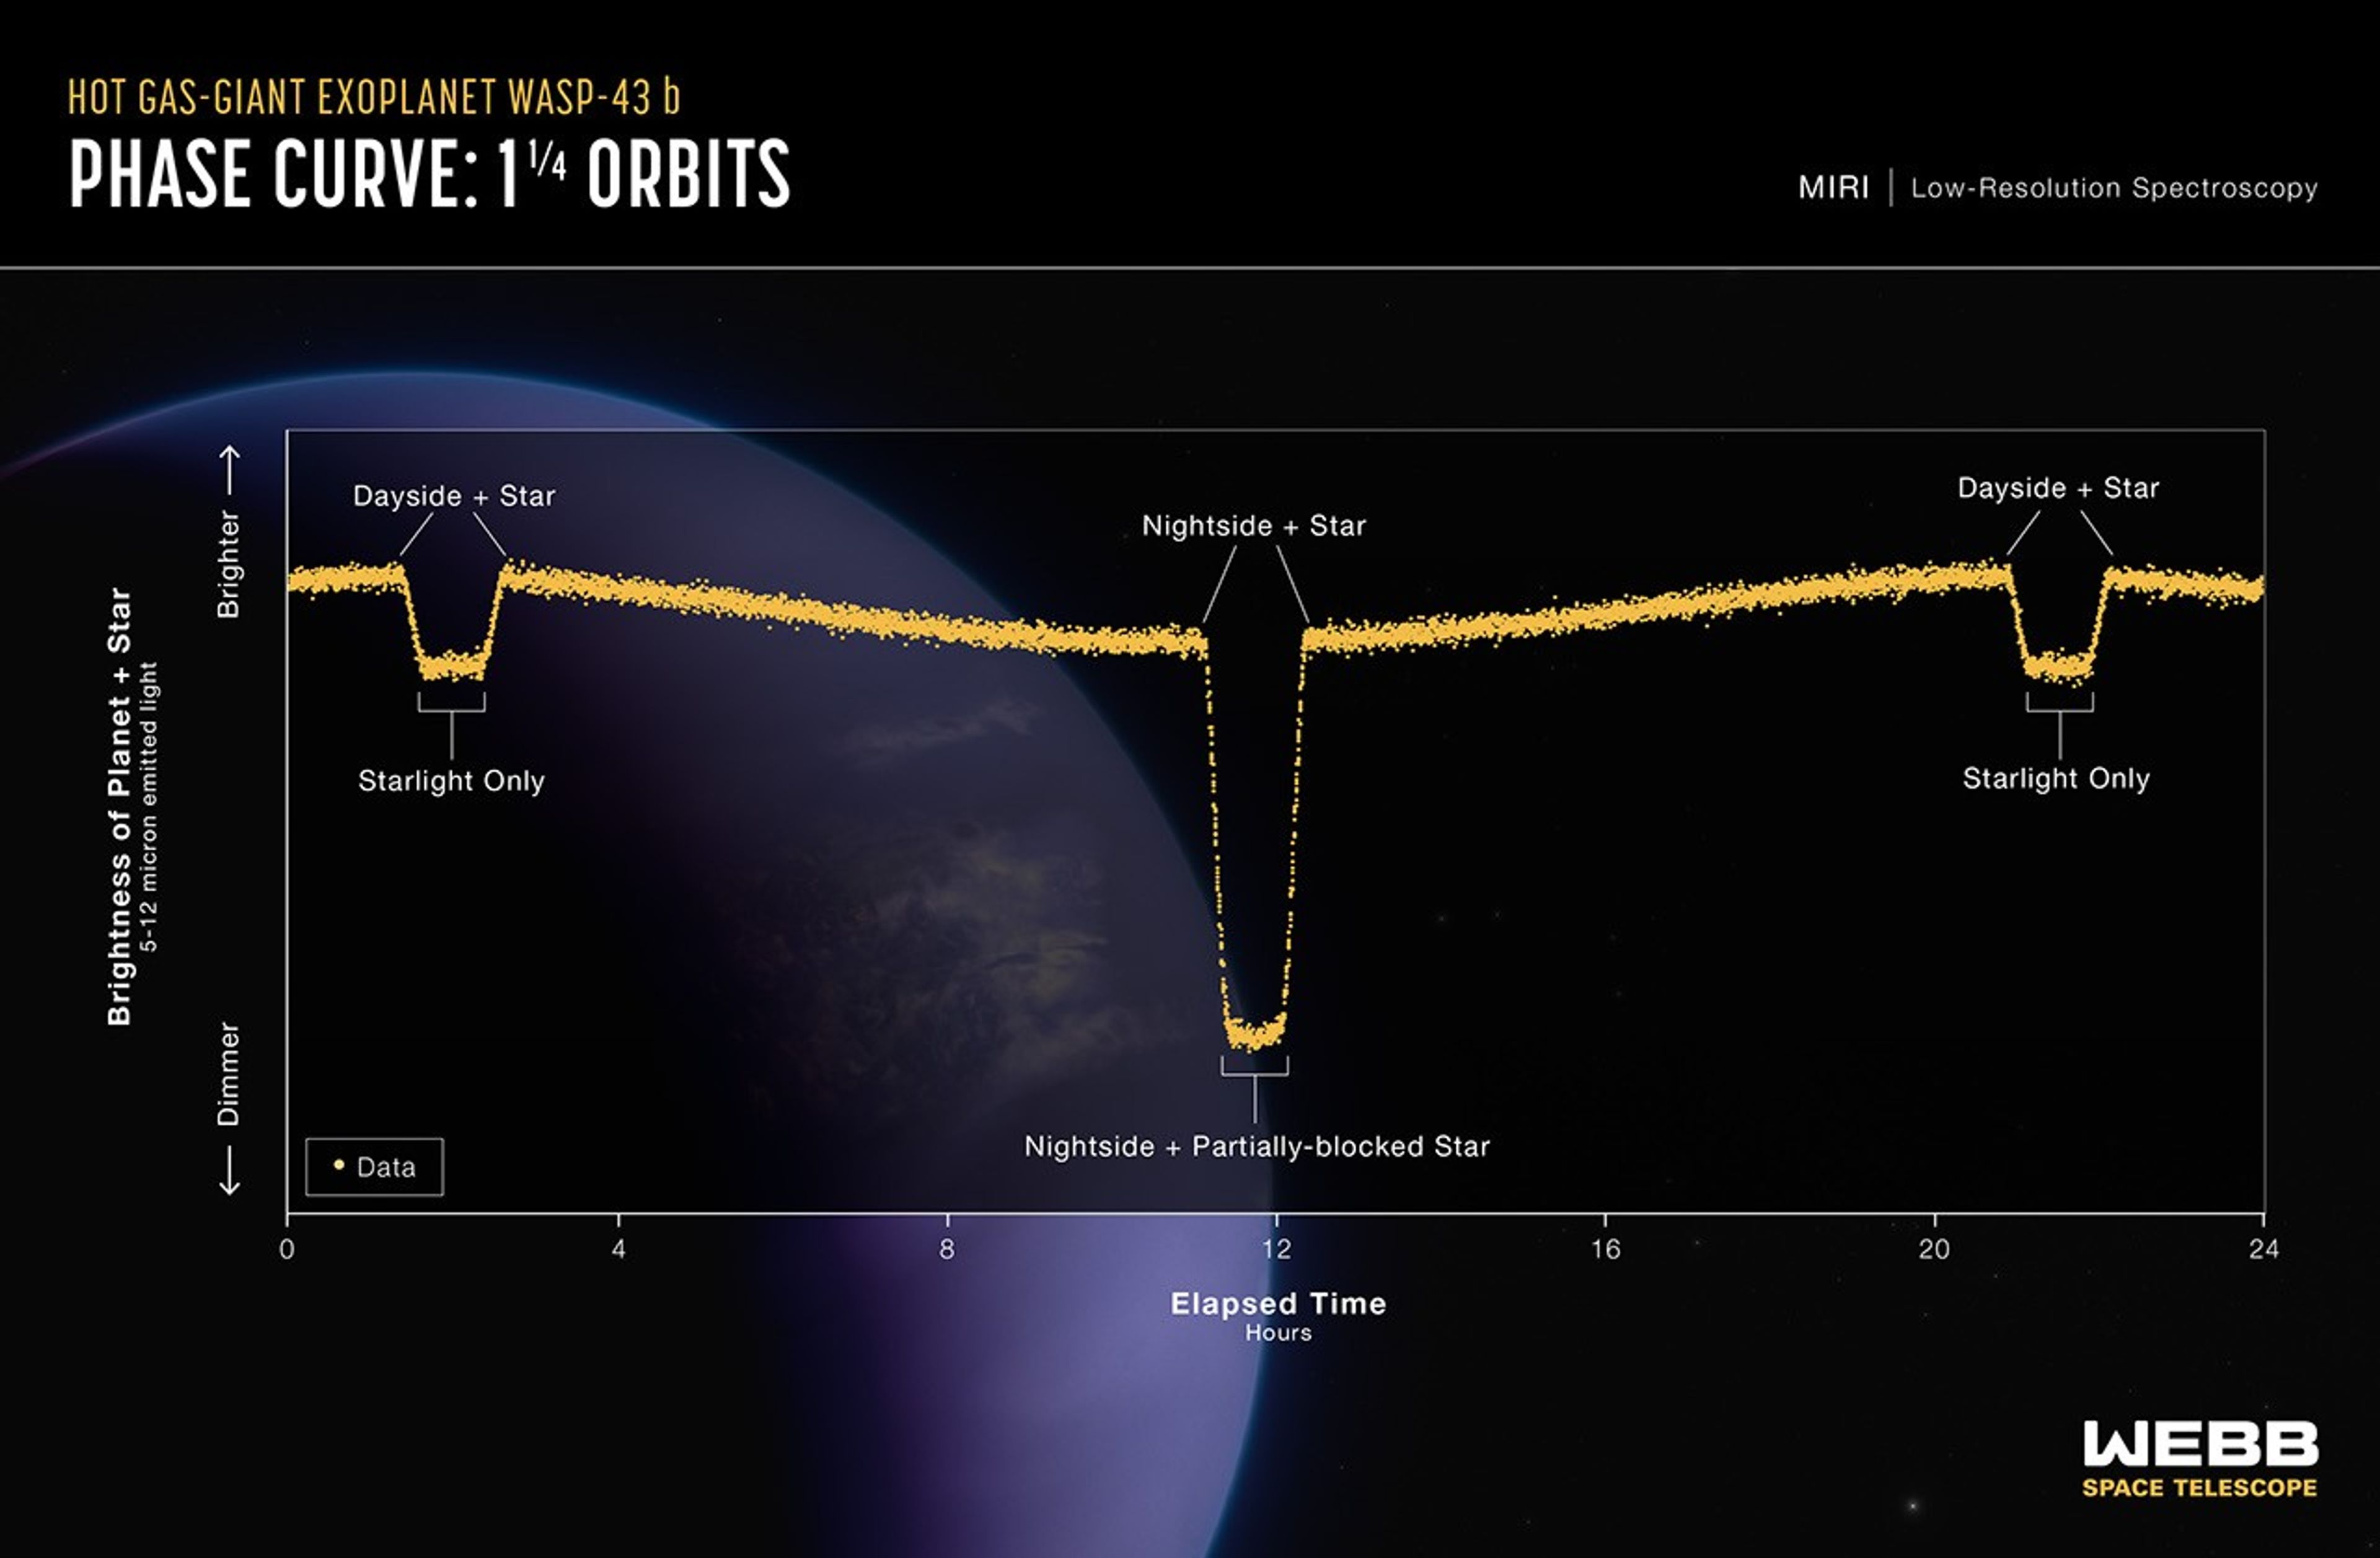
Hot Gas-Giant Exoplanet WASP-43 b (MIRI Phase Curve)
This light curve shows the change in brightness of the WASP-43 system over time as the planet orbits the star. This type of light curve is known as a phase curve because it includes the entire orbit, or all phases of the planet. Because it is tidally locked, different sides of...
Hot Gas-Giant Exoplanet WASP-43 b (Rotating Global Temperature Map)
Global temperature map of the hot gas giant exoplanet WASP-43 b. This map was made based on the brightness of 5- to 12-micron mid-infrared light detected from the planet by MIRI (the Mid-Infrared Instrument) on NASA’s James Webb Space Telescope. In general, the hotter an object...
Share
Details
Laura Betz
NASA’s Goddard Space Flight Center
Greenbelt, Maryland
laura.e.betz@nasa.gov
NASA, ESA, CSA, Ralf Crawford (STScI)
Taylor Bell (BAERI), Joanna Barstow (The Open University), Michael Roman (University of Leicester)


