


1 min read
Motions of Gas Around an Extremely Red Quasar (NIRSpec IFU)
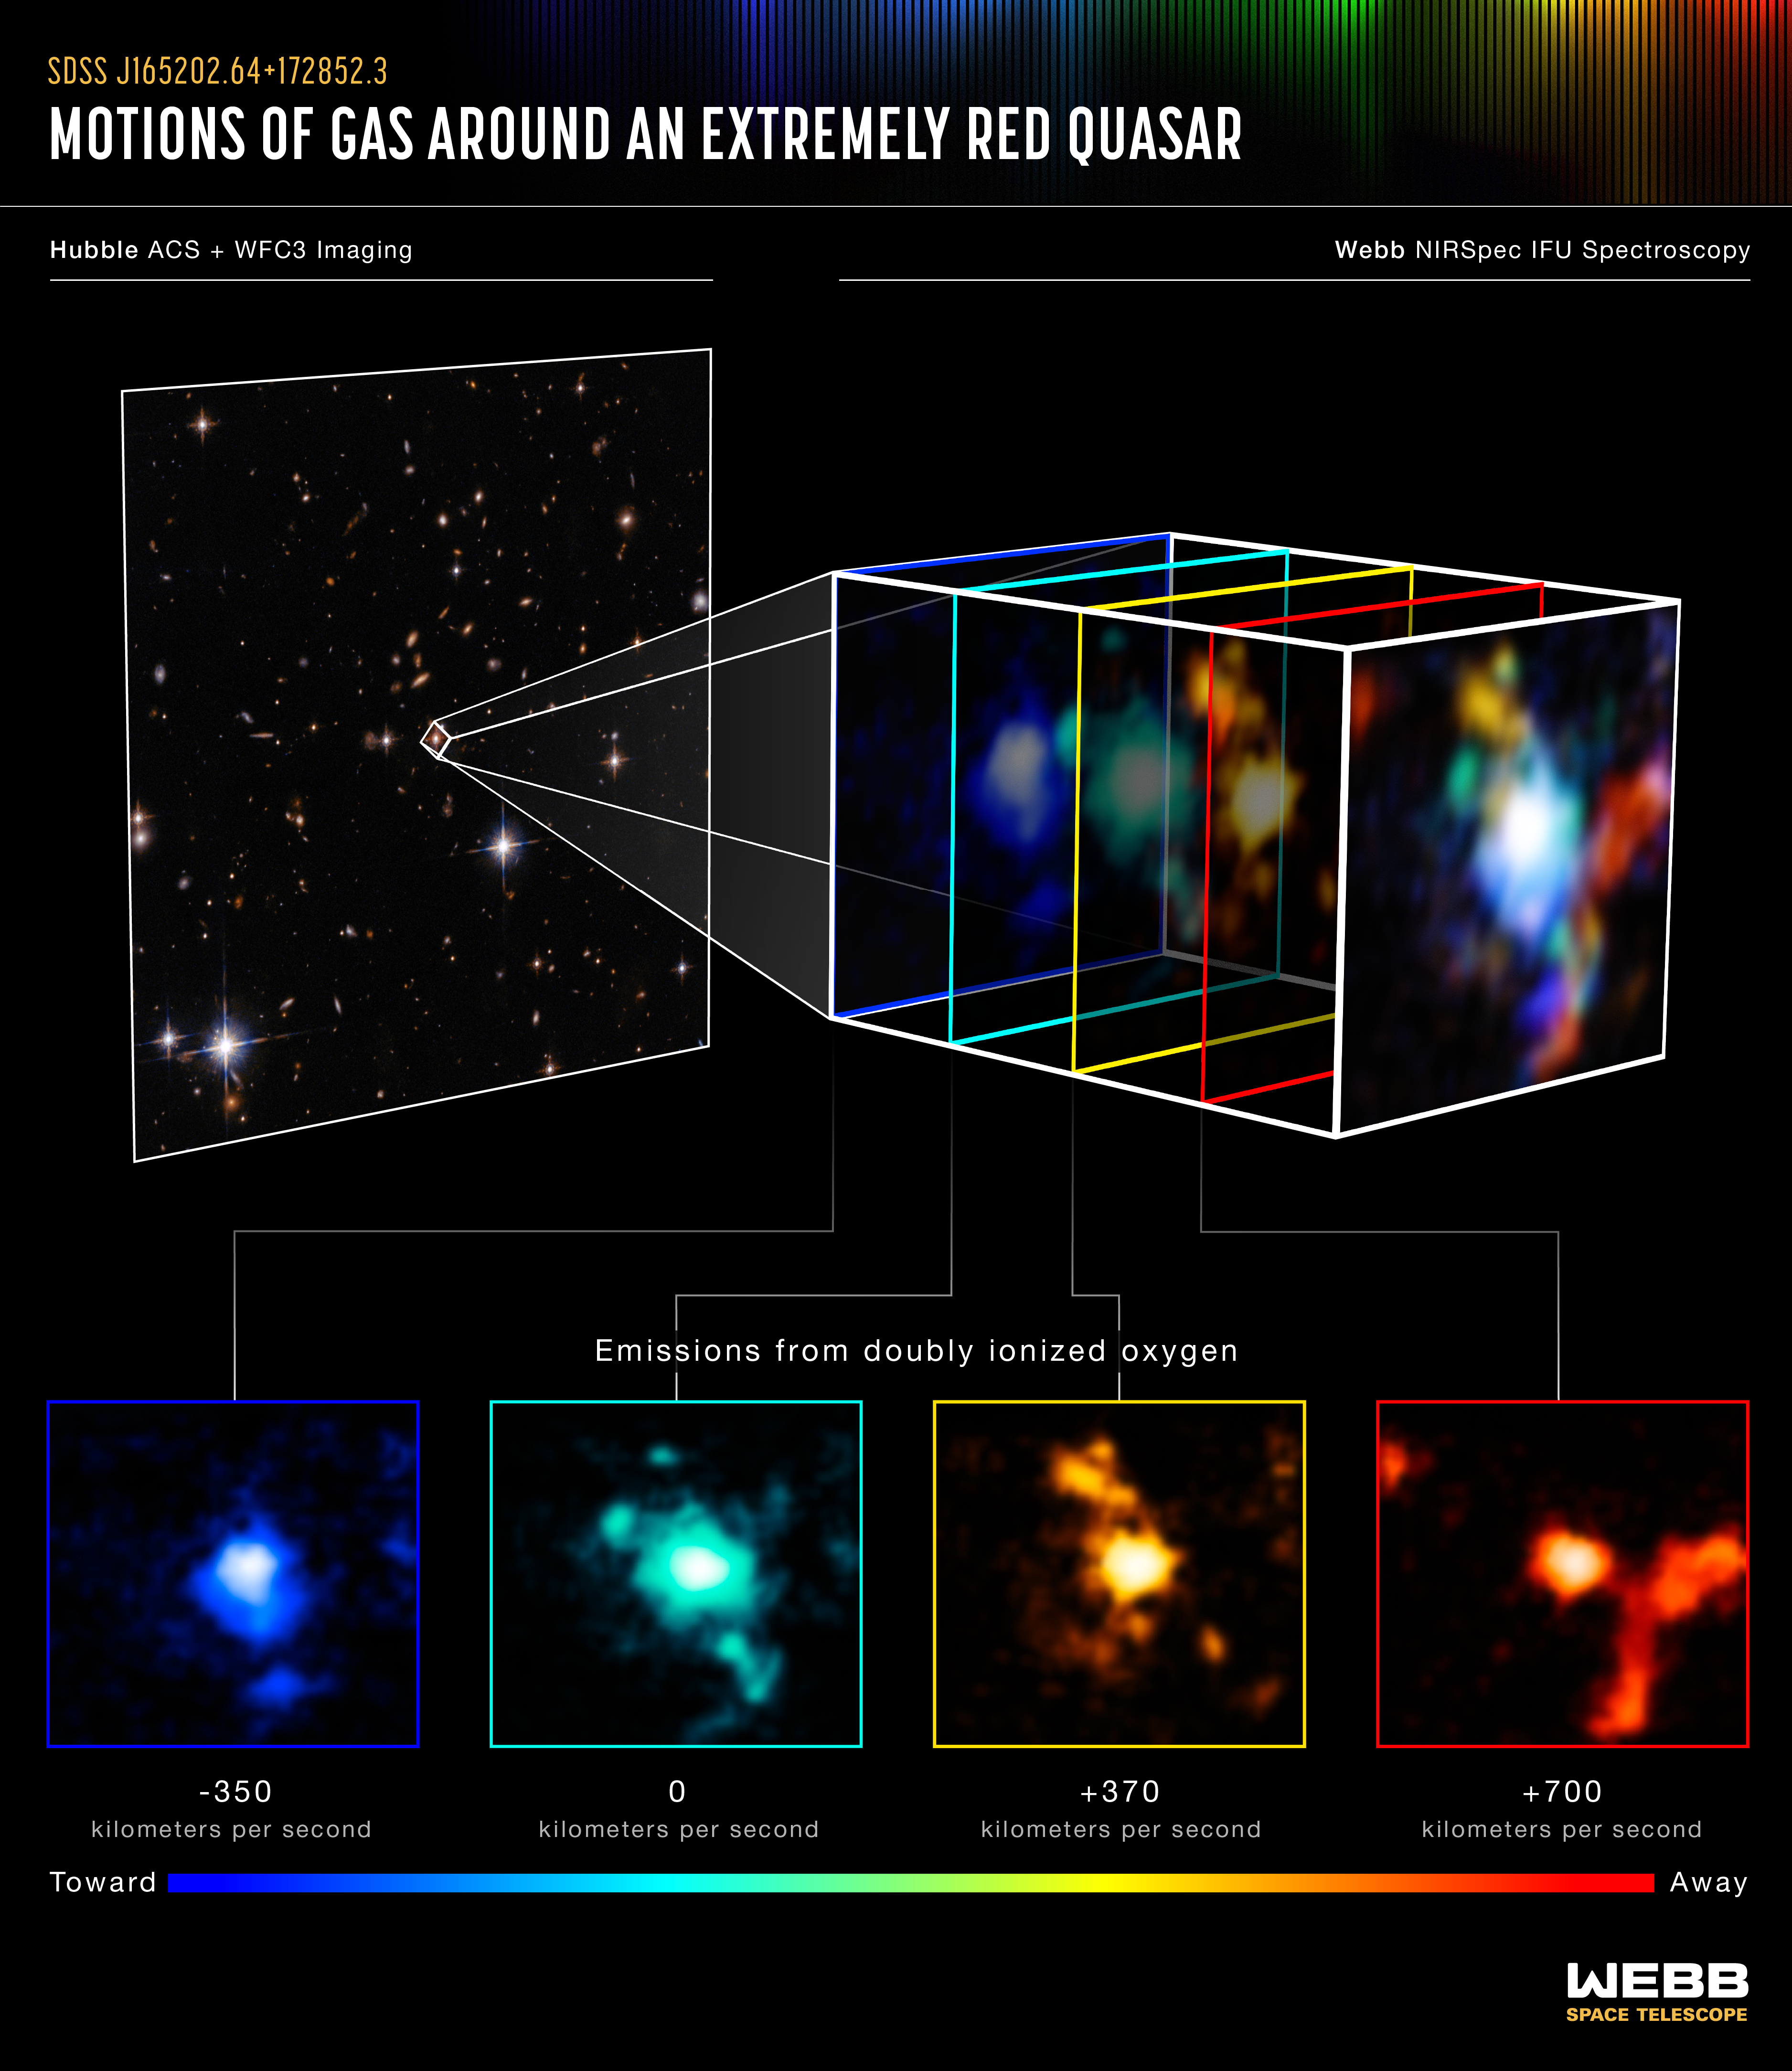
At left, the quasar SDSS J165202.64+172852.3 is highlighted in a Hubble Space Telescope image taken in visible and near-infrared light. The images on the right and at bottom present new observations from the James Webb Space Telescope in multiple wavelengths. They demonstrate the distribution and motions of gas within a newly observed galaxy cluster around the central quasar.
The image at right is composed of four narrow-band images made from the Webb NIRSpec instrument’s integral-field spectroscopy mode. All four of the narrow-band images show light from doubly ionized oxygen atoms.
The panels at the bottom present the four narrow-band images separately. Each color illustrates the relative speed of ionized oxygen gas across the galaxy cluster. The redder the color the faster the gas is moving away from our line of sight relative to the quasar, while the bluer the color the faster it's moving toward us relative to the quasar. The color green indicates that the gas is steady in our line of sight in comparison to the quasar.
Extended Description and Image Alt Text
Extended Description
At the bottom left are the thickest regions of gas and dust, which appear light blue and dark gray-blue. There are many layers of infographic titled “Motions of Gas Around an Extremely Red Quasar; Hubble ACS and WFC3 Imaging and Webb NIRSpec IFU Spectroscopy.”
The infographic shows a color image of a field of galaxies and a zoom-in color image to one of those galaxies for reference, and four separate single-color images of the zoomed-in galaxy. Each of the four separate images is labeled with the speed of the gas that emitted light at that wavelength.
Top Left: Reference Image
An oblique view of a Hubble ACS/WFC3 composite image shows a field of distant galaxies. A galaxy in the middle is outlined.
Top Right: Horizontal Stack of Single-Color Images
An oblique view of a rectangular prism is pulled out of the center of the galaxy outlined in the top left reference image. The prism is made of four separate single-color images with rectangular outlines stacked horizontally one in front of the other. Because the rectangles are overlapping and at an oblique angle, only a small portion of each image is visible. From left to right (and back to front) the rectangles are blue, cyan, yellow, and red. A color image of the center of the galaxy is on the front of the prism.
Bottom: Images Side-by-Side
The same four rectangular single-colored images with rectangular outlines are arranged side-by-side along the bottom. The view of each image is face on rather than oblique. There is a line connecting each image to its corresponding rectangle in the stack on the upper right. The images are collectively labeled “emissions from doubly ionized oxygen.” Each single-color image is labeled with the speed of the gas that emitted that wavelength of light. From left to right:
- Blue image: Minus 350 kilometers per second
- Cyan image: Zero kilometers per second
- Yellow image: Plus 370 kilometers per second
- Red image: Plus 700 kilometers per second
All four images show an amorphous, cloud-like glow. Some areas are brighter than others. The green image shows a prominent extension to lower right. The yellow image shows a prominent extension to upper left. The red image shows prominent extensions to the right and lower right.
Image Alt Text
Infographic titled “Motions of Gas Around an Extremely Red Quasar; Hubble ACS and WFC3 Imaging and Webb NIRSpec IFU Spectroscopy
About the Object
- R.A. PositionR.A. PositionRight ascension – analogous to longitude – is one component of an object's position.16 52 02.64
- Dec. PositionDec. PositionDeclination – analogous to latitude – is one component of an object's position.+17 28 52.3
- ConstellationConstellationOne of 88 recognized regions of the celestial sphere in which the object appears.Hercules
About the Data
- Data DescriptionData DescriptionProposal: A description of the observations, their scientific justification, and the links to the data available in the science archive.
Science Team: The astronomers who planned the observations and analyzed the data. "PI" refers to the Principal Investigator.
- Object NameObject NameA name or catalog number that astronomers use to identify an astronomical object.SDSS J165202.64+172852.3
- Release DateOctober 20, 2022
- Science ReleaseNASA’s Webb Uncovers Dense Cosmic Knot in the Early Universe
- CreditImage: NASA, ESA, CSA, STScI; Science: Q-3D Team, Dominika Wylezalek (ZAH), Andrey Vayner (JHU), Nadia Zakamska (JHU); Image Processing: Leah Hustak (STScI)
Share
Details
Laura Betz
NASA’s Goddard Space Flight Center
Greenbelt, Maryland
laura.e.betz@nasa.gov
NASA, ESA, CSA, STScI
Q-3D Team, Dominika Wylezalek (ZAH), Andrey Vayner (JHU), Nadia Zakamska (JHU)
Leah Hustak (STScI)


