


1 min read
Phoenix Cluster (Hubble, Chandra, VLA)
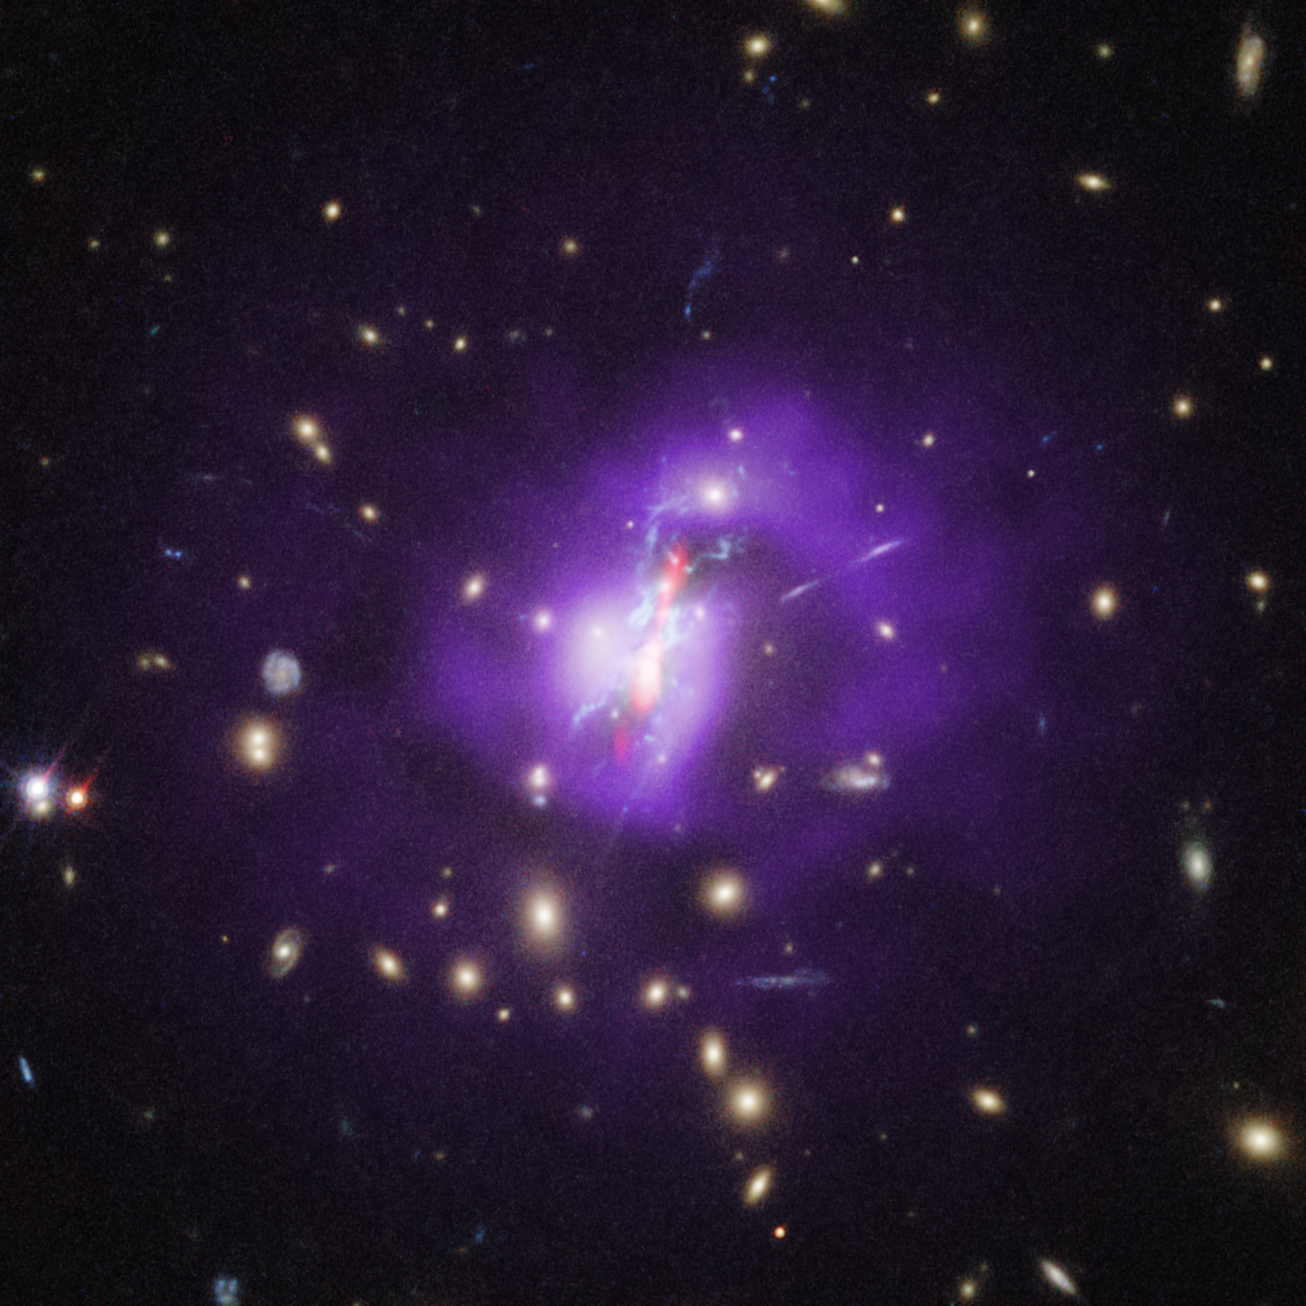
This image of the Phoenix cluster combines data from NASA’s Hubble Space Telescope, Chandra X-ray Observatory, and the Very Large Array (VLA) radio telescope and shows how the supermassive black hole at the center promotes large amounts of star formation, instead of hinders it.
X-rays from Chandra depict extremely hot gas in purple. Optical light data from Hubble show galaxies in yellow, and filaments of cooler gas where stars are forming in light blue.
Outburst-generated jets, represented in red, are seen in radio waves by the VLA. As the jets push outward, they inflated cavities, or bubbles, in the hot gas that pervades the cluster.
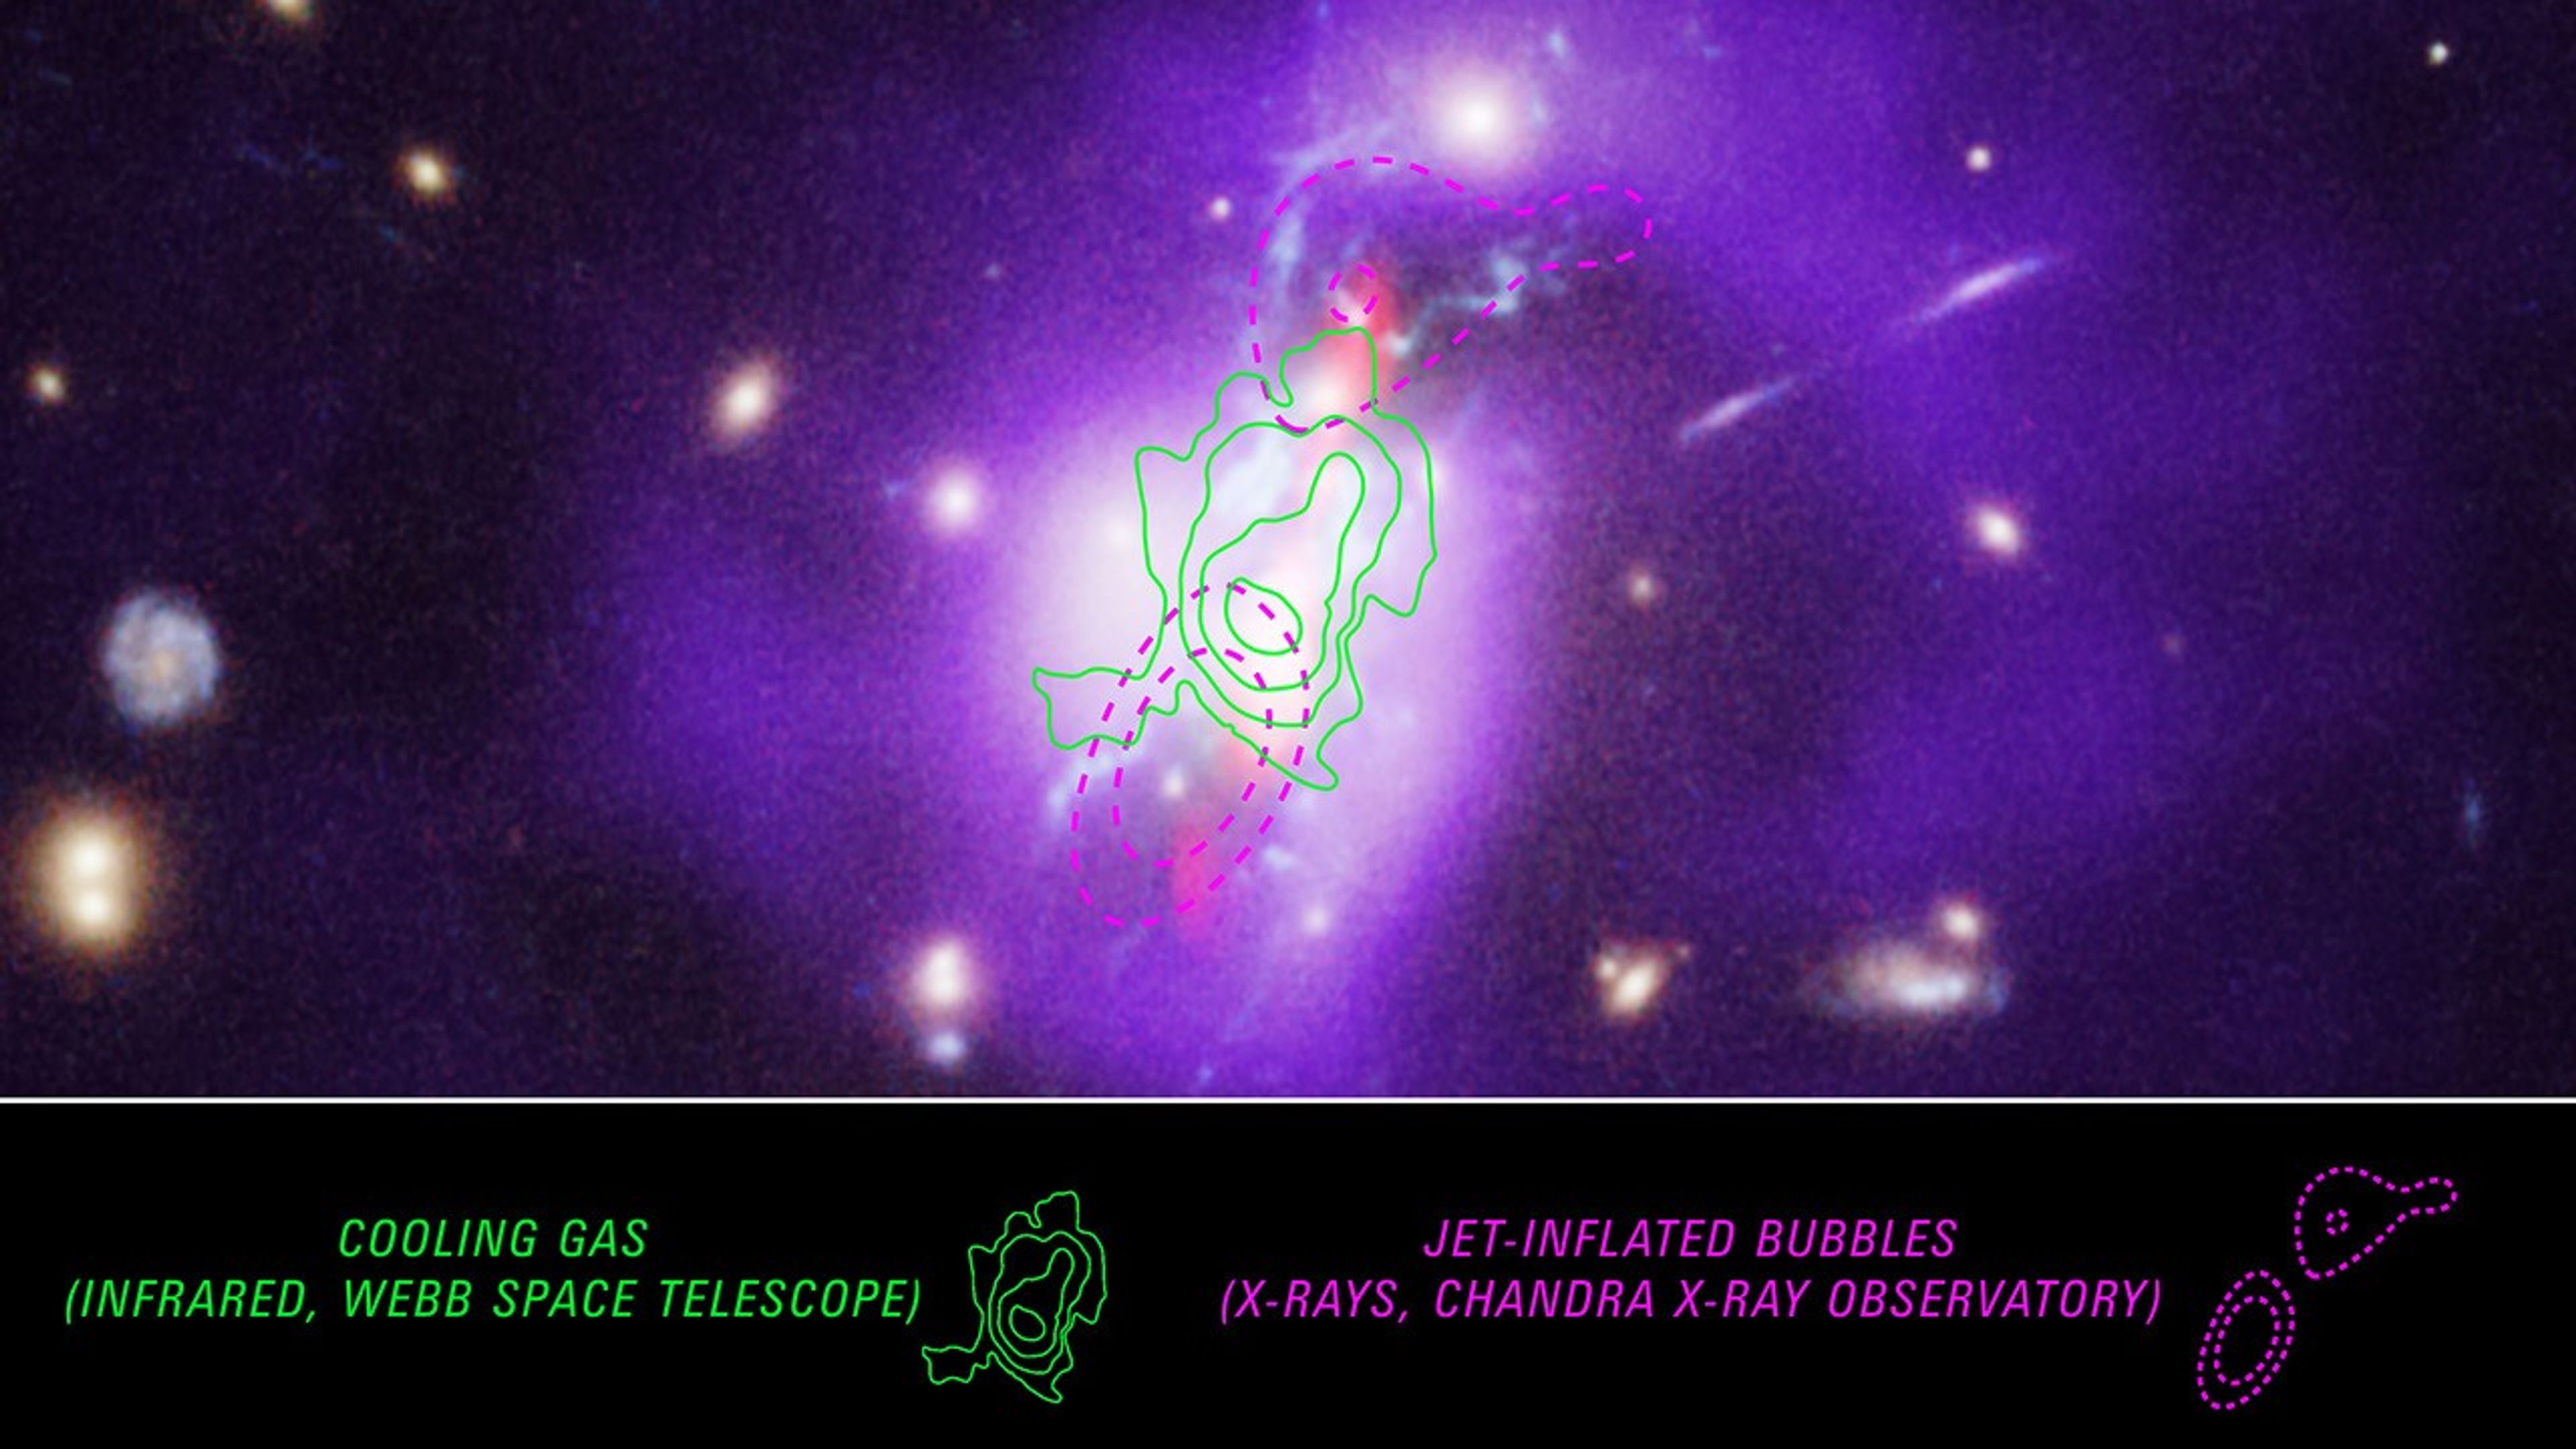
New observations from NASA’s James Webb Space Telescope trace the cooling gas along those cavities, which enables the Phoenix cluster to form stars at such a high rate.
About the Object
- R.A. PositionR.A. PositionRight ascension – analogous to longitude – is one component of an object's position.23:44:40.9
- Dec. PositionDec. PositionDeclination – analogous to latitude – is one component of an object's position.-42:41:54
- ConstellationConstellationOne of 88 recognized regions of the celestial sphere in which the object appears.Phoenix
- DistanceDistanceThe physical distance from Earth to the astronomical object. Distances within our solar system are usually measured in Astronomical Units (AU). Distances between stars are usually measured in light-years. Interstellar distances can also be measured in parsecs.5.73 billion light-years
- DimensionsDimensionsThe physical size of the object or the apparent angle it subtends on the sky.Image is 44 arcsec across (about 1.2 million light-years)
About the Data
- Data DescriptionData DescriptionProposal: A description of the observations, their scientific justification, and the links to the data available in the science archive.
Science Team: The astronomers who planned the observations and analyzed the data. "PI" refers to the Principal Investigator.The HST observations include those from programs 15315 (M. McDonald)
- InstrumentInstrumentThe science instrument used to produce the data.ACS/WFC
- Exposure DatesExposure DatesThe date(s) that the telescope made its observations and the total exposure time.May-July 2018
- FiltersFiltersThe camera filters that were used in the science observations.F475W, F775W, F850LP
- Object NameObject NameA name or catalog number that astronomers use to identify an astronomical object.Phoenix Cluster
- Object DescriptionObject DescriptionThe type of astronomical object.Cluster of galaxies
- Release DateFebruary 13, 2025
- Science ReleaseWebb Maps Full Picture of How Phoenix Galaxy Cluster Forms Stars
- CreditImage: NASA, CXC, NRAO, ESA, Michael McDonald (MIT); Image Processing: Joseph DePasquale (STScI)
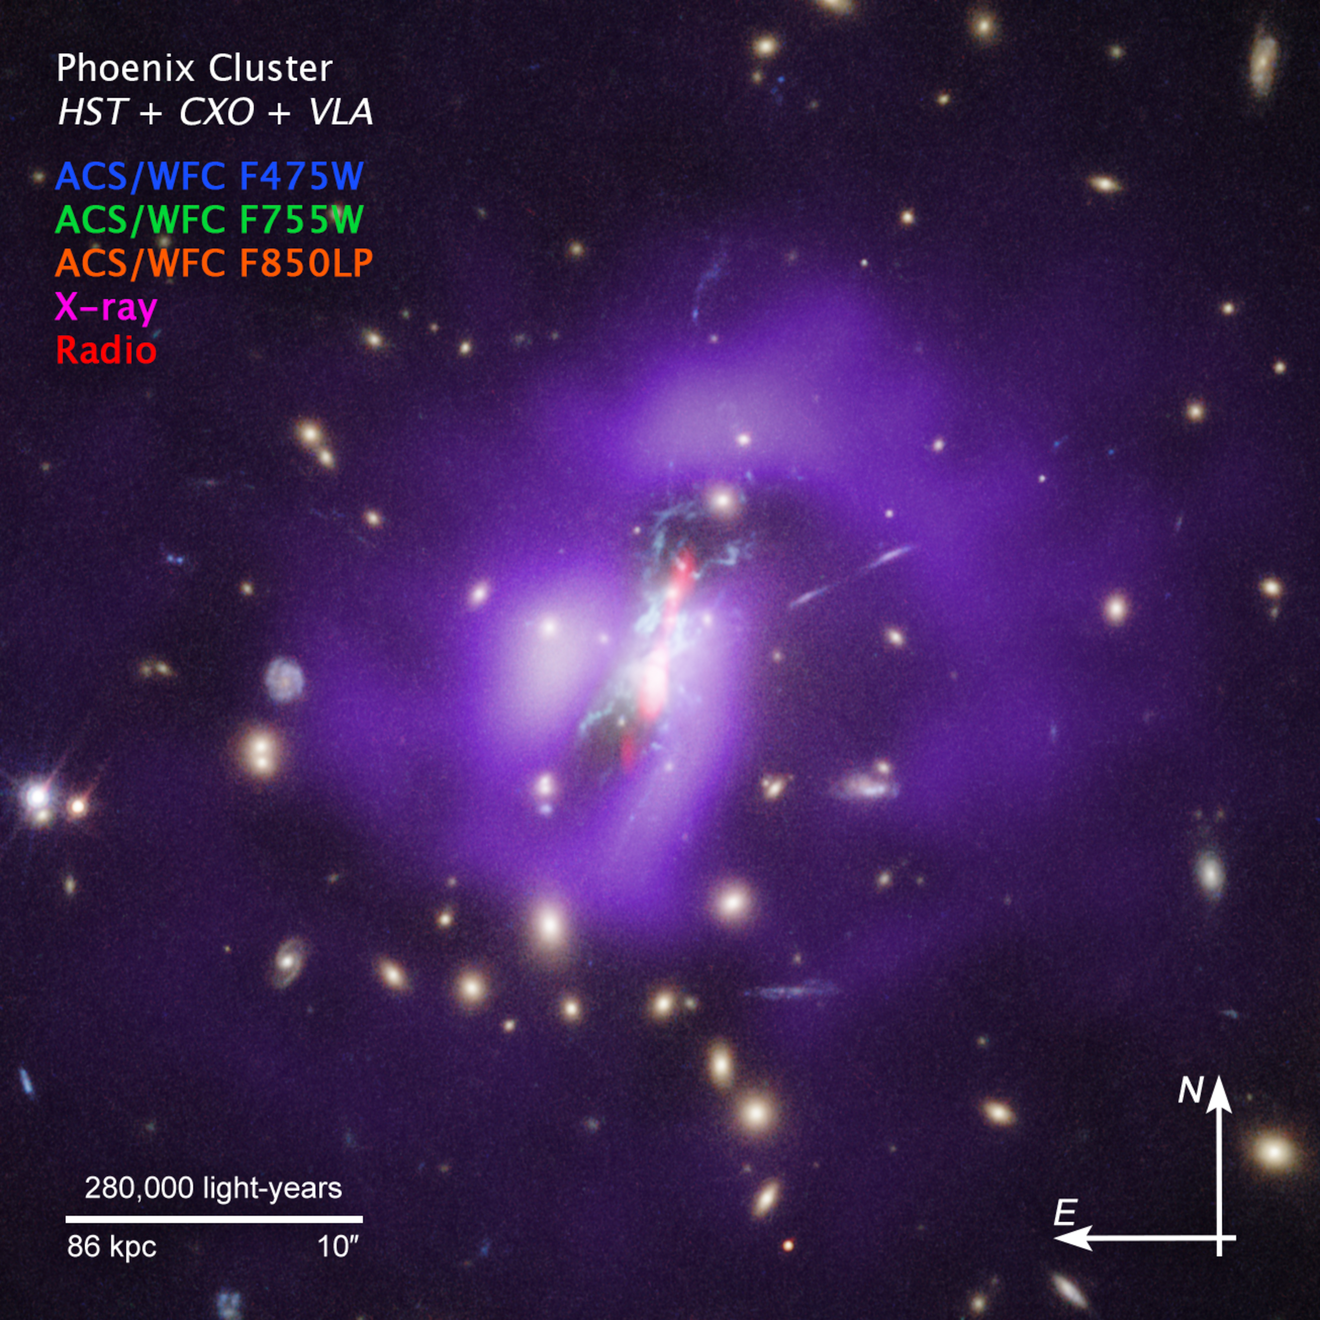
These images are a composite of separate exposures acquired by the ACS instrument on the Hubble Space Telescope. Several filters were used to sample narrow wavelength ranges. The color results from assigning different hues (colors) to each monochromatic (grayscale) image associated with an individual filter. In this case, the assigned colors are: Blue: F475W Green: F775W Red: F850LP
Related Images & Videos
Phoenix Cluster (Hubble, Chandra, VLA Annotated)
New observations from NASA’s James Webb Space Telescope trace the cooling gas that enables the Phoenix cluster to form stars at such a high rate. Previous studies of the Phoenix cluster using the Hubble Space Telescope, Chandra X-ray Observatory, and the Very Large Array radio...
Share
Details
Laura Betz
NASA’s Goddard Space Flight Center
Greenbelt, Maryland
laura.e.betz@nasa.gov
NASA, CXC, NRAO, ESA, Michael McDonald (MIT)
Joseph DePasquale (STScI)


