


1 min read
Simulated Spectrum of a Protoplanetary Disk
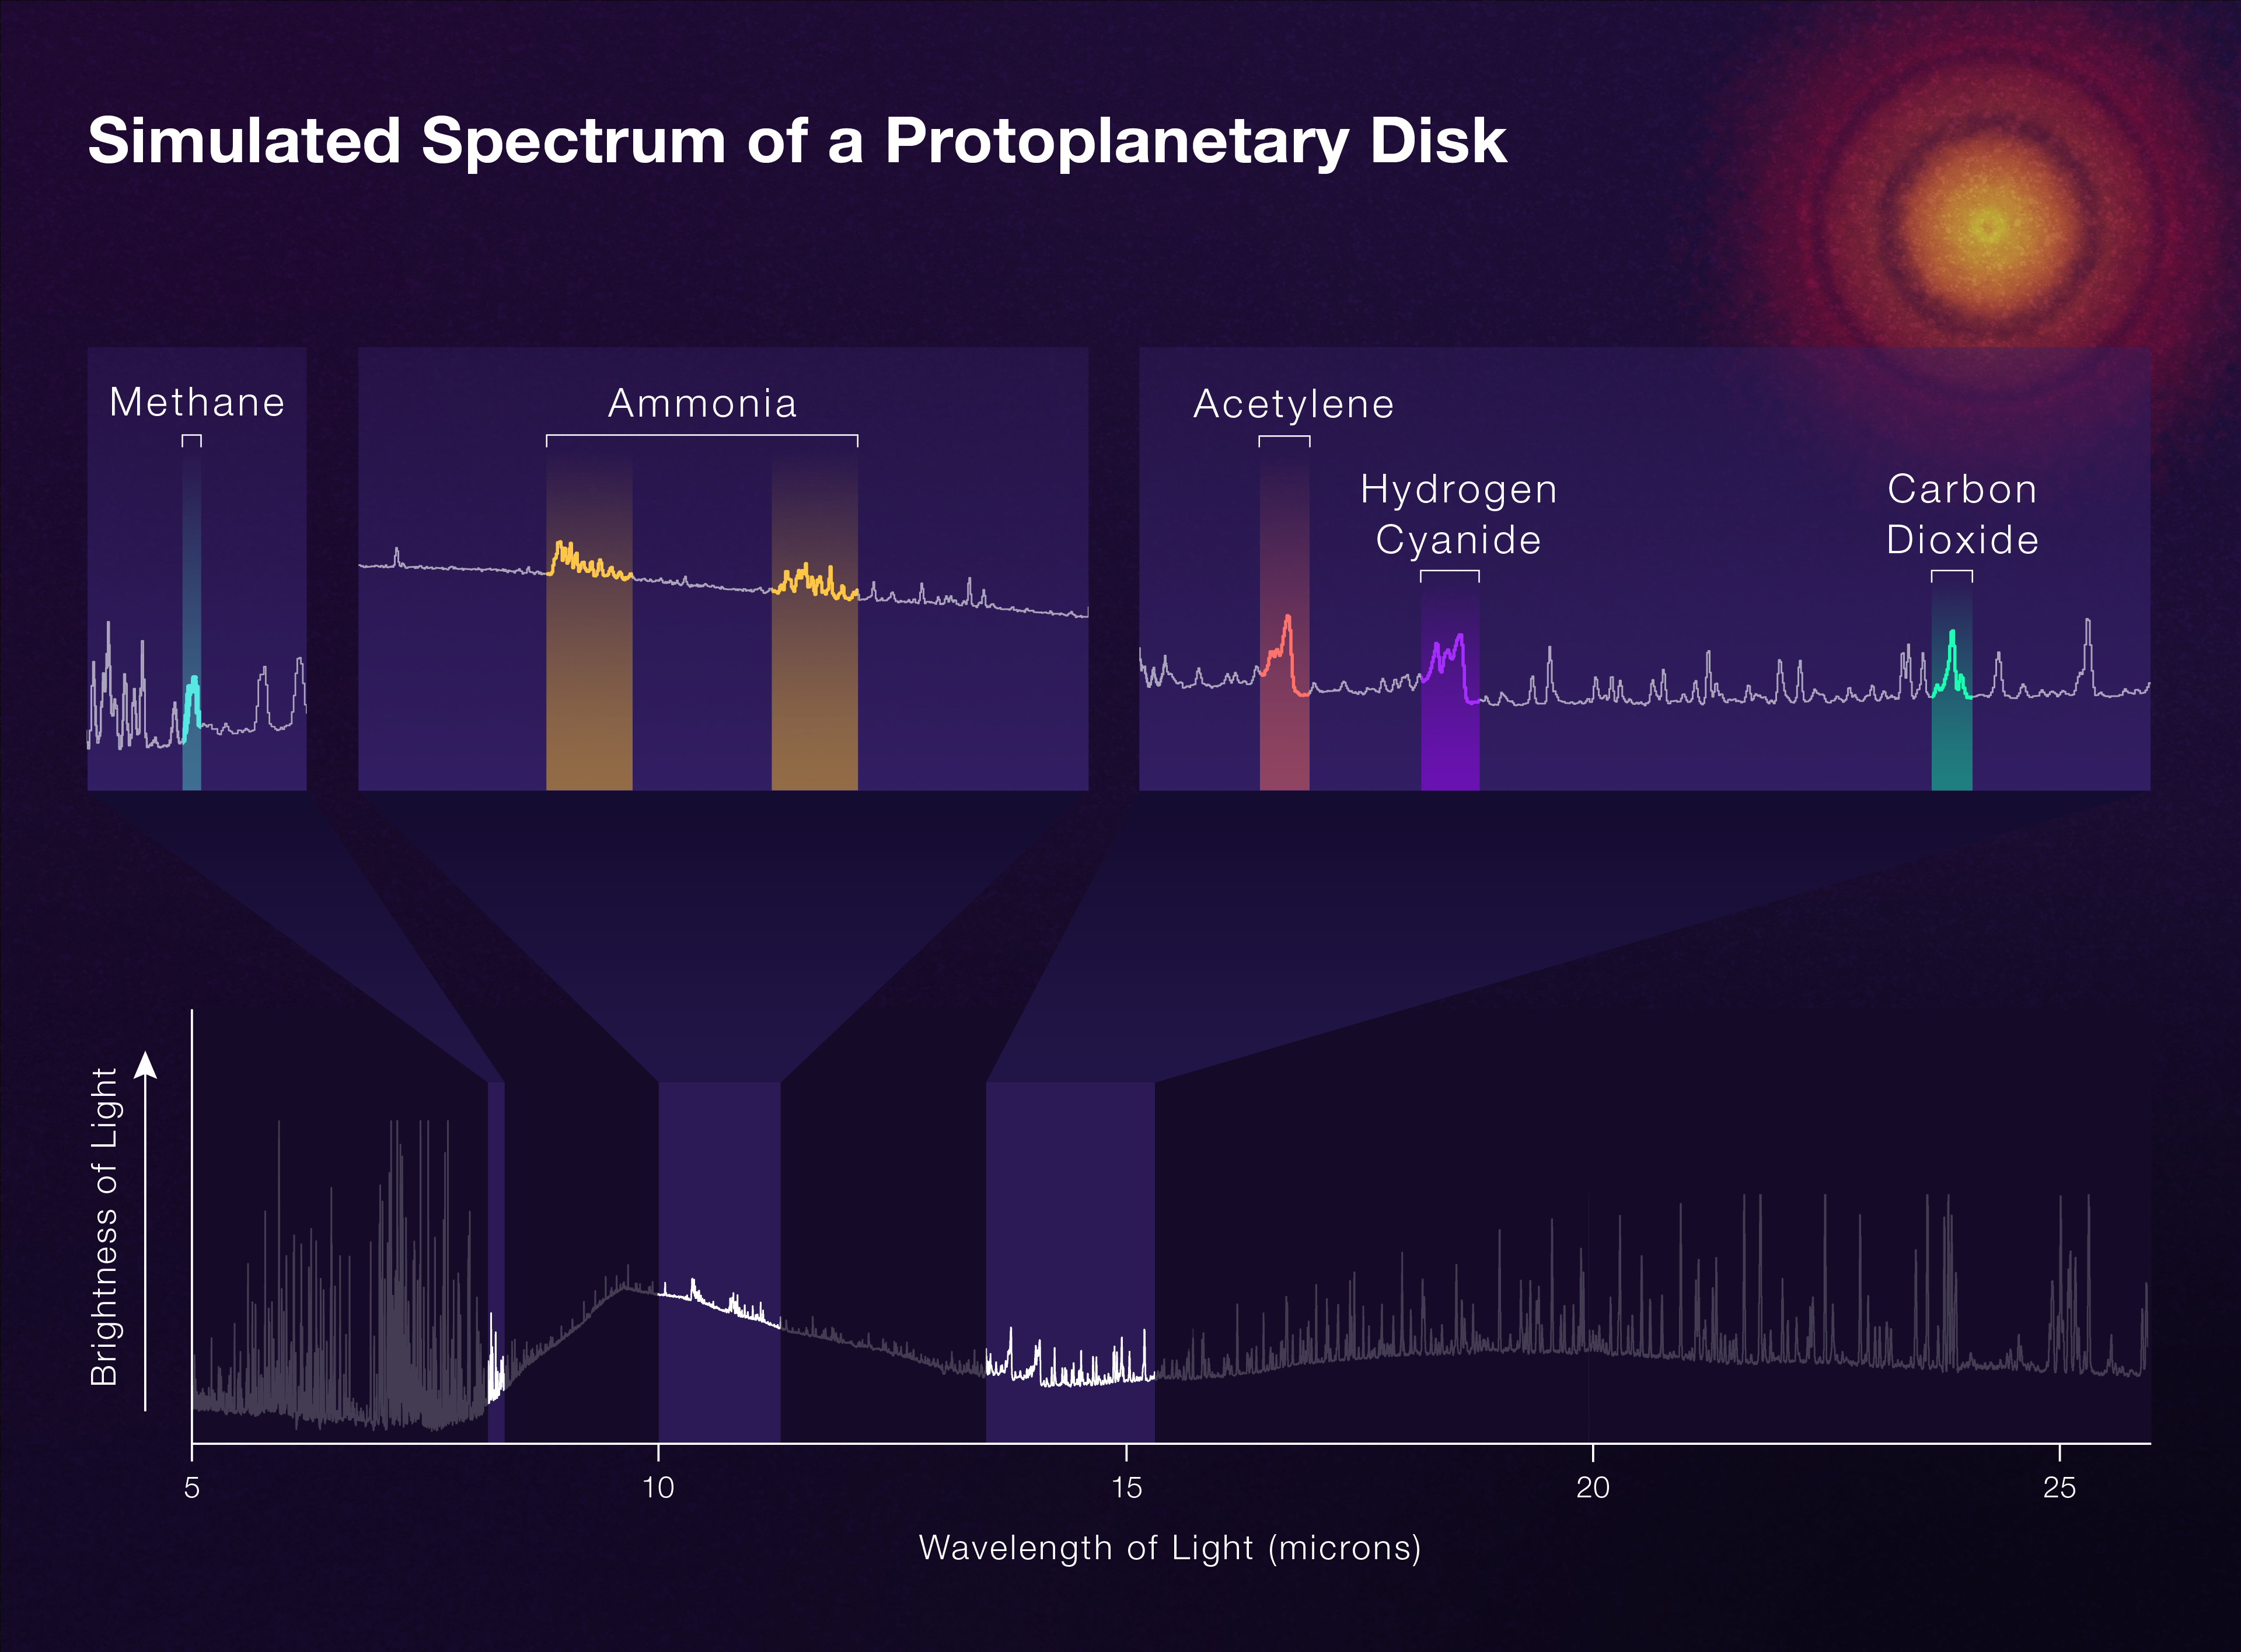
The James Webb Space Telescope’s Mid-Infrared Instrument (MIRI) will deliver incredibly rich information about the molecules that are present in the inner disks of still-forming planetary systems (known as protoplanetary disks). This simulated spectrum, which produces a detailed pattern of colors based on the wavelengths of light emitted, helps researchers take inventories of each molecule. This spectrum shows how much of the gasses like methane, ammonia, and carbon dioxide exist. Most of the unidentified features are water. Since spectra are teeming with details, they will help astronomers draw conclusions about the system’s contents as planets form.
Extended Description and Image Alt Text
Extended Description
Graphic titled “Simulated Spectrum of a Protoplanetary Disk.”
A graph is at the bottom, extending almost the full width. Its overall height is only about a third of the overall graphic, which has a black background.
The horizontal x-axis is labeled “Wavelength of Light (microns)” along the bottom, and shows a tick mark for 5 where the lines meet at the origin. Tick marks for 10, 15, 20, and 25 are evenly spaced from left to right.
The vertical y-axis is labeled “Brightness of Light.” There are no tick marks.
A faded jagged white line runs along the bulk of the main graph. It is irregular with a series of tight peaks and valleys from left to right.
Between 5 and about 7.5 microns, the overall trend of the lowest points is relatively flat, showing a slight decrease in brightness. Between about 7.5 and 9 microns, the line shows a relatively steep increase in brightness. Between about 9 and 14 microns, the line slopes downward, indicating a decrease in brightness. At about 14 microns, the line begins to rise slowly, showing a subtle increase in brightness until about 19 microns, where it decreases slightly till the right end of the graph at 26 microns.
Three sections of the graph, set off by dark purple backgrounds, are pulled out and magnified above the graph, extending toward the top.
The first pullout above this graph highlights a section with the label “Methane.” This appears over a brighter purple background and highlights a section of the chart roughly around 7 microns, where a minor peak is present. The specific area where methane is detected appears at the center and is highlighted with a blue-green bar.
Just after the 10-micron mark, the second pullout highlights and labels ammonia across a slightly wider range in two sections. The two ammonia detections are highlighted by yellow bars, and show similar short peaks in a row.
The third pullout, which appears between around 13 and just after the 15-micron mark, highlights three molecules. Acetylene is highlighted and labeled with a red bar, and the data show a minor peak. Hydrogen cyanide is highlighted and labeled in a brighter purple, and shows several minor peaks that are lower than acetylene. Carbon dioxide is highlighted by a green bar at right, with a single high peak about as tall as the acetylene peak.
At the top right corner of the graphic is a small image of a circular protoplanetary disk. Its center point is yellow and fades to orange before the first purple circle appears, about a third of the way out. Wider orange rings alternate with thinner purple rings along the disk’s outer circles, showing gaps in the disk. The disk ends in a haze that disappears into the purple background of the graphic.
Image Alt Text
Graphic of a simulated spectrum of a protoplanetary disk shows a wide line graph at the bottom, and three sections that pop out to highlight specific portions in better detail.
- Release DateSeptember 22, 2021
- Science ReleaseNASA’s Webb to Explore Forming Planetary Systems
- CreditNASA, ESA, CSA; Artwork: Leah Hustak (STScI)
Related Images & Videos
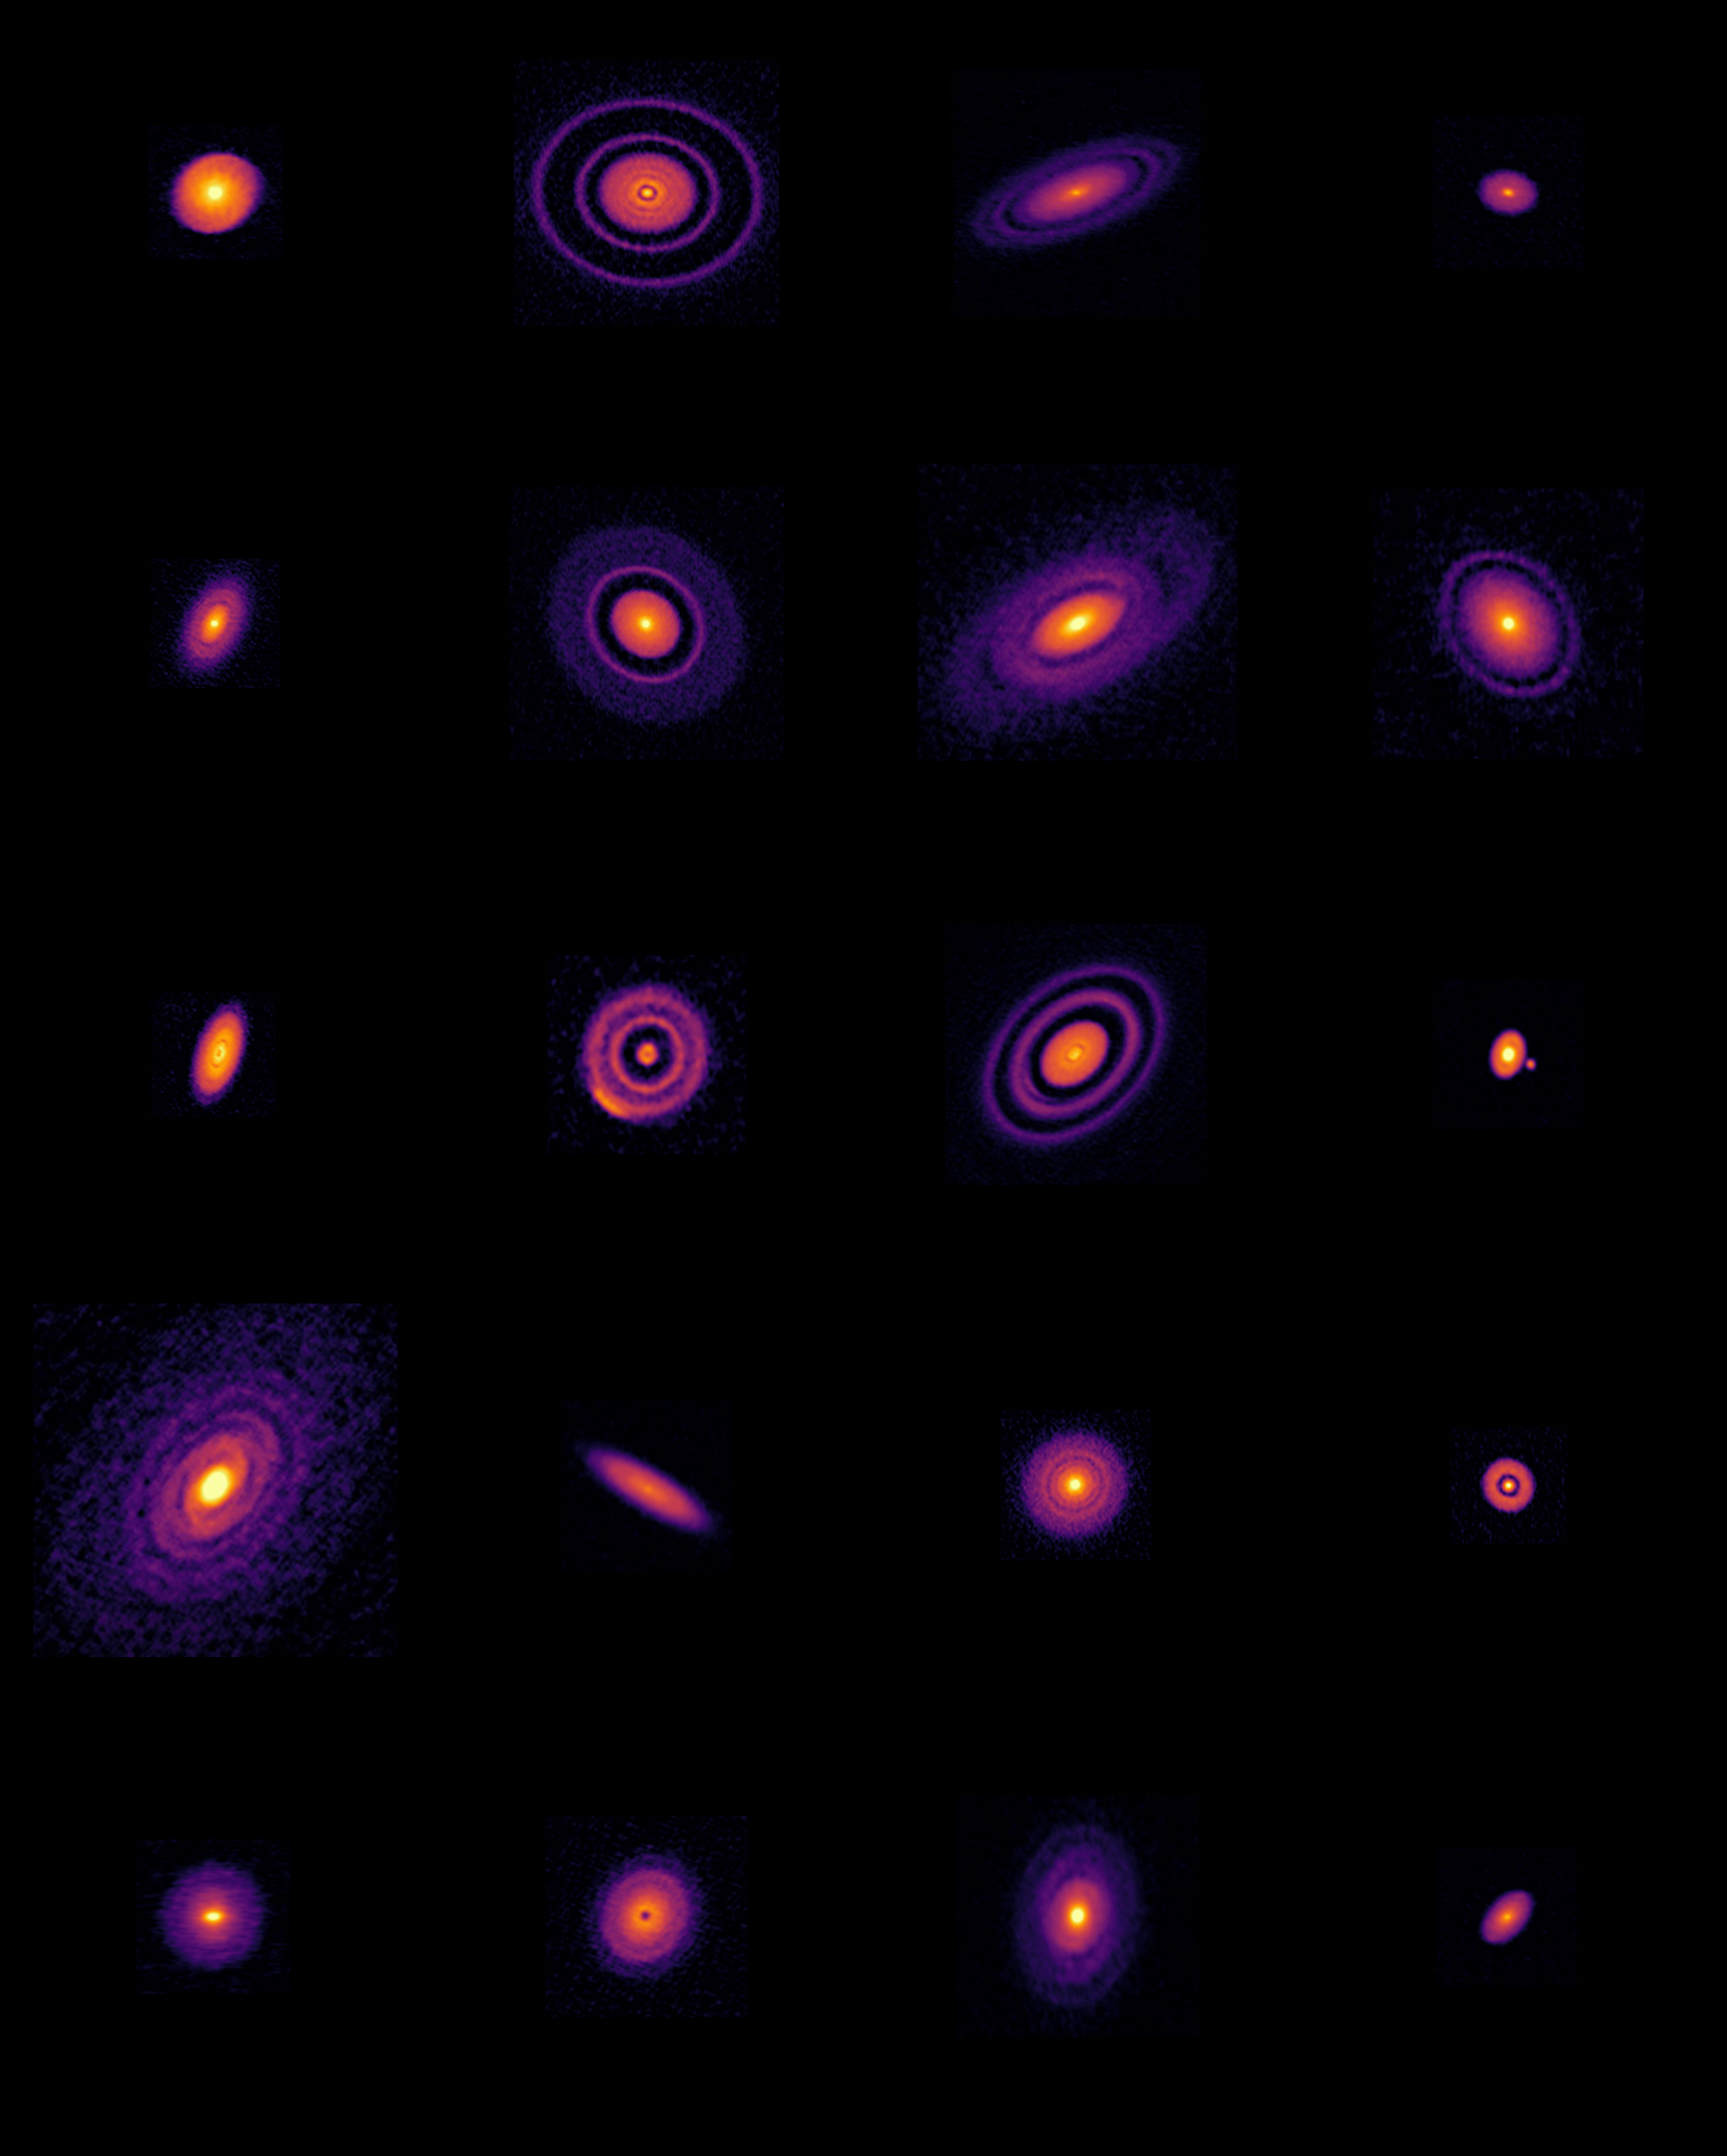
ALMA's Survey of Protoplanetary Disks
The researchers will use NASA’s James Webb Space Telescope to survey 17 of the 20 nearby protoplanetary disks observed by Chile’s Atacama Large Millimeter/submillimeter Array (ALMA) in 2018 for its Disk Substructures at High Angular Resolution Project (DSHARP). ALMA delivered...
Share
Details
Laura Betz
NASA’s Goddard Space Flight Center
Greenbelt, Maryland
laura.e.betz@nasa.gov
NASA, ESA, CSA
Leah Hustak (STScI)


