


1 min read
Spectrum of the Star Altair
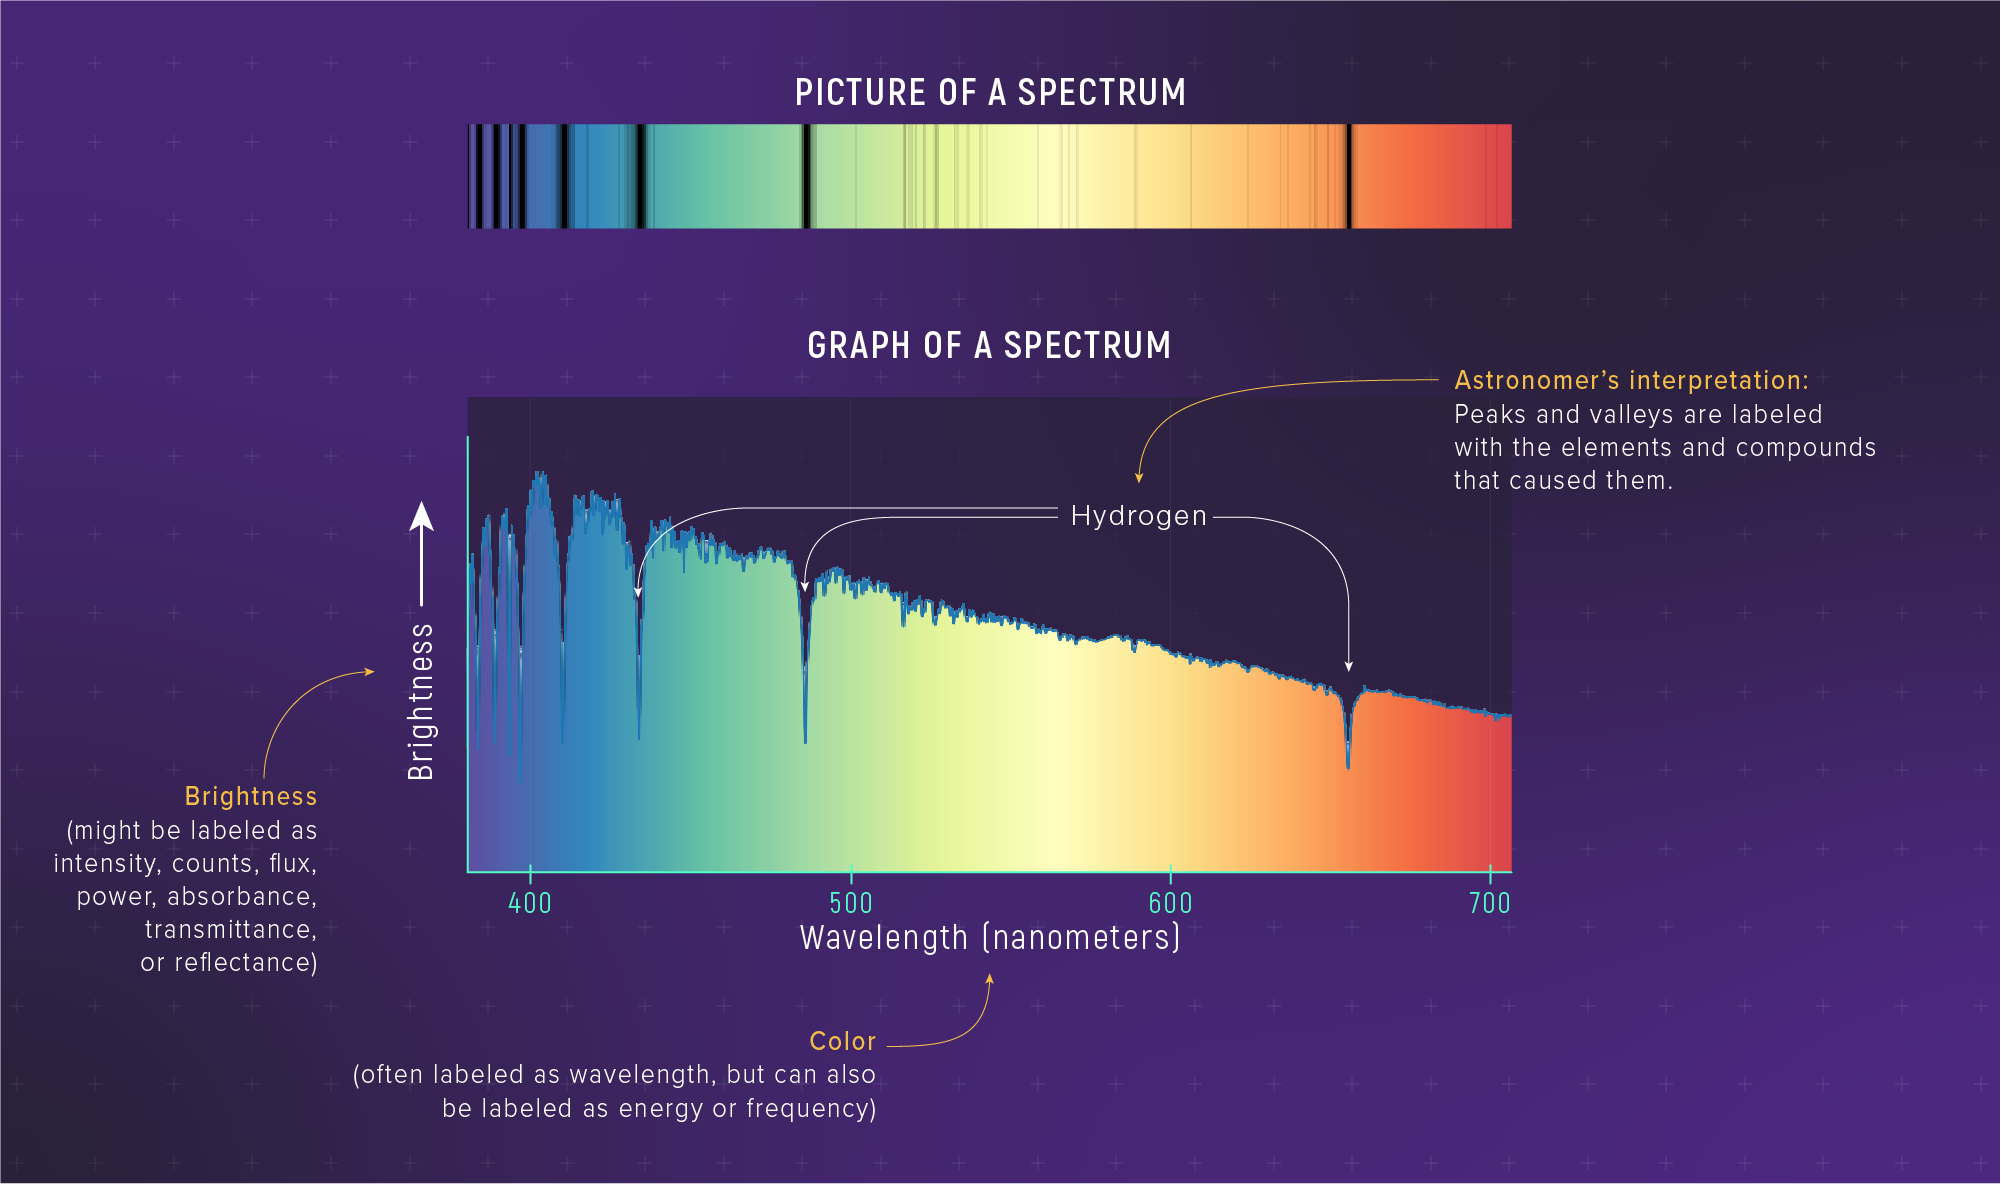
Light from a star can be separated into its component colors to form a spectrum. The spectrum reveals details in the brightness of different colors of starlight that are not visible to the naked eye. Detectors in the telescope can measure the precise brightness of individual wavelengths. Those data can be plotted on a graph of brightness vs. wavelength. Astronomers can then use the graph to make inferences about the temperature, composition, motion, and other characteristics of the star. Our understanding of the composition, temperature, and motion of Altair is based on its spectrum.
Share
Details
Last Updated
Aug 28, 2025
Contact
Media
Laura Betz
NASA’s Goddard Space Flight Center
Greenbelt, Maryland
laura.e.betz@nasa.gov
Illustration Credit
NASA, ESA, CSA, Leah Hustak (STScI)


