


October 8, 2019
A Flash Drought Dries the Southeast
When you hear the word “drought”, lack of rain probably comes to mind. But it is not only lack of rain that has put farmers in the U.S. Southeast in the grips of a damaging drought this fall.
Bouts of unusually warm temperatures, lots of sun, low humidity, and windy conditions can also come together to dry out soil surprisingly quickly, explained Christopher Hain, a scientist at NASA’s Marshall Space Flight Center in northern Alabama. So quickly, in fact, meteorologists have coined a term—flash drought—to describe these fast-moving events.
A stubborn ridge of high-pressure air hung over the Southeast for several weeks in September, bringing record-breaking temperatures, dry air, and very little rain. “We had a wet spring in the Southeast, so we went from no drought to severe drought within about four weeks,” said Hain. “Iâm hearing about farmers losing cotton, hay, and other forage crops. We are even seeing trees browning in certain areas.”
Other categories of drought can take much longer to develop. For instance, hydrological drought—like the one that made news in California in recent years—are defined by drops in groundwater levels, reservoirs, and stream flow that tend to span several months or years.
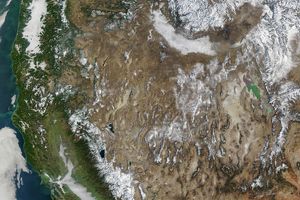
The maps above highlight the rapid onset of drought conditions (brown). The first map shows conditions between July 16 and August 13, before the flash drought. The second map shows the period between September 10 and October 8, the peak of the drought. Rainstorms in recent weeks have lessened drought conditions somewhat.
The maps show Evaporative Stress Index (ESI) data, a drought indicator based on observations of land surface temperatures from National Oceanic and Atmospheric Administration geostationary satellites and on observations of leaf area index from NASA’s Terra and Aqua satellites and the Visible Infrared Imaging Radiometer Suite (VIIRS) on Suomi NPP. The combination makes it possible to gauge evapotranspiration—how much water is evaporating from the land surface and from the leaves of plants.
“One of the issues with flash droughts is that they come on so quickly that they can get overlooked by policies intended to help farmers weather drought,” said Hain, noting, that eligibility for some crop insurance can be tied to metrics other than the Evaporative Stress Index that don’t always capture the onset of flash droughts.
Other flash droughts that have had major impacts on farmers occurred in the central United States in 2012, in the Southeast in 2016, and in the Northern High Plains in 2017.
References & Resources
- Anderson, M.C. et al. (2011) Evaluation of Drought Indices Based on Thermal Remote Sensing of Evapotranspiration over the Continental United States. Journal of Climate.
- NOAA (2019, October 9) Flash drought engulfs the U.S. Southeast in September 2019. Accessed October 22, 2019.
- Otkin, J.A. et al. (2018) Flash Droughts: A Review and Assessment of the Challenges Imposed by Rapid-Onset Droughts in the United States. Bulletin of the American Meteorological Society.
- Scientific American (2019, October 4) As Temperatures Rise, âFlash Droughtâ Takes Hold across South. Accessed October 22, 2019.
- SERVIR (2019) Evaporative Stress Index. Accessed October 22, 2019.
- The Weather Channel (2019, October 4) Two Rounds of Rain Will Soak the Southâs Flash Drought into the Weekend. Accessed October 22, 2019.
- United States Department of Agriculture (2019) Evaporative Stress Index. Accessed October 22, 2019.
- Wall Street Journal (2019, October 3) âFlash Droughtâ Hits South as Record Heat Continues Into Fall. Accessed October 22, 2019.
NASA Earth Observatory images by Lauren Dauphin using ESI data provided by Christopher Hain. Story by Adam Voiland.