


January 30, 2013
Flooding along the Fitzroy River
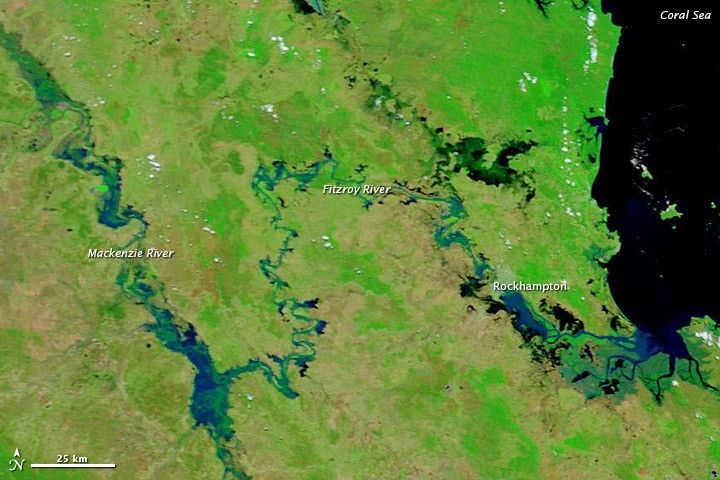
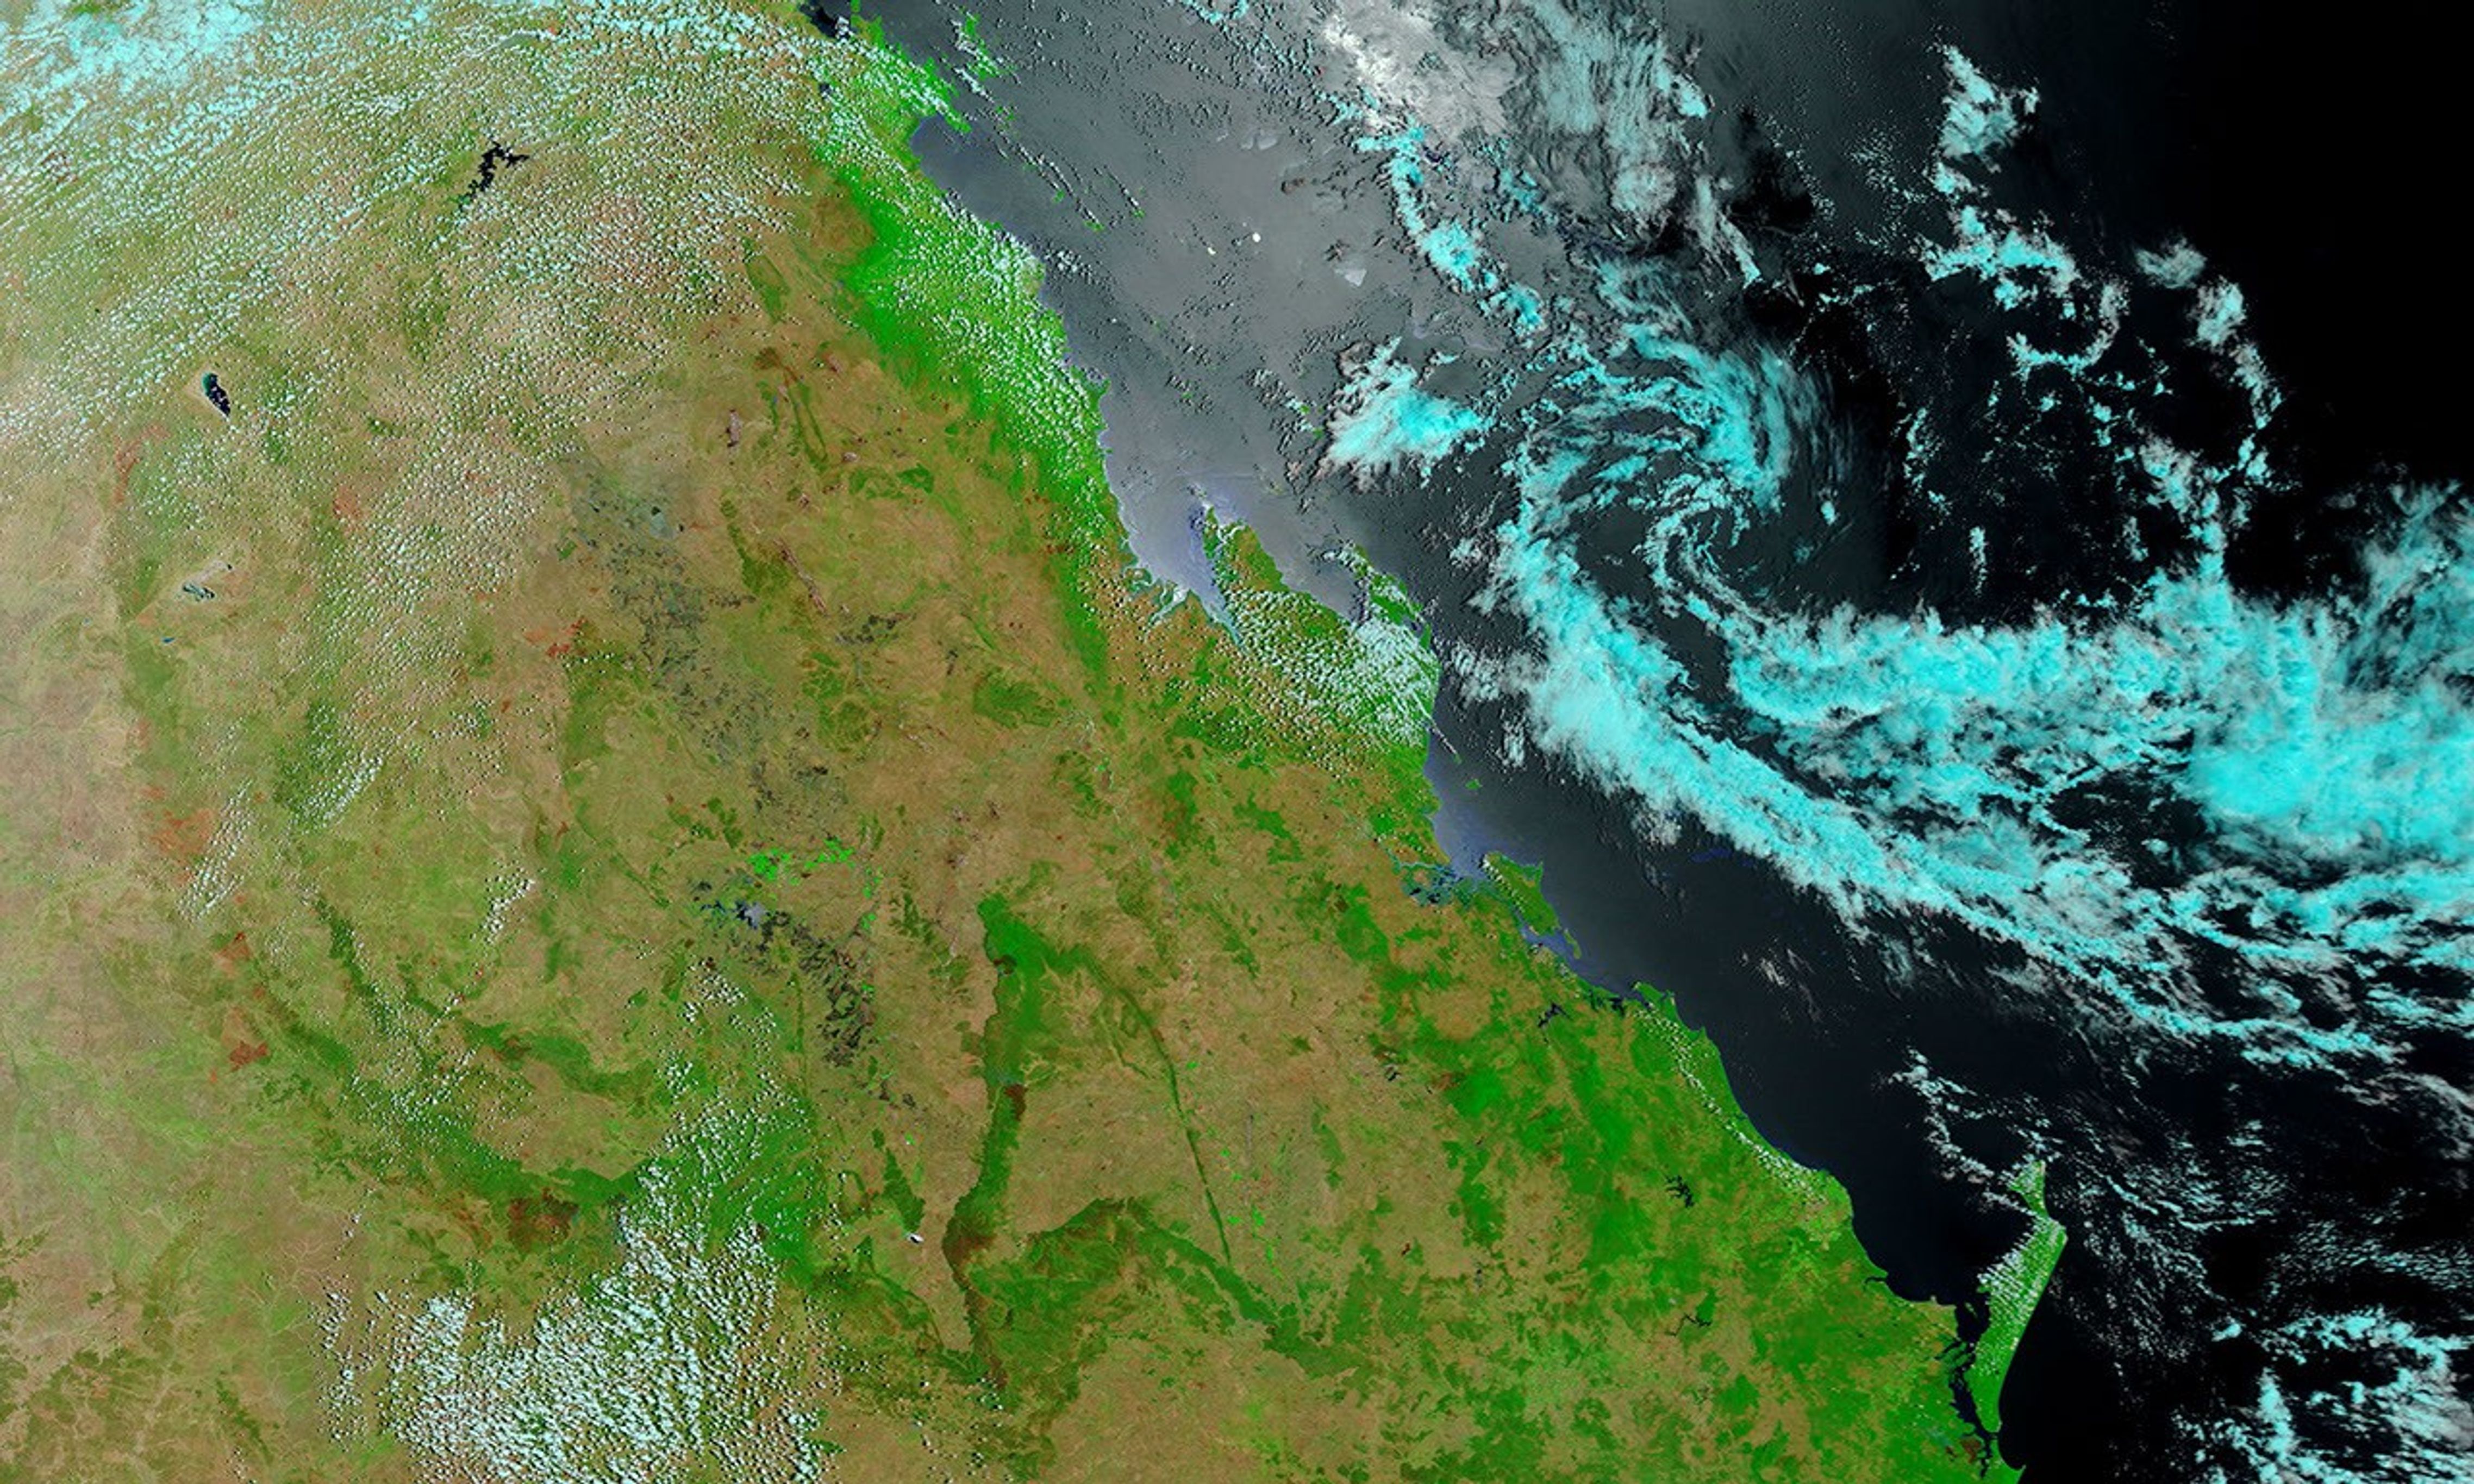
In eastern Queensland, the Mackenzie-Fitzroy River system takes a circuitous route to the coast, finally emptying into the sea near Rockhampton. In late January 2013, flood waters swelled these rivers and their tributaries so much that satellite sensors could easily detect the changes from the sky. The flooding resulted from heavy rains caused by the ex-tropical Cyclone Oswald.
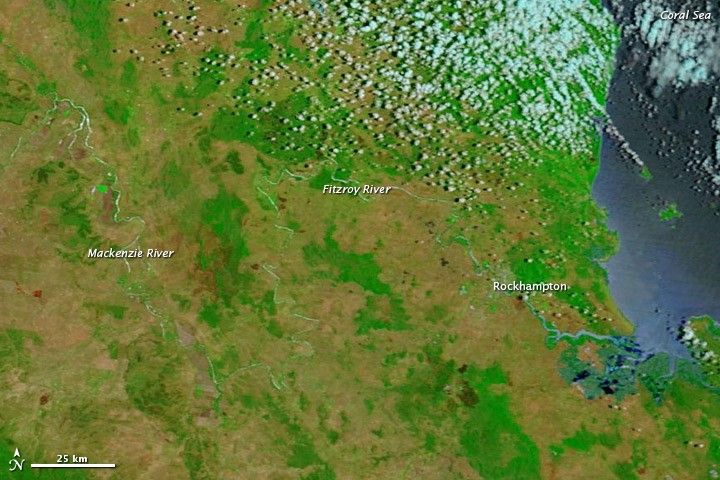
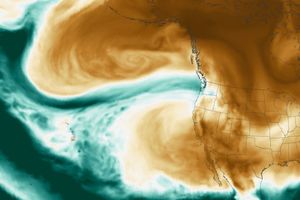
The Moderate Resolution Imaging Spectroradiometer (MODIS) on NASA’s Terra satellite captured the top image on January 30, 2013. For comparison, the bottom image shows relatively normal conditions observed on January 17, 2013. These images use a combination of visible and infrared light to better distinguish between water and land. Water varies in color from electric blue to navy. Vegetation is bright green and bare ground is earth-toned. Clouds are pale blue-green and cast shadows onto the land surface below.
In the image from January 17, upstream of the city of Rockhampton, the rivers are barely discernible. In the image from January 30, higher water levels color the river channels varying shades of blue, and water has spilled onto floodplains at multiple locations along the river system.
On January 31, 2013, the Australian Associated Press (AAP) described the Fitzroy River as “swollen and crocodile infested,” and multiple news sources reported that the flood surge was expected to reach Rockhampton around February 1 or 2, although the January 2013 flooding was not expected to be as severe as the floods that struck in 2011. On January 30, the AAP reported that the death toll from the latest round of floods had risen to six.
The January 30 image above shows not only higher water levels but also more extensive greenness compared to January 17. The greater degree of green may result from a difference in the angle of the satellite sensor, but may also reflect a green-up from new precipitation. Before Oswald brought heavy rains and floods to the region, large stretches of eastern Australia were suffering from rainfall deficiencies.
References & Resources
- Australian Government Bureau of Meteorology. (2013, January 4) Rainfall deficiencies expand in eastern Australia. Accessed January 31, 2013.
- Johnson, S., AAP. (2013, January 31) “Business as usual” despite rise in river. News.com.au. Accessed January 31, 2013.
- The Morning Bulletin. (2013, January 31) 1100 properties to be affected when Fitzroy River peaks. Accessed January 31, 2013.
- Robinson, P. (2013, January 30) Fitzroy River continues rising amid “sea of water.” ABC Australia. Accessed January 31, 2013.
NASA images courtesy LANCE MODIS Rapid Response. Caption by Michon Scott.


