


June 28-November 18, 2022
More Flooding in Australia’s Soggy Southeast
After an extremely wet October, southeast Australia continued to see heavy rainfall in November 2022. With soils already saturated and dams full, the latest storms have added to ongoing flooding across New South Wales and Victoria.
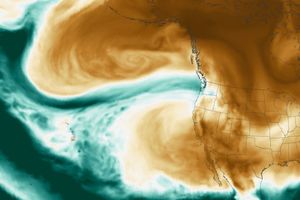
Widespread flooding is visible in this false-color image (right) acquired on November 18, 2022, with the Moderate Resolution Imaging Spectroradiometer (MODIS) on NASA’s Terra satellite. Water appears light to dark blue. Vegetation is green and bare land is brown. For comparison, the MODIS image from the Aqua satellite (left) shows the same area on June 28, 2022, prior to the excessive rainfall.
In the week leading up to November 14, large parts of New South Wales and Victoria saw more than 50 millimeters of rain (2 inches). The town of Forbes, New South Wales, had the highest daily total for the week. It saw 118 millimeters (4.6 inches) fall in a 24-hour period spanning November 13–14. The abundant rain across the region caused rivers to rise and flood nearby towns. Forbes saw its third major flood event in just four weeks as waters on the Lachlan River rose faster than expected.
October 2022 was the wettest October on record in the Murray-Darling basin, an area that includes the permanent and impermanent rivers and streams pictured above. With soils already saturated, rainfall in November quickly led to flash flooding across New South Wales and Victoria. Emergency responders have rescued hundreds of people stranded by flood waters across the region.
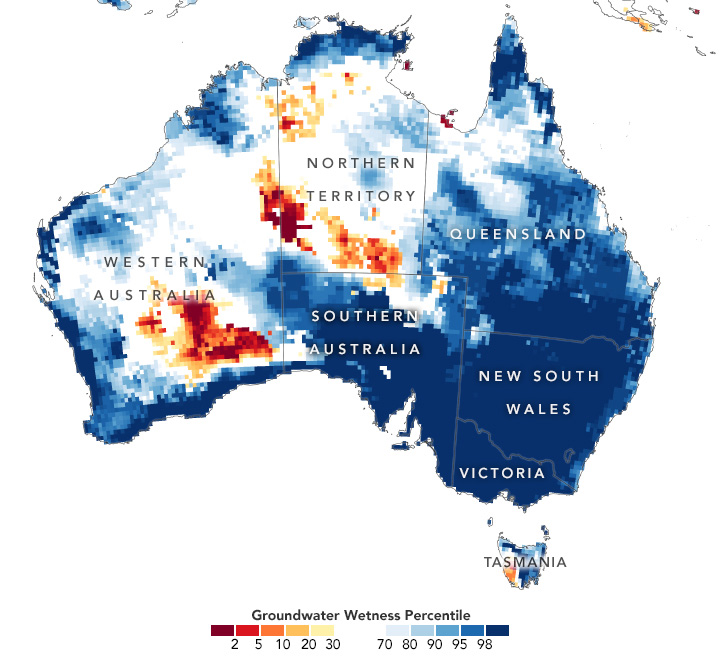
Water that seeps deep into the soil can influence groundwater levels for months. The map above depicts shallow groundwater storage in Australia from November 11–14, 2022, as measured by the Gravity Recovery and Climate Experiment Follow-On (GRACE-FO) satellites. The colors depict the wetness percentile; that is, how the levels of groundwater compare to long-term records (1948–2012). Blue areas have more abundant water than usual, and orange and red areas have less.
The extent to which such rainfall affects the groundwater level varies by location and depends on a range of factors such as soil type, aquifer depth, and vegetation. Time is also a factor, as rainfall accumulations from months past can influence current groundwater levels.
One reason for the wetness is likely La Niña, which has returned for three consecutive years. La Niña events can influence weather in different ways across the planet. In Australia, it usually means heavy rainfall and flooding.
References & Resources
- ABC News (2022, November 14) Thousands stranded in homes as flash flooding batters Central West NSW, Wyangala Dam spills at record rate. Accessed November 18, 2022.
- Australian Government Bureau of Meteorology (2022, November 18) Recent rainfall station totals. Accessed November 18, 2022.
- Floodlist (2022, November 14) Australia—Hundreds Rescued, Towns Isolated After More Floods in New South Wales. Accessed November 18, 2022.
- The Guardian (2022, November 15) Why is so much of Australia flooding right now? Accessed November 18, 2022.
- World Meteorological Organization (2022, August 31) WMO predicts first “triple-dip” La Niña of the century. Accessed November 18, 2022.
NASA Earth Observatory images by Lauren Dauphin, using MODIS data from NASA EOSDIS LANCE and GIBS/Worldview and GRACE data from the National Drought Mitigation Center . Story by Kathryn Hansen .