


Though it is not yet as bad as the drought that struck New England in 1965, meteorologists are calling the current drought in the Northeast the worst dry spell in more than a decade. For much of the summer of 2016, a high-pressure ridge has lingered over the Southeastern United States and steered storms farther north than usual. This has left New York and much of New England parched. Many parts of New England have received only half the normal amount of rainfall.
The hot, dry weather has started to take a toll. Hundreds of cities and towns have issued either voluntary or mandatory restrictions on water use. Farmers throughout New England report that crops and businesses are under stress. Several counties have been declared natural disaster zones, and at least one state—Massachusetts—has set up a “micro-loan” program to help farmers struggling with the drought.
Though drought may seem conceptually simple, there are several different approaches that meteorologists use to identify, track, and categorize droughts. The widely used Standardized Precipitation Index (SPI), is based entirely on precipitation data. Other methods, such as the Palmer Drought Severity Index (PDSI), use a combination of precipitation and temperature observations. Another useful dataset is the Normalized Difference Vegetation Index (NDVI), which shows the degree to which plants and crops are withering as a result of dry weather. Stream flow, reservoir heights, and measures of groundwater are also important sources of information that researchers with the National Drought Mitigation Center use to map the severity of drought in the continental United States on a weekly basis.
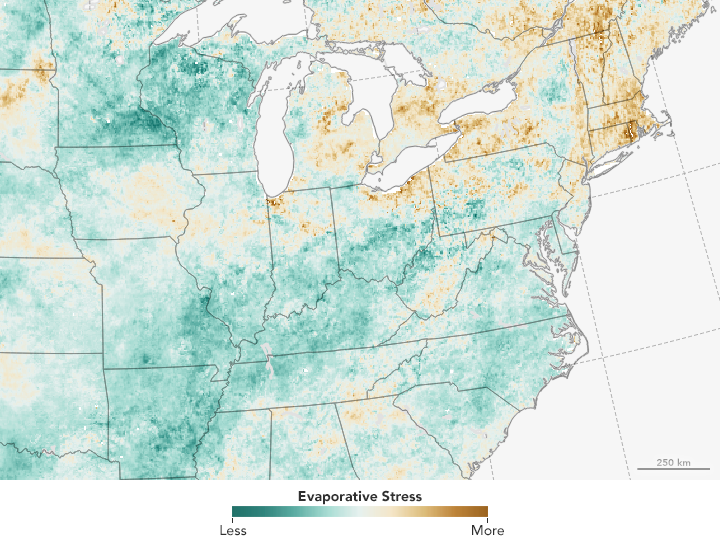
Another, newer option for tracking drought is the Evaporative Stress Index (ESI)—an indicator based on observations of land surface temperatures from National Oceanic and Atmospheric Administration’s geostationary satellites and on observations of leaf area index from NASA’s Terra and Aqua satellites. The combination makes it possible to gauge evapotranspiration—how much water is evaporating from the land surface and from the leaves of plants. Measuring evapotranspiration is useful because unusually low evapotranspiration is an early indicator that plants are facing stress—even if the leaves have not wilted or turned brown yet.
The map above shows that much of New England, New York, and New Jersey have endured great evaporative stress over the past 12 weeks. The drought has been particularly severe in eastern Massachusetts, an area that has seen one of its driest summers on record.
“The Evaporative Stress Index is useful because it provides an independent assessment of drought that is not based on precipitation,” said Christopher Hain, a University of Maryland scientist who helped develop ESI. “It does a particularly good job of capturing of “flash droughts” and “agricultural droughts” that are driven by how much water plants are taking up. It can also capture how irrigation affects conditions on the ground, which measures based purely on precipitation cannot.”
References & Resources
- Anderson, M.C. et al. (2011) Evaluation of drought indices based on thermal remote sensing of evapotranspiration over the continental United States. Journal of Climate, 24(8):2025-2044.
- Climate Central (2016, September 6) New England is Wicked Dry Right Now. Accessed September 12, 2016.
- National Drought Mitigation Center (2016, September 6) U.S. drought coverage decreases during August, but intensifies in Northeast. Accessed September 12, 2016.
- National Integrated Drought Information System (2016, September 9) U.S. Drought Portal. Accessed September 12, 2016.
- National Oceanic and Atmospheric Administration (2016, September 9) Drought - July 2016. Accessed September 12, 2016.
- New England Historical Society (2016, August 30) The 1965 Drought, New England’s Worst Ever. Accessed September 12, 2016.
- NECN (2016, September 1) Driest Summer on Record as Extreme Drought Worsens. Accessed September 12, 2016.
- NPR (2016, August 30) Northeast Farmers Grapple With Worst Drought In More Than A Decade. Accessed September 12, 2016.
- The Boston Globe (2016, September 8) State sets up $1m fund to help farms, businesses hit by drought. Accessed September 12, 2016.
- United States Department of Agriculture (2016) Evaporative Stress Index. Accessed September 12, 2016.
NASA Earth Observatory map by Joshua Stevens, using ESI data courtesy of the USDA Hydrology and Remote Sensing Lab . Caption by Adam Voiland.
None