


On December 24, 2004, Caltech geology student Aron Meltzner was on winter break in Australia. Yes, he was technically on vacation—snorkeling, seeing a coral reef for the first time—but he was also trying to make an important decision. He had just wrapped up the first phase of his Ph.D. program, and now it was time for him to pick the research topic that would be the centerpiece of his doctorate degree. He had just about made up his mind that he would study coral and sediments near the Mentawai Islands off the coast of Sumatra to help extend the historical record of earthquakes and tsunamis there.

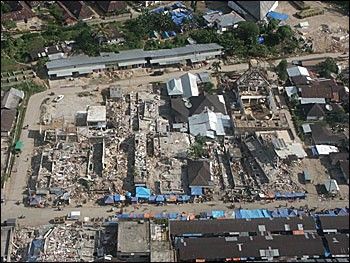
But on December 26, 2004, his plans changed. On that day, one of the largest earthquakes in recorded history struck offshore of the island of Sumatra, Indonesia. The edges of the Indo-Australia and Burma tectonic plates came violently unglued, and the Burma microplate lurched west-southwest more than 20 meters in places. The ocean floor heaved in some places and sank in others, creating catastrophic tsunamis that raced across the Indian Ocean. Hundreds of thousands of people died as the waves struck coastlines from Thailand to Sri Lanka to Somalia. Meltzner knew that whatever research plans he had before, they were going on hold. Instead, he wanted to be part of the effort to understand the largest quake to have occurred so far in his lifetime.
Meltzner quickly discovered that earthquake scientists were having trouble pinning down even the most basic details of the quake—magnitude, how big an area ruptured, and how far the earth moved. In addition to the magnitude, which seismologists repeatedly revised in the days and weeks following the quake, estimates of the length of the rupture varied widely. It was this problem that caught Meltzner’s attention.
“In the first few weeks after the quake,” Meltzner explains, “the seismologists were having a real tough time figuring out how big the rupture was. The very earliest reports were that it was about 400 kilometers long. Within a couple days, we saw reports of 600, maybe 700. Figuring out the length of the rupture is important because it helps us identify where there are patches [of the fault] that hadn’t ruptured, and that is important to know because that’ll tell you, possibly, where near-future earthquakes might happen.”
Part of the challenge was that the entire rupture didn’t happen instantaneously. Instead, the earth split like a zipper, progressing from south to north over several minutes. The seismic waves radiating from the southern part of the rupture were so intense that they essentially drowned out the waves from the northern portion. So when seismologists tried to trace the waves back to their point of origin, it was hard for them to tell how far north along the fault the rupture went.
A second problem was the lack of Global Positioning System (GPS) monuments in the region. GPS receivers pinpoint the precise location of a spot on Earth by integrating information from multiple satellites about their distance from the receiver. Scientists use GPS data to figure out how much the earth rose, sank, or shifted during a quake. Previous field research campaigns had installed about a dozen GPS monuments in the Andaman and Nicobar Islands, which stretch over about 700 kilometers northwest of Sumatra. “That’s as sparse as anywhere where someone has attempted to install a network,” says Meltzner. “Japan, although about twice the size, has more than a thousand.”
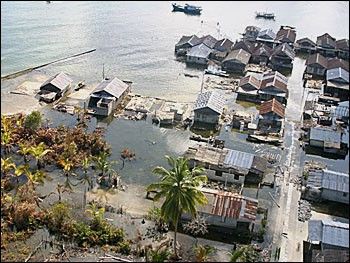
As it turned out, the uncertainties in the seismic data and the region’s skimpy GPS network opened the door for some unconventional thinking about how to study earthquakes. When Meltzner returned to school in early January 2005, people were trickling back to campus after winter break. Scientists in his department started to give presentations about the quake, and some of them showed satellite imagery of affected areas. In addition to coastlines stripped of vegetation and strewn with debris from the tsunamis, some images hinted at dramatic changes in the elevation of reefs and islands.
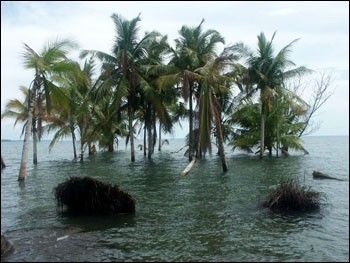
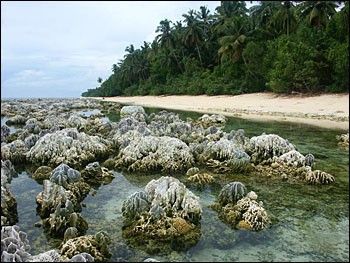
In some locations, beaches seemed wider, and reefs more exposed. In others, the sea appeared to have swallowed reefs and shorelines, and water was ponded on land that was previously dry. When a megathrust subduction zone (a large area where one plate grinds beneath another) ruptures in an earthquake, the regions above the fault move up or down depending upon their position relative to the rupture. Meltzner realized that the images might be showing uplift and subsidence (sinking) from the quake; if enough of these changes were visible from space, he could use them to map the length of the rupture.
Comparing Pre- and Post-Quake Images
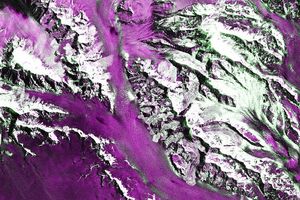
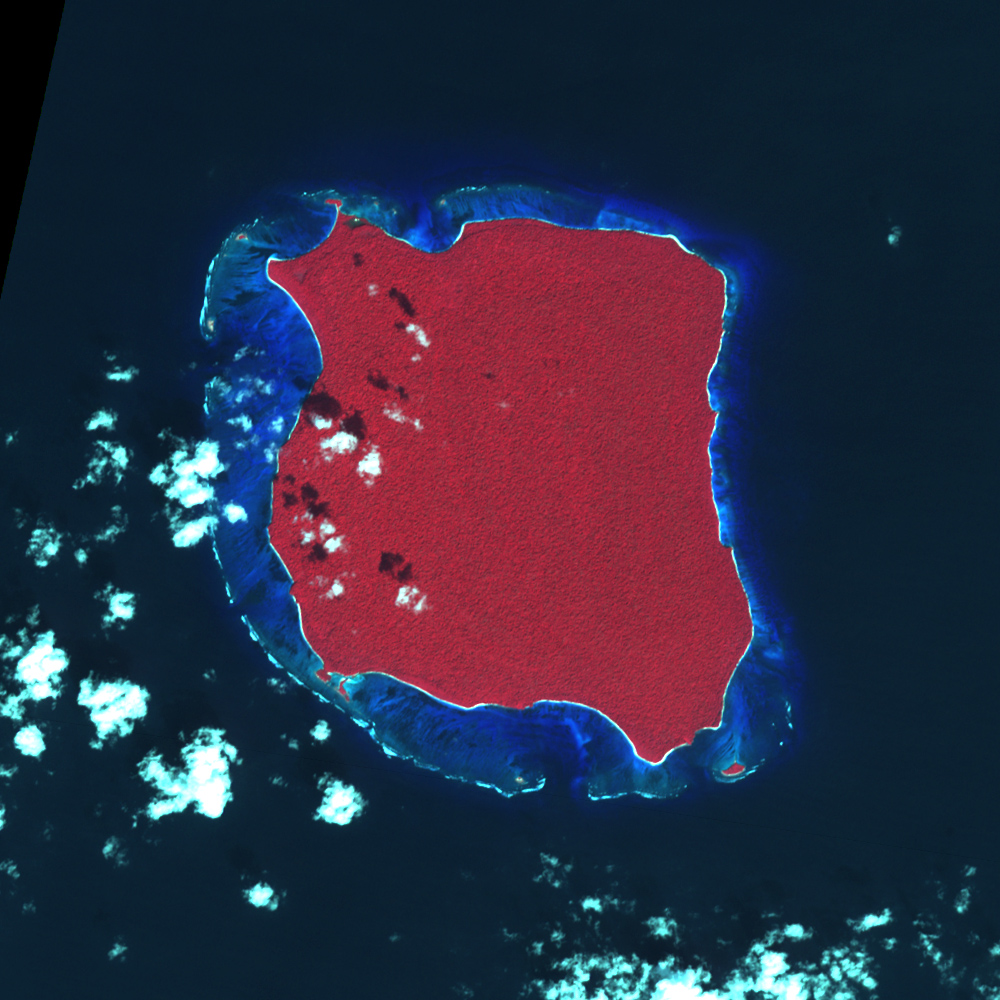
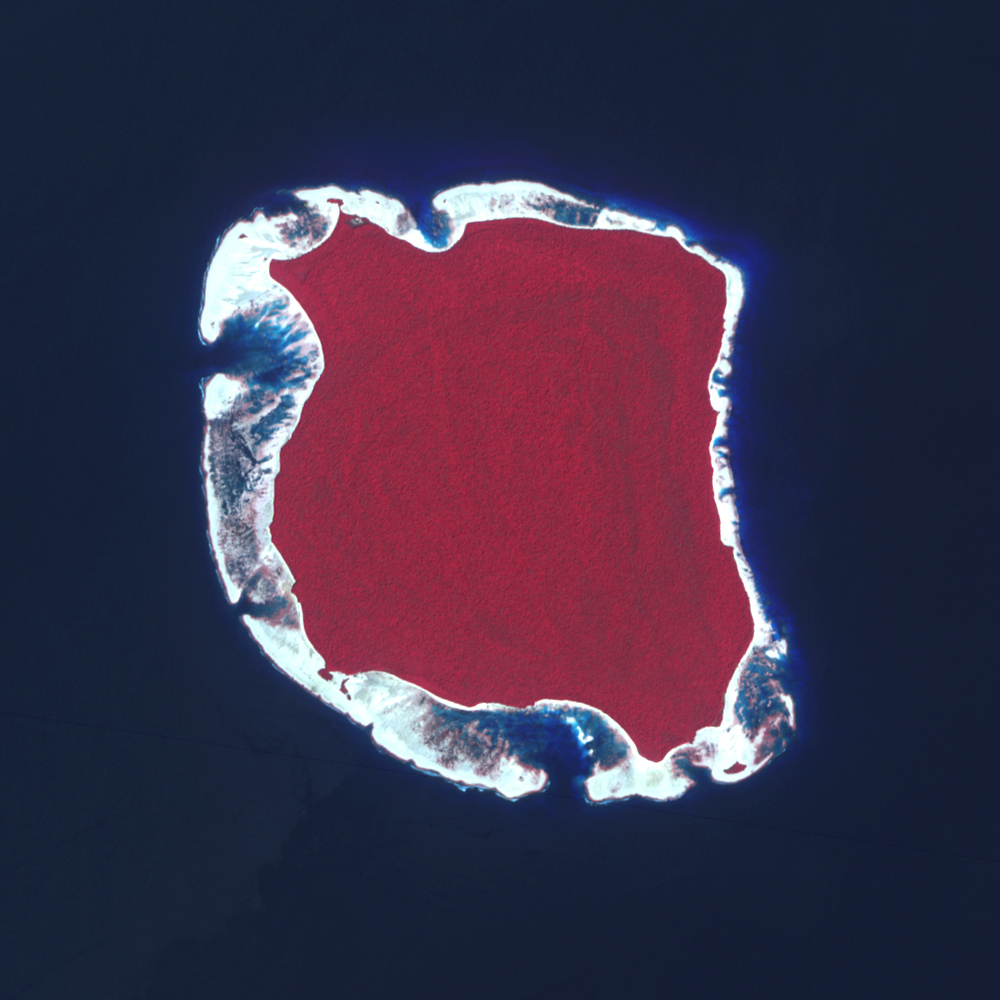
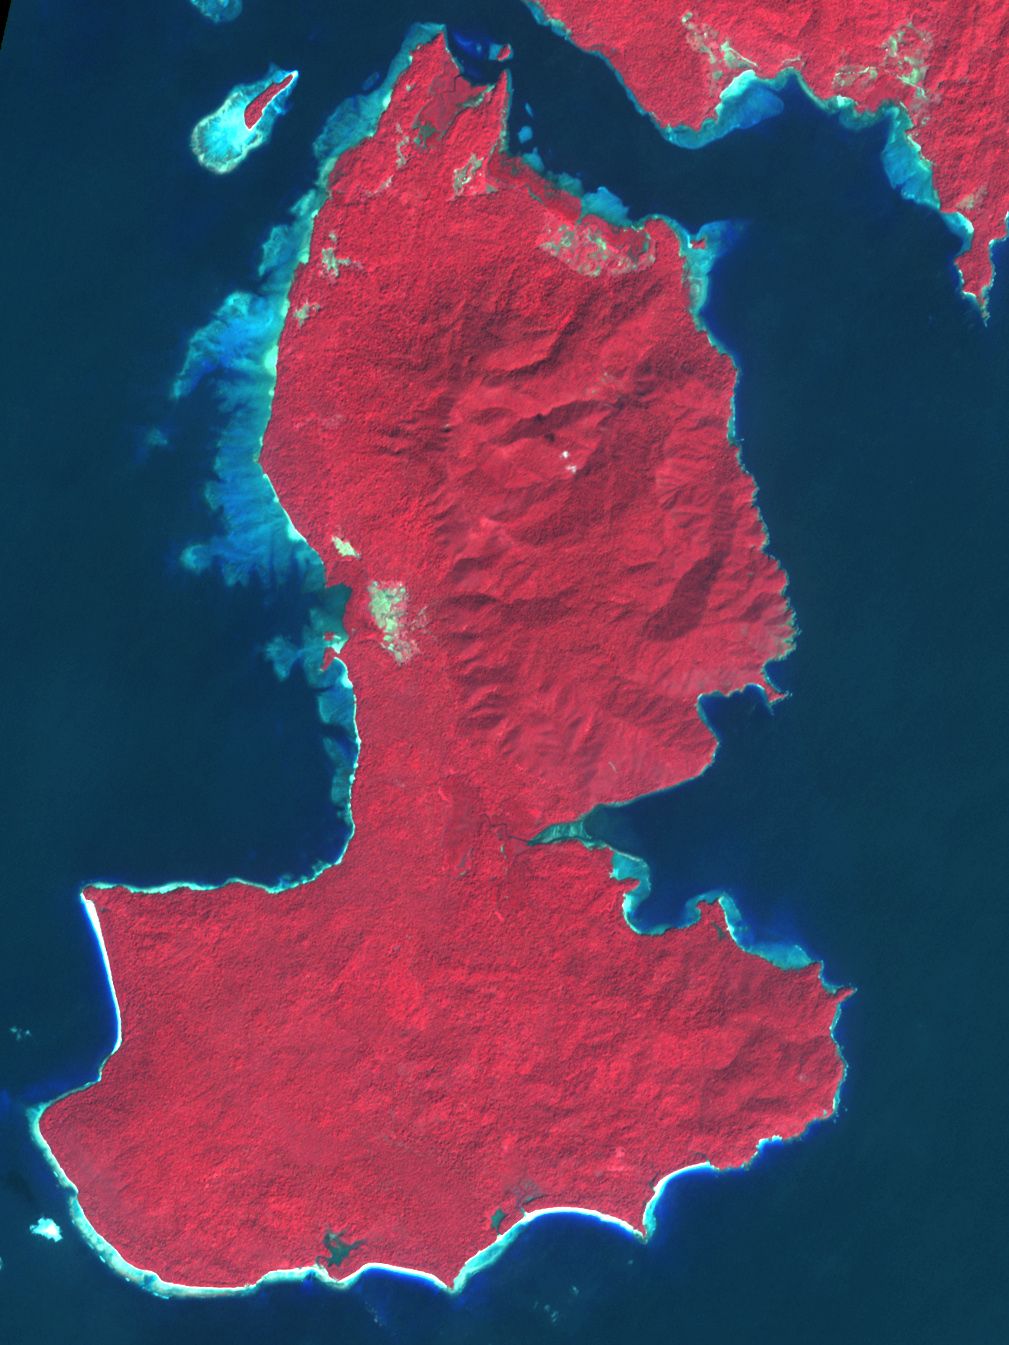
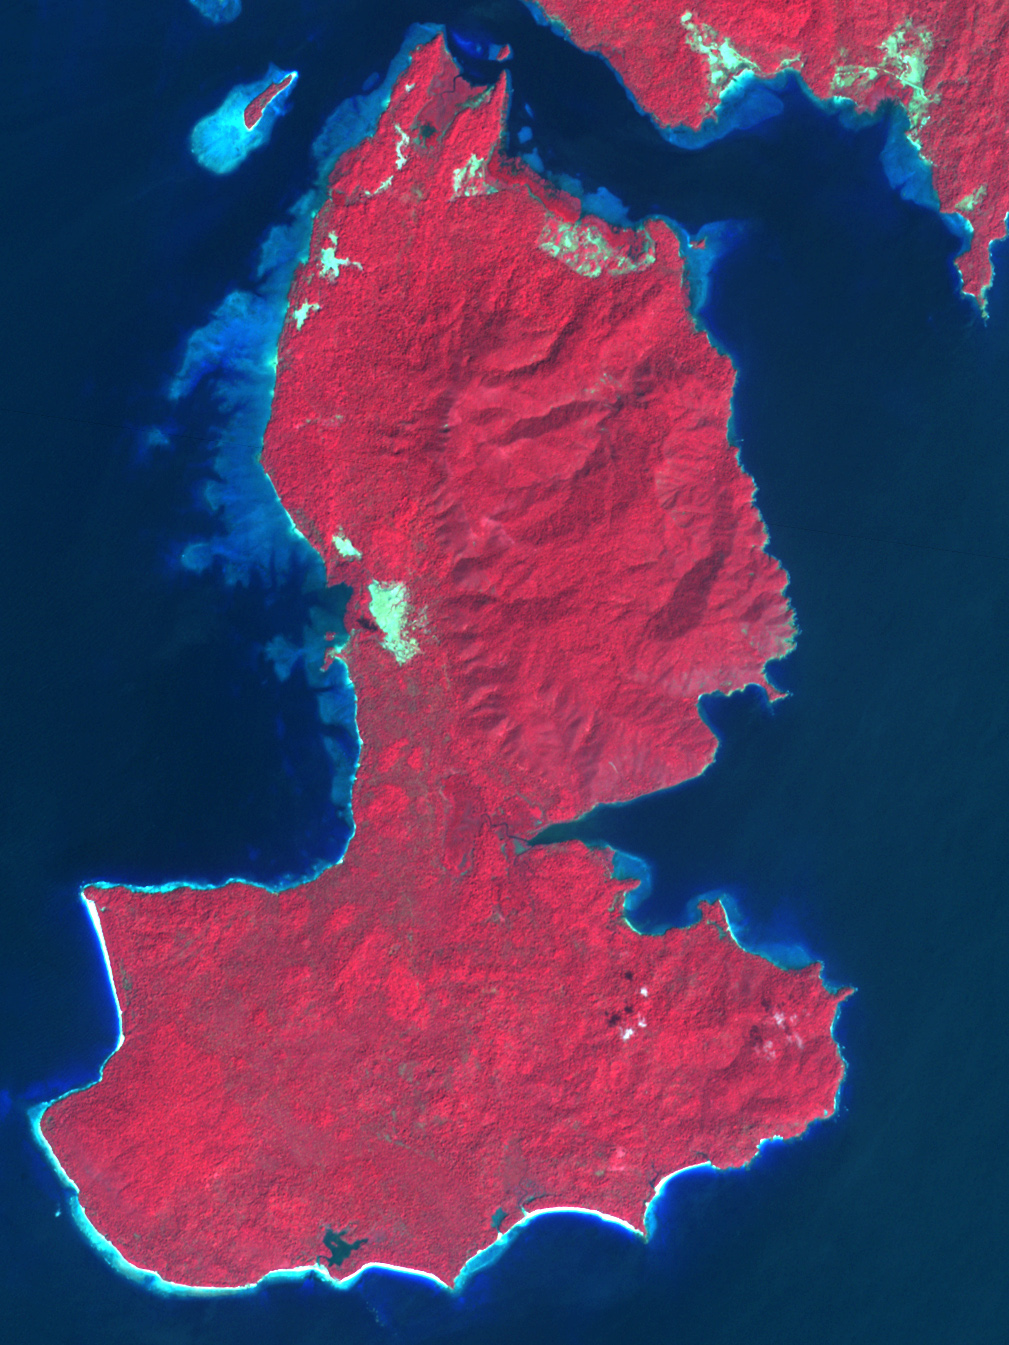
Colleagues in the Caltech Division of Geological and Planetary Sciences steered him toward remote-sensing scientist Michael Abrams of NASA’s Jet Propulsion Laboratory. Abrams is the lead scientist for a NASA sensor called ASTER, short for Advanced Spaceborne Thermal Emission and Reflection Radiometer. ASTER sees both visible and infrared wavelengths of light. In the ASTER images Meltzner saw, the ocean appeared deep blue. A submerged reef made a bright blue glow in the water. An exposed reef or beach appeared nearly white.
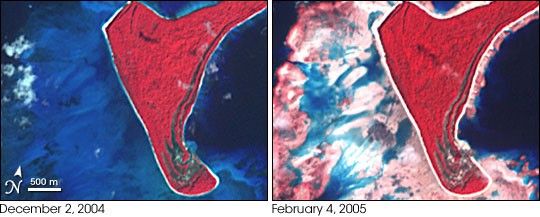

Once he had all the imagery, Meltzner used image-editing software to balance the color in all the images as closely as possible, and then began inspecting them for color change around reefs that would indicate elevation changes. “In some areas, there aren’t any reefs large enough to be recognizable on the 15-meter resolution ASTER images. In those areas—which tended to be on the eastern sides of the larger islands and on the coast of mainland Sumatra—I had to study the images a bit more closely for other signs of elevation changes, such as newly exposed beaches or standing water where no water had stood previously,” Meltzner said. In all, he compared before and after imagery for 160 locations along the fault.
Some of the differences in the pre- and post-earthquake images seemed dramatic, Meltzner recalls, but he knew he had to be careful. What might appear to be an earthquake-related change could simply be natural exposure and inundation of the reef from the tides. To make sure that any apparent changes in water level that they saw in satellite imagery weren’t simply due to tides, Meltzner relied on a computer program that his colleague Duncan Agnew of the Scripps Institution of Oceanography in La Jolla, California, provided. Meltzner could input the location and time of the satellite image, and the program would tell him the level of the tide.

Under normal circumstances, you would expect reefs or beaches to be more exposed in images captured during low tide and more submerged at high tide. To check for quake-related elevation change, Meltzner looked at post-quake images for what you wouldn’t expect: reefs that were more exposed at high tide than they used to be at low tide, or reefs that were more submerged at low tide than they used to be at high tide.
If a reef was more exposed at high tide than it used to be at low tide, it must have been lifted up by the quake. If a reef was more submerged at low tide than it used to be at high tide, then it must have sunk. By subtracting the sea surface heights at the time of the pre-and post-quake images, he could figure out the minimum elevation change that would have been required to expose or submerge the reef in the satellite imagery.

The final picture of the quake documented through these satellite and field observations was astounding. When Meltzner plotted the points of uplift and subsidence on a regional map, he discovered that the rupture extended about 100 kilometers (62 miles) farther north than the initial estimates from seismic and GPS data suggested. In fact, the enormous quake had ruptured the ground all the way from Simeulue Island to Preparis Island. Measured parallel to the arc of the plate boundary, that is a distance of nearly 1,600 kilometers. In the United States, a rupture that long would have stretched from the southern tip of Florida to the Maryland-Pennsylvania state line. In Europe, it would have stretched from the southern tip of Spain to London.
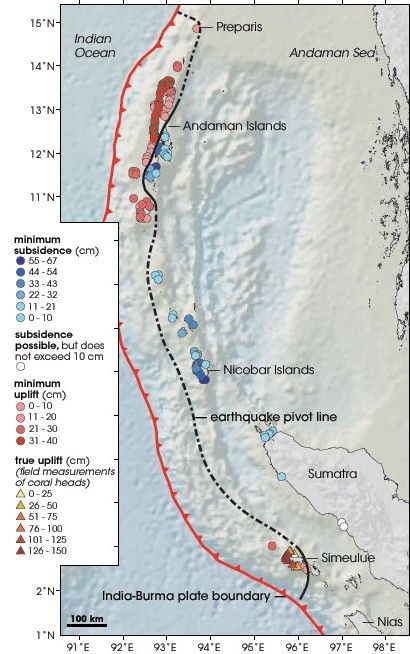
The amounts of uplift and subsidence were dramatic as well. The minimum uplift in the northern part of the Andaman Islands was as much as 40 centimeters (1.3 feet), while the minimum subsidence in the southern part was as much as 67 centimeters (2.2 feet). Farther south, the southern tip of Great Nicobar Island sank more than 44 centimeters (1.4 feet). Physical measurements from coral northwest of Simeulue Island documented uplift of up to 150 centimeters (4.9 feet). Meltzner stresses that the amounts he estimated from satellite data were the minimum elevation change that would have been needed to account for the differences in the pre-and post-quake satellite images, not necessarily the exact elevation change. Later studies found elevation changes of 1 to 2 meters in some places.
Generating New Questions
According to Meltzner, one of the most interesting results of the uplift/subsidence mapping in the region came when he and colleagues combined the results from the 2004 quake with observations from a second quake, which struck in March 2005 just to the south of the 2004 one. “What it looks like,” said Meltzner, “is that the 2004 rupture propagated into Simeulue Island from the north, and then the 2005 rupture propagated into Simeulue from the south. There was about a meter and half of uplift in the north in 2004, and a net of about a meter and half in the south from the 2004 and 2005 quakes combined. But in the middle of Simeulue, on the west coast, there was only a half a meter of uplift. That raised some very intriguing questions about why this saddle, or gap, exists.”
He says there are several possible explanations for the saddle, some more benign than others. It could be that a large earthquake in the recent past had released all the strain between the plates at that location, although the historical records that exist don’t reveal such a quake, so that hypothesis appears unlikely. “Another hypothesis, which is alarming if true,” Meltzner said, “is that we don’t know why it didn’t slip, but now it is ready to.” The third possibility, which Meltzner favors, is that the area may be what they call an “aseismic patch” in the fault, where for whatever reason, the two plates glide past each other without sticking. Little stress builds up, so no big earth movement occurs there.
If the hypothesis about the aseismic patch in the middle of Simeulue proves to be correct, it could be important for predicting future quakes in the area. “It would mean that it is very difficult for earthquakes to pass through that region,” Meltzner explained, “so it would be very difficult to generate an earthquake bigger [in length] than the 2004 earthquake because it would run out of steam at that point.”
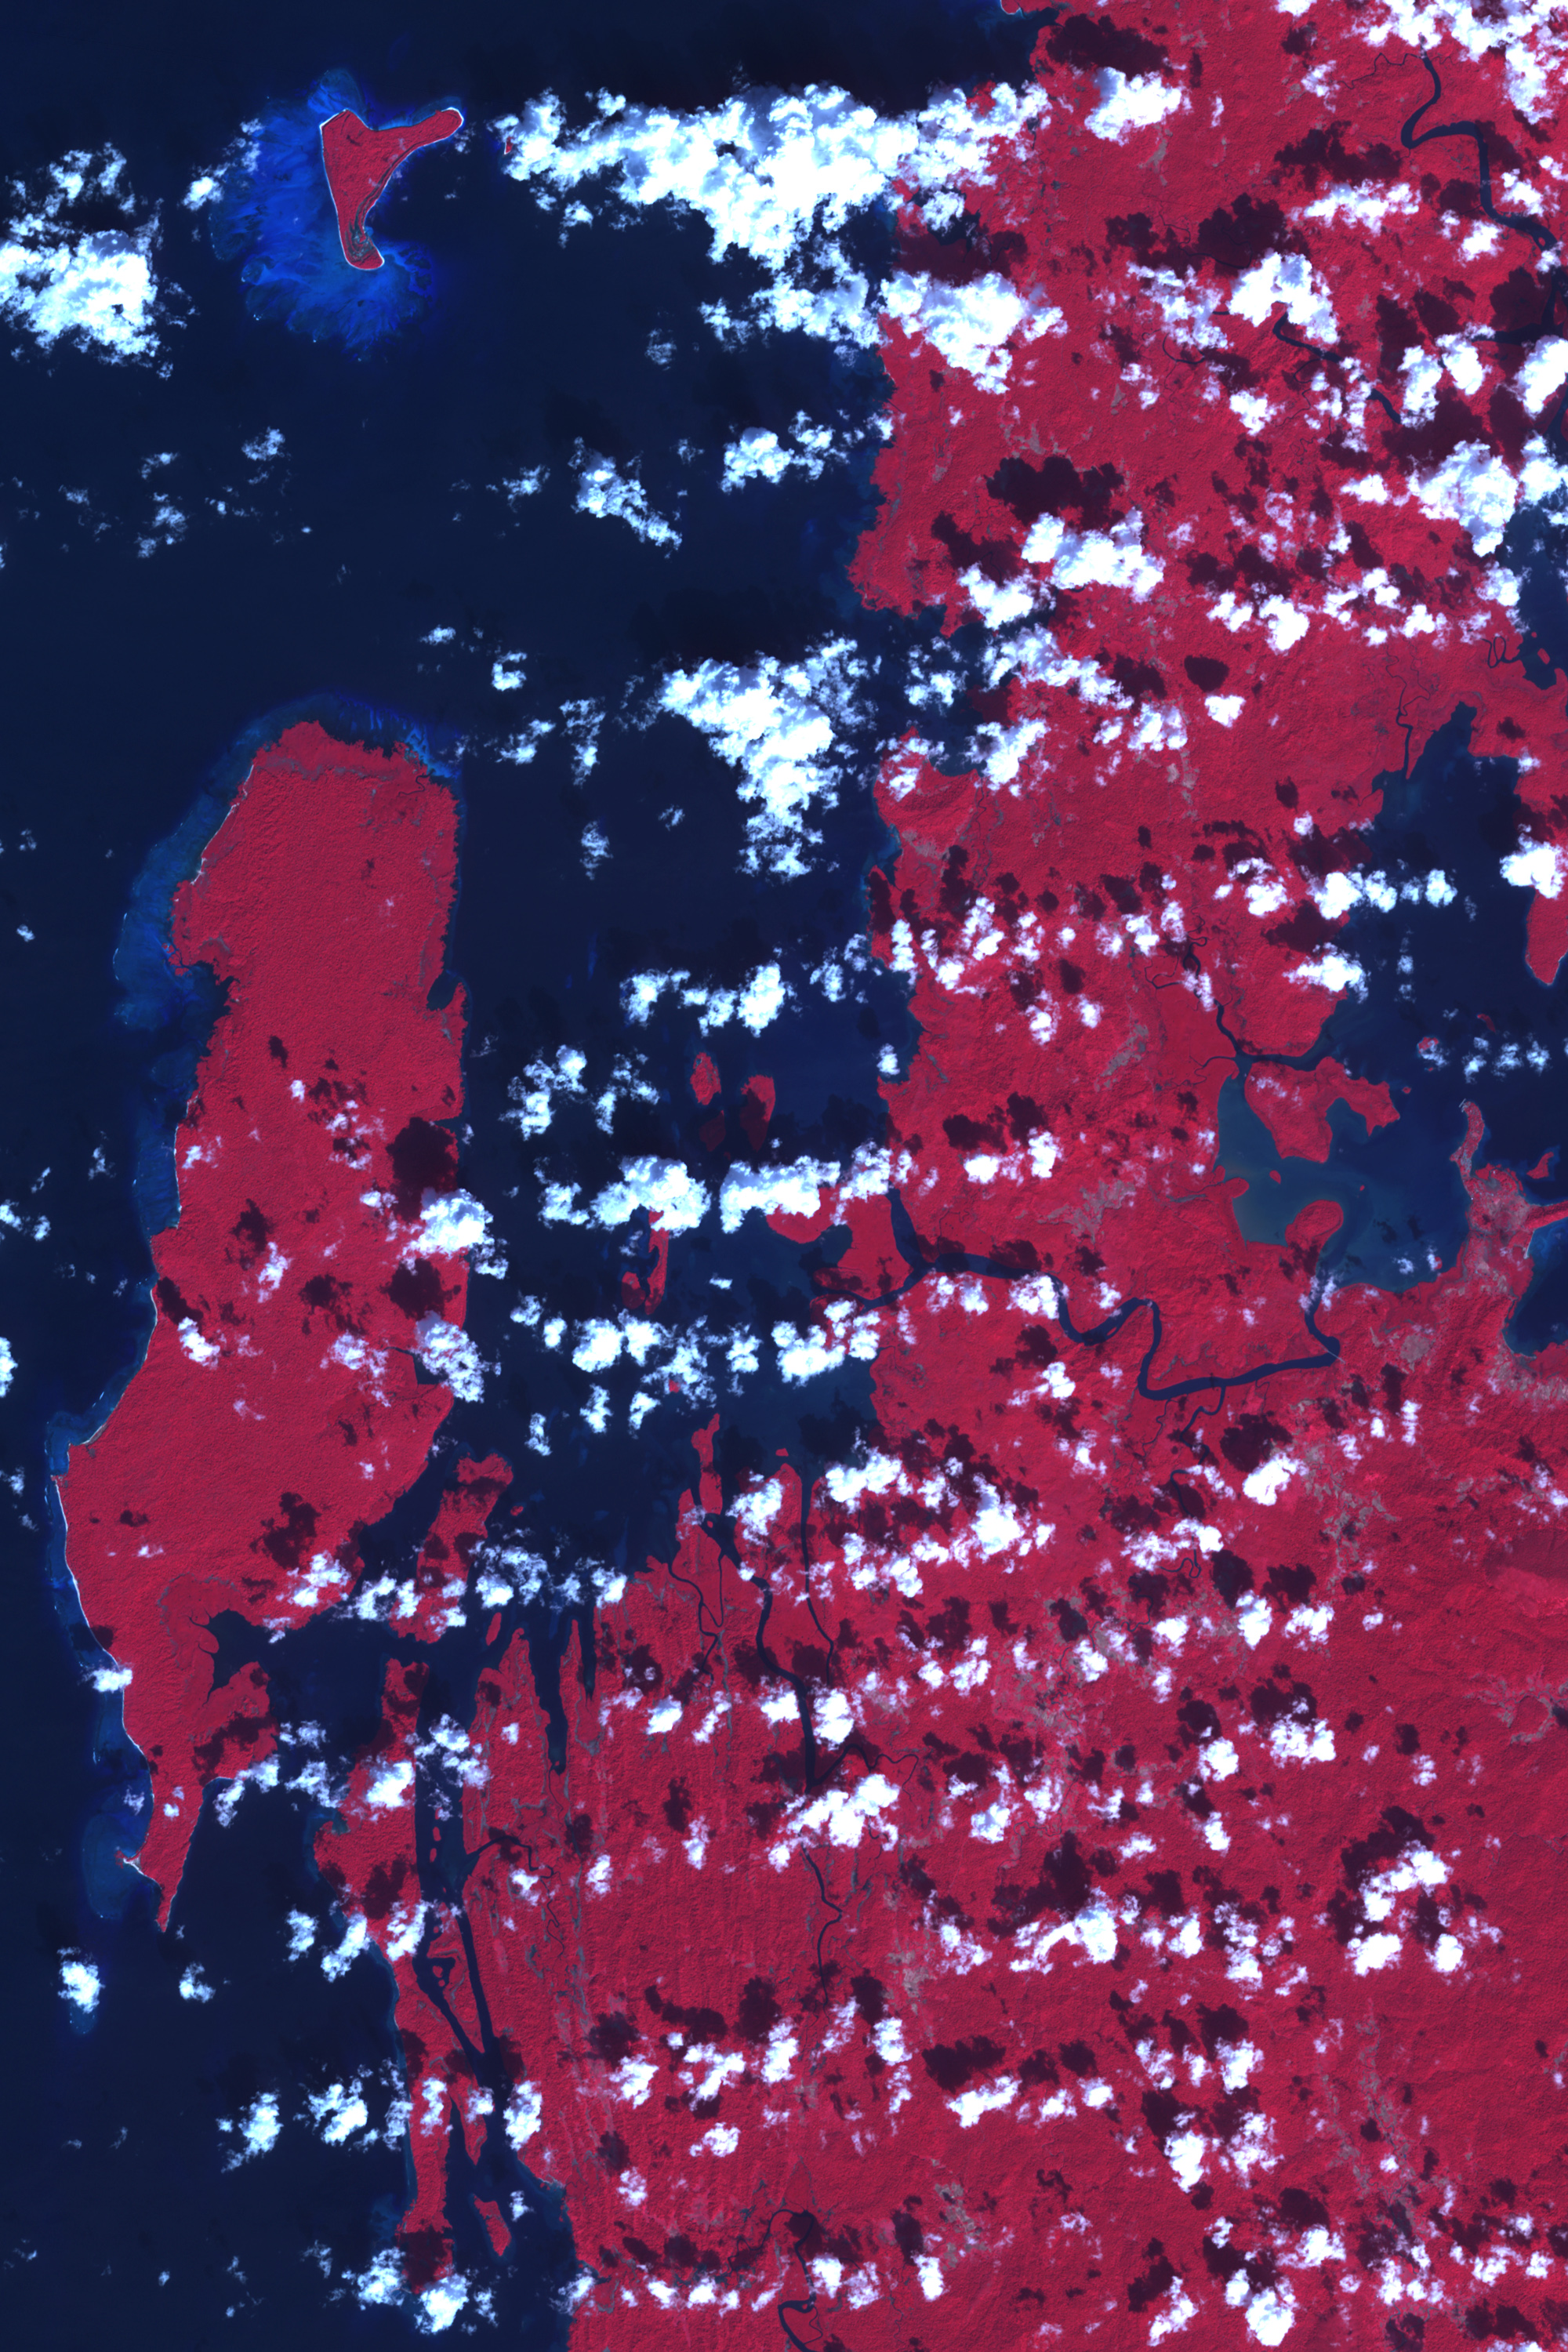
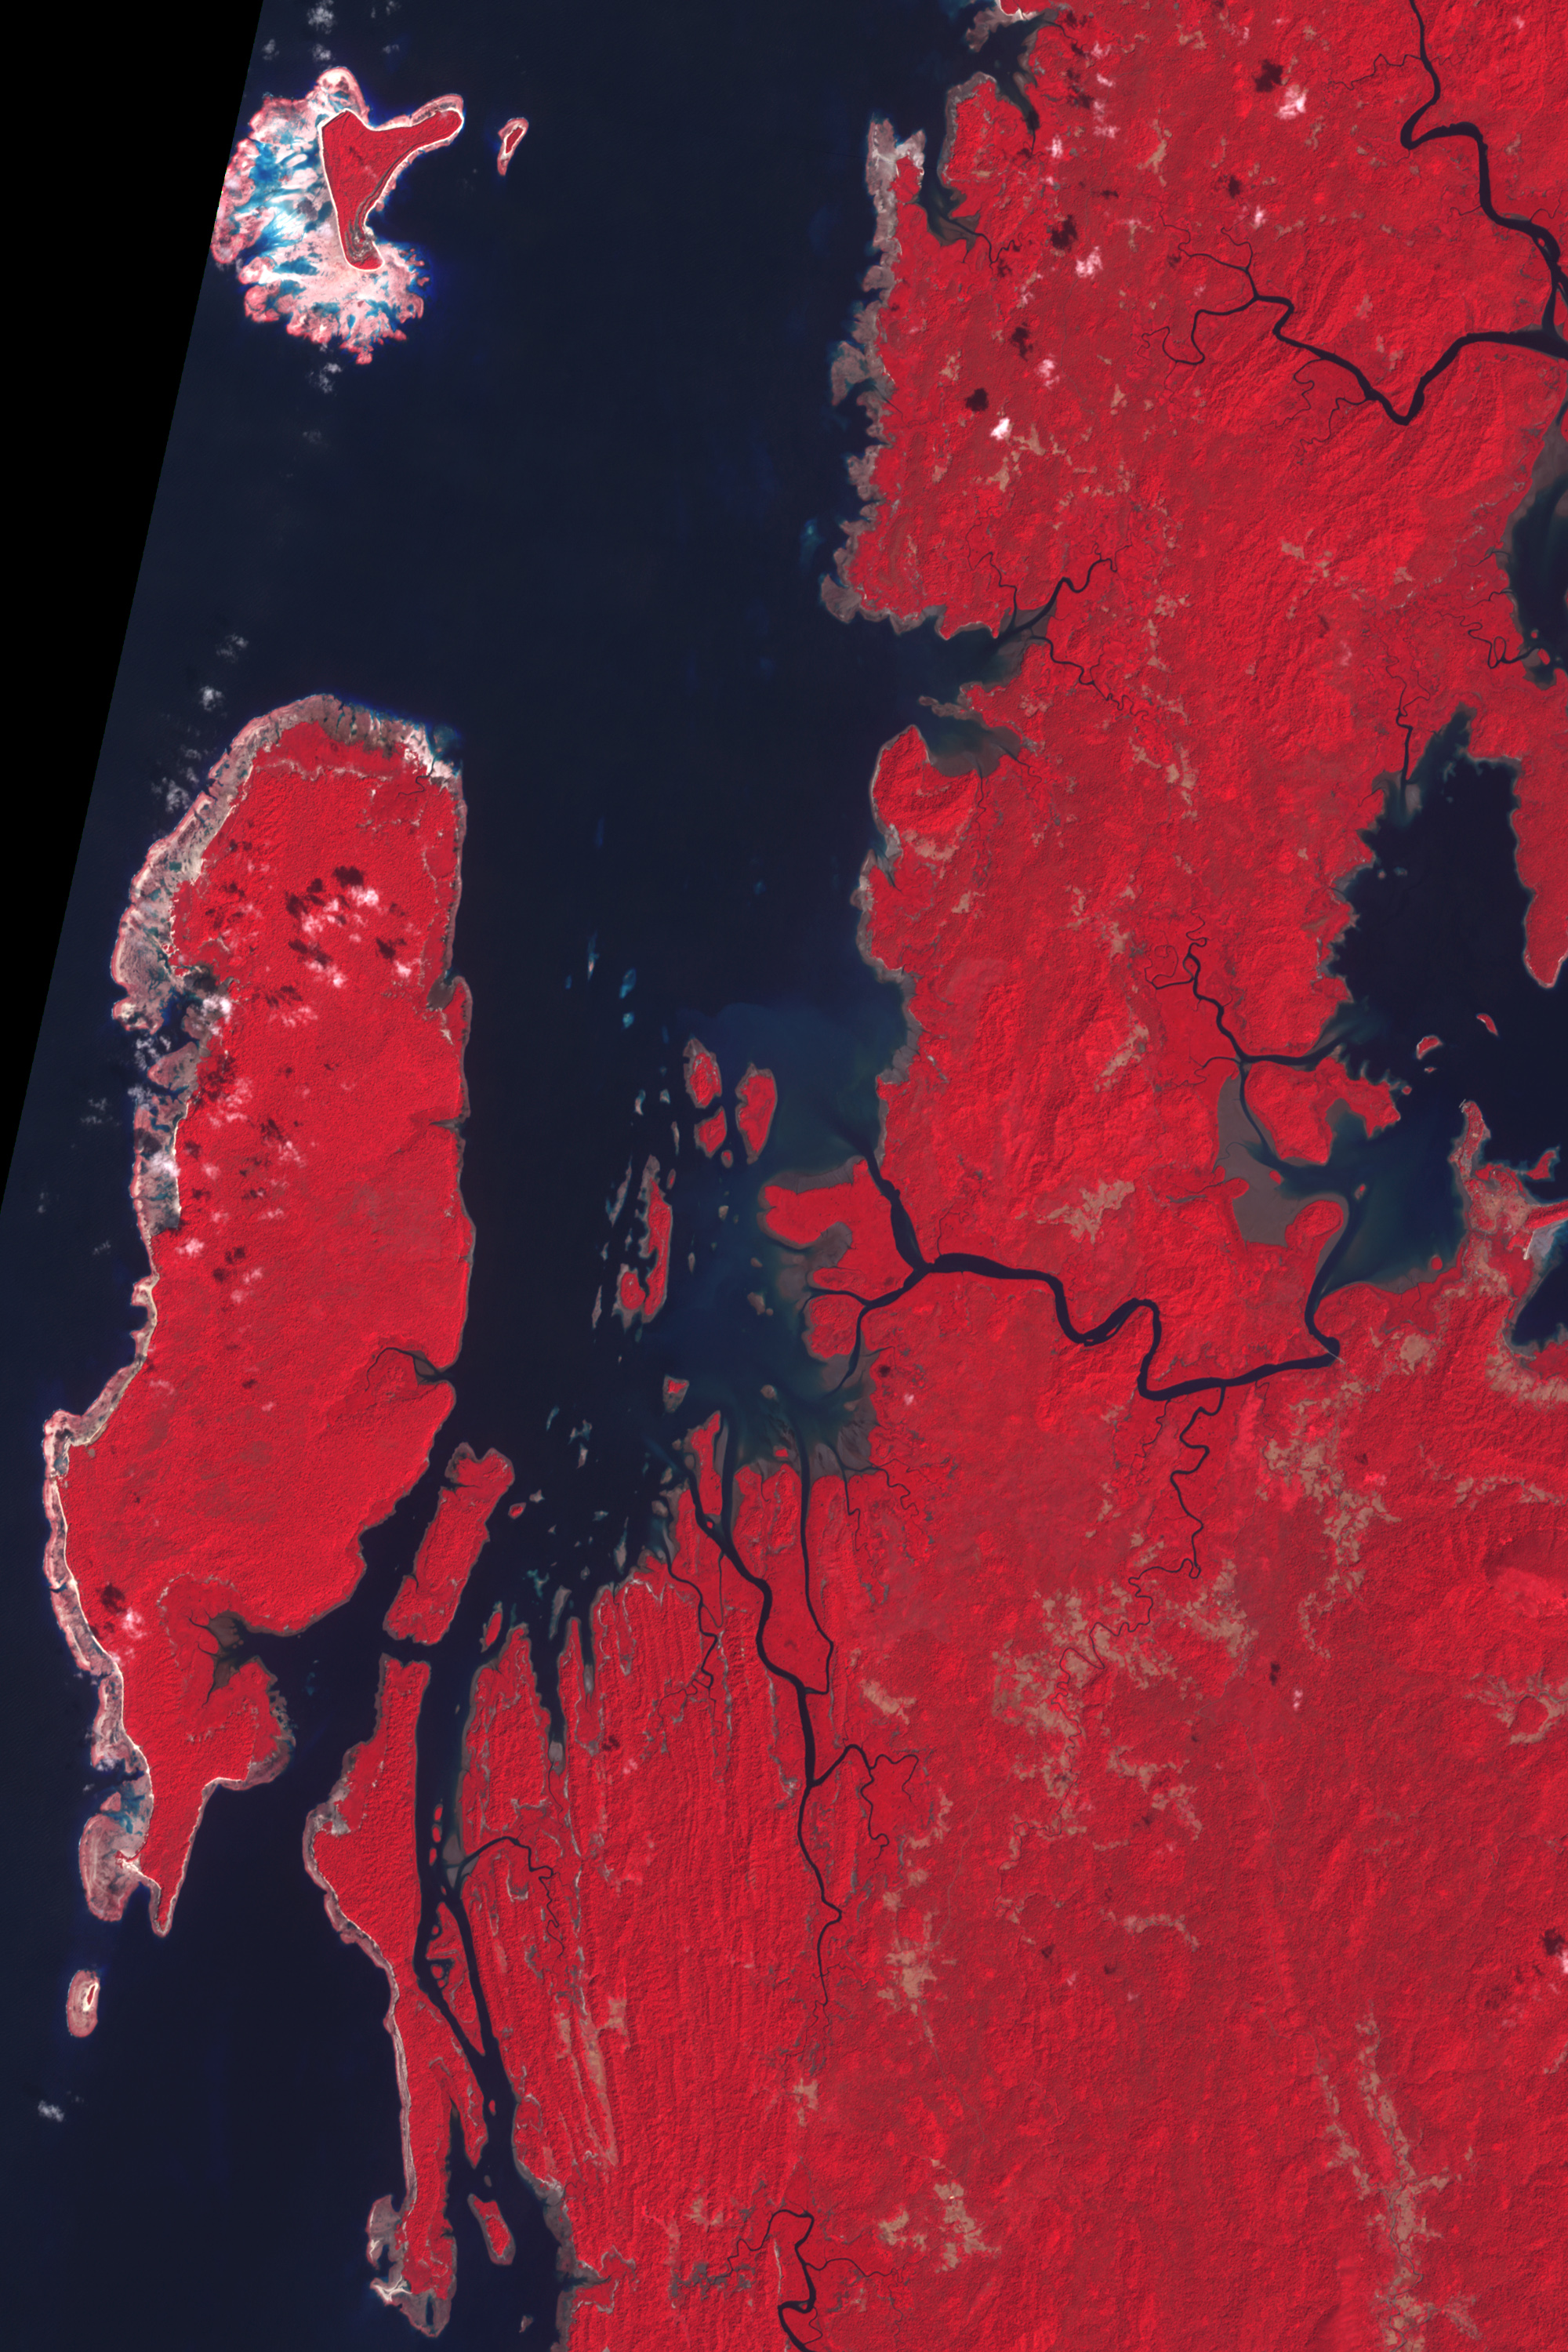
Meltzner says that one of the things that appeals to him most about science is how it provides endless opportunities to apply both your intelligence and your creativity to solve puzzles about how the world works. Before this study, he had never thought of using satellite data to study earthquakes in this way. But when the data you want—say, a GPS station every 10 kilometers in the Andaman Islands—doesn’t exist, you look for clues wherever you can find them, for example, in the pinkish hue of a coral reef in a false-color photo taken from hundreds of kilometers away in outer space.
Meltzner’s results from this study were folded into a comprehensive analysis of the quake that appeared in the prestigious journal Nature in early 2006. Similar research on the 2005 quake was published in Science. Getting published in Nature or Science is an achievement even veteran scientists take pride in. For a graduate student at the start of his career, it’s probably even more exciting. But the best reward of his research is the reception he has gotten in places all over the world where he has gone to study earthquakes.

“People are just so warm and welcoming and happy to see us. I have repeatedly come across people who have lost their houses, who have lost family members, who have lost almost everything they have, and yet they would be willing to give us shelter, give us food, give us anything that we want. It is such an incredible feeling to see that what you are working on—in addition to being published in scientific literature, which is, of course, very important—has the potential to make a direct improvement in people’s lives.”
References and Resources
- December 26, 2004, earthquake and tsunami images from the Natural Hazards section of the Earth Observatory.
- Elegant, S. (2005, December 12). Living on a Fault Line. Time: Asia. Accessed online September 27, 2006.
- Meltzner, A. J., Sieh, K., Abrams, M., Agnew, D.C., Hudnut, K.W., Avouac, J.-P., and Natawidjaja, D.H. (2006) Uplift and subsidence associated with the great Aceh-Andaman earthquake of 2004. Journal of Geophysical Research,
111, B02407, doi:10.1029/2005JB003891. - Subarya, C., Chlieh, M., Prawirodirdjo, L., Avouac, J.-P., Bock, Y., Sieh, K., Meltzner, A.J., Natawidjaja,D.H., and McCaffrey, R. (2006) Plate-boundary deformation associated with the great Sumatra-Andaman earthquake. Nature,
440, 46-51, doi:10.1038/nature04522.
NASA Earth Observatory story by Rebecca Lindsey; design by Michon Scott


