


On May 4, 2000, a prescribed fire on National Park Service land near Los Alamos, New Mexico, was blown out of control by erratic, gusty winds. The fire exploded into nearby Santa Fe National Forest, swept across lands at Los Alamos National Laboratory, and destroyed hundreds of homes in the town of Los Alamos. Even as firefighters were struggling to contain the blaze, another problem loomed in the minds of the people involved. Some of the burned land was in a watershed that fed into canyons where the Los Alamos National Laboratory, birthplace of the atomic bomb, had buried potentially radioactive waste before environmental regulations were as strict as they are today. What would happen when the monsoon season began in less than two months and thunderstorms drenched the fire-charred landscapes?

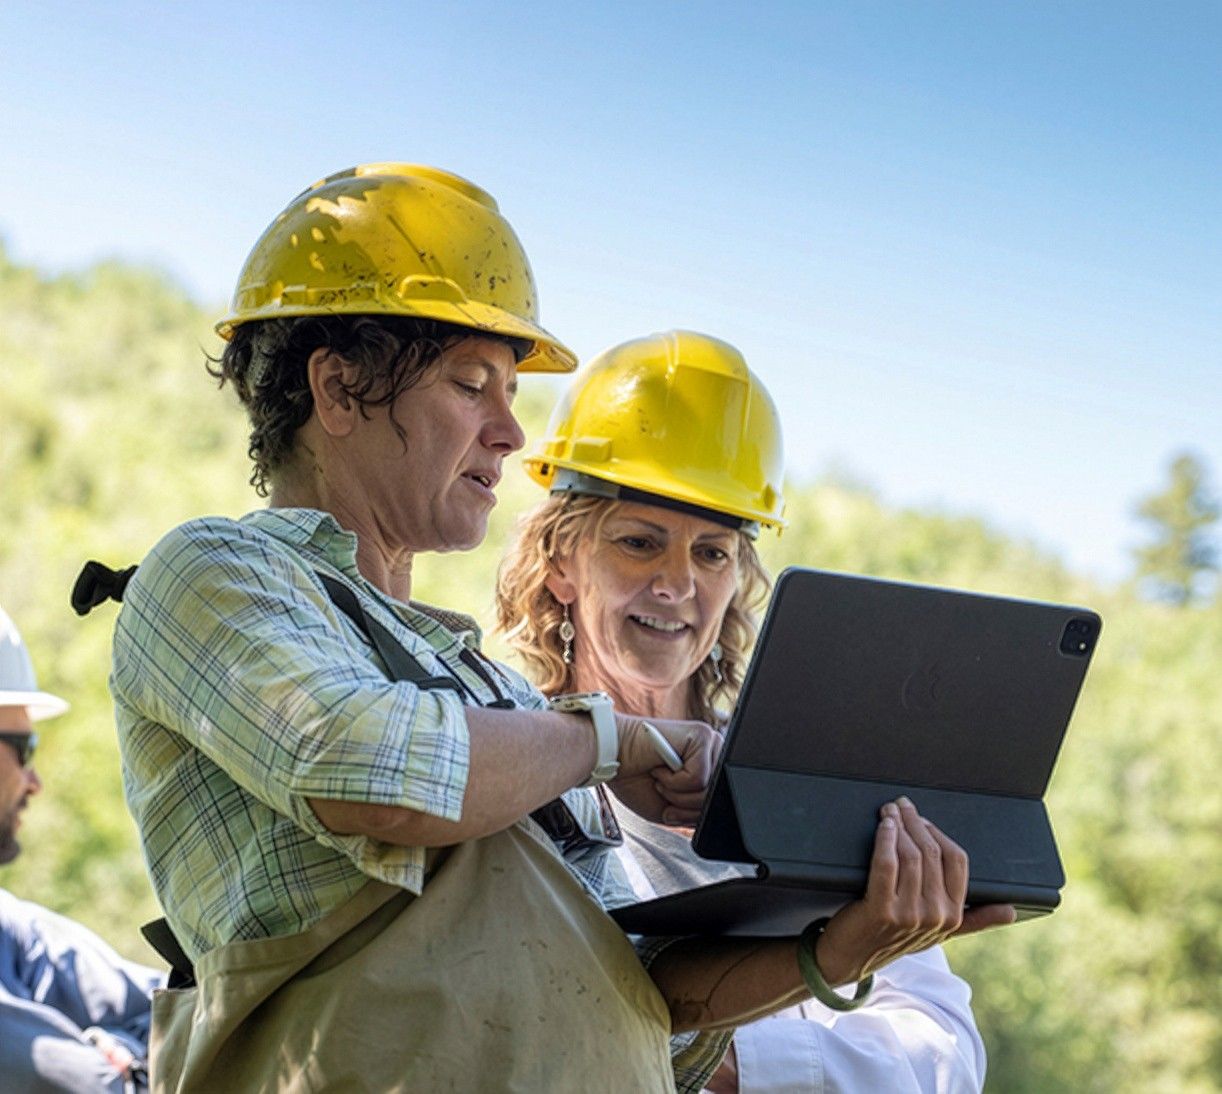
Answering that kind of question is the work of a multidisciplinary group of scientists and natural resource management experts called a BAER team, for Burned Area Emergency Rehabilitation. Members can come from several federal and state agencies and can consist of hydrologists, wildlife biologists, archaeologists, soils scientists, landscape architects, geologists, ecologists, engineers, foresters, botanists, and Geographic Information System (GIS) specialists. Usually on the ground before a fire is even fully contained, a BAER team evaluates the burned area for threats to life, property or natural resources due to post-fire flooding and erosion.

Why is flooding after a fire such a big threat? For one thing, flames consume leaf litter and decomposing matter on the ground that normally soak up water. Additionally, after a fire, the soil itself has the potential to become hydrophobic, or water repellant. Plants and trees have numerous protective chemicals with which they coat their leaves to prevent water loss. Many of these substances are similar to wax. Vaporized by the heat from fires, these substances disperse into the air and then congeal over the soil surface when the fire begins to cool. Like the wax on your car, these substances coat the soil, causing water to bead up and run off quickly. In general, the greater the fire intensity and the longer the fire’s residence time, the more hydrophobic the soil becomes.

In the short term, loss of vegetation and hydrophobic soil contribute to flash flooding and erosion—sometimes to the point of landslides. When fallen trees and other fire debris are added to the scenario, floods can become severe. Excessive rainwater can sweep ash and debris into streams and rivers, contaminating natural and manmade water sources. This past summer, the Hayman Fire in Colorado resulted in erosion problems that fed ash and sediment into Cheesman Reservoir, which supplies 15 percent of Denver’s water. Several other reservoirs were affected by the blaze as well. Humans aren’t the only ones affected. Mudslides resulting from the Missionary Ridge Fire near Durango, Colorado, washed mud and debris into the Animas River, killing hundreds of fish in the award-winning trout stream.

Beyond this immediate cause for concern, water-repellant soil poses a longer-term problem for new plant growth. As seeds and undamaged plant structures try to regenerate in a burned area, they need water. But rainwater has difficulty soaking down into water-repellent soil, sometimes slowing the healing process in severely burned areas.
In assessing such threats, BAER teams are under intense pressure: they must make an assessment report with seven days of a fire’s containment. If threats exist, such as the potential for a landslide on a fire-charred mountain slope to descend upon nearby homes, the team must include mitigation measures that can be carried out before the first damaging storm. In the case of the Cerro Grande Fire, those measures included the construction of a small dam in Pajarito Canyon to prevent any potentially radioactive-contaminated sediment from entering the watershed and being carried away from the site.
Satellites Do It Faster, Cheaper
Given the time constraints, remote sensing data have great potential to assist BAER teams in their assessments. Over the past decade, scientists at the USDA Forest Service’s Remote Sensing Applications Center (RSAC) in northern Utah have been developing techniques for using airborne and satellite-based instruments to map out burned landscapes. Mark Finco is a senior scientist specializing in remote sensing and GIS for the RSAC. He described the group’s BAER activities as a long-running project that began 8 or 9 years ago. The group’s initial efforts were in the development of a digital infrared color camera that could be mounted on an aircraft platform and flown over fires. Although the camera produces good imagery, it’s expensive, and it takes a lot of effort to map a large area. Over the last three years or so, the RSAC has been investigating how satellite-based images could be used in the BAER analysis.

The Multi-sensor Advantage
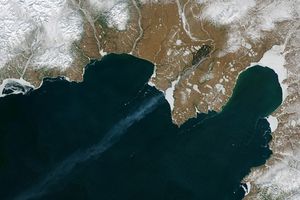
In gathering useful satellite images, the RSAC has to be flexible.Satellites travel in fixed orbits and observe specific areas on a prescribed schedule. If a satellite is set to pass over Idaho on a given day, scientists can’t change the orbit just because southwest Oregon is on fire. According to Finco, they use data from whatever sensor has the best look at the area at the time of the BAER assessment. They use NASA satellite sensors like the Enhanced Thematic Mapper Plus (ETM+), aboard Landsat 7, and MODIS (the Moderate Resolution Imaging Spectroradiometer) on the Terra satellite. They have also used the commercial satellites Ikonos and Quickbird, as well as France’s SPOT satellites. With all satellite data, a trade off must be made between how much surface detail can be collected, called spatial resolution, and how much area can be observed at a given time, called spatial coverage.

Geographer Rob Sohlberg with the University of Maryland describes how multiple satellite sensors are used in satellite mapping of burn severity. “In general, the higher the sensor’s spatial resolution, the less likely it is that it will be observing the area we need at exactly the right time for burn severity mapping of a specific fire.” Higher resolution data are also inevitably more expensive to obtain. “With a sensor like MODIS,” Sohlberg continues, “the coverage is much better—we see almost the entire surface of the Earth every day—but at coarser resolution.” These coarser- resolution data aren’t ideal for mapping out such detail as which hillside, creek, or ravine is especially damaged, but they can be useful for very preliminary mapping of burned areas, and perhaps more importantly, they can help scientists to decide in which areas high-resolution imagery is most needed.

Annette Parsons has worked for more than 20 years as a soil scientist and mapping specialist for the Forest Service, and has been involved with BAER activities for more than a decade. Parsons was quick to see the potential of the RSAC satellite-based products and is now serving as a liaison between the RSAC and the BAER teams that operate on the ground. Says Parsons, “One of our main goals is to get local forest officials to notify the RSAC as soon as they think a fire might end up needing a BAER assessment. The earlier we know, the better our window of opportunity for finding the best satellite imagery for the area and having it in the team’s hands when they arrive at the field location.” Parsons agrees that MODIS’ coarser resolution provides less detail than Landsat or SPOT, but she says, “You can count on it almost every day. And in very large fires, such as this summer’s Biscuit Fire in Oregon, coarser-resolution data may be all we get for some areas.”
Finco identifies another use for the MODIS products. “All these burn products have the potential to be used for carbon budget investigations.” Fires release into the atmosphere carbon that is stored in trees, plants, and even the soil if the fire is intense and long-lasting. Regrowth draws carbon back in and stores it in plant matter. “People tend to think that a burn perimeter on a map means everything within that perimeter was totally burned. But the vast majority of the terrain is a mosaic of areas showing different burn severity. If you understood this mosaic, it would improve carbon emission estimates.” MODIS data are well suited for this application, especially when the fires are in the several-hundred-thousand-acre category.

Using a combination of sensors allows the RSAC team to make burn severity maps quickly and relatively cheaply—especially compared to the cost of hours of helicopter time, which is the traditional reconnaissance source. It may seem trivial, but satellites have another advantage over sketch mapping from helicopters, which Finco and Parsons are both quick to point out. Leaning out of a moving helicopter as it weaves back and forth over a burned area, looking out to the terrain and down to the map in your lap not only makes it hard to be sure where you are, but also makes it hard to keep down your lunch!

Assessing Burn Severity from Space
When a BAER team hits the ground, they don’t have the time or resources to do a full canvass of the entire area affected by a fire. This is especially true as the size of the affected area increases, or in cases where significant portions of the fire burned in roadless or wilderness areas The team must decide in what areas to focus limited field time. The goal of the RSAC is to have the preliminary satellite-based maps in the hands of the BAER field teams as they are planning these decisions. Says Parsons, “The satellite burn severity map serves as a fast-track emergency product that guides the field team, helping them decide where to go. The field team then refines the maps based on ground observations.”

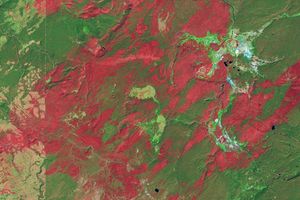
The way in which the maps are produced depend largely on what sensor provides the data, but most involve using vegetation characteristics as an indicator of soil conditions. Generally, the maps are based on an indicator called NDVI, for Normalized Difference Vegetation Index, or one called NDBR, for Normalized Difference Burn Ratio. NDVI is based on the principle that vegetation absorbs red light and reflects near-infrared light. Changes in the amount of each kind of energy reflected from the surface can signal how severely the pre-existing vegetation has been transformed by fire. NDBR is based on the observation that vegetation reflects energy in the near-infrared, while soil tends to reflect energy from the mid-infrared part of the spectrum. After a burn, the vegetation within the burned area has been reduced and the soil has been exposed. As a result, the near-infrared values are lower than before the fire, while the mid-infrared values are higher. These NDVI and NDBR relationships are used to classify areas in a satellite image into one of four burn severity categories: high, moderate, low, and unburned.
But How Good Are They?
While the BEAR teams revise the satellite maps based on field observations, their primary concern is conducting their own emergency assessment. They have neither the time nor the resources to provide any kind of systematic feedback to the satellite mappers to help them improve their maps. In search of something more scientifically defensible, the RSAC has partnered with scientists at the University of Maryland and obtained funding from the National Interagency Fire Center’s Joint Fire Science Program to collect their own field data on burn severity conditions, which they are using to check the accuracy of the satellite classification, a process called validation.

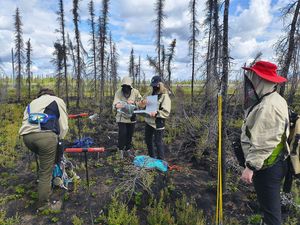
Sohlberg is one of the scientists who spent some time in the field this summer. Since BAER teams are often on the ground before fires are totally contained, Sohlberg had to become certified as an entry-level firefighter in order to do this work. A lot of the training was in the classroom, said Sohlberg, but they also had to learn how to dig fire lines, operate pumps and hoses, and how to maintain their tools. They had to participate in timed drills to see how quickly they could set up an emergency fire shelter using the distinctive shiny Mylar bags. Said Sohlberg, “We were out there to collect data, but we always had to remember to be on guard; and we had to carry full personal protective equipment: fire-resistant pants and shirt, 8-inch logging boots, fire shelter, compass, water, goggles, helmet and leather gloves. Although we were never in contact with active fire, there were still lots of hazards—damaged trees that are prone to falling, called snags; rolling rocks; and smoldering stump holes.”
In the field, the team uses a mapping-grade Global Positioning System (GPS) receiver that has a built-in data dictionary. Once the GPS device has pinpointed the scientists’ location, they can access the data dictionary, which prompts them with a series of preset questions about the burn severity at the site. Is there any ground cover left? How deep is the ash, and what color is it? How long does a drop of water sit at the surface before soaking in or running off? Are there any green trees left? Are there any needles or leaves left on the trees? What is your overall assessment of the burn severity at this location? Since a satellite maps the whole area, the team tries to collect data to match up with all the different burn categories within a fire perimeter. If the physical geography of the terrain is highly variable, for example because of topography or ecology, the team tries to collect data for each burn category in each of the different physiographic regions within the fire perimeter. That’s a lot of different categories.


Physiographic differences can be tricky for satellite classification. Says Parsons, “You have to be initially cautious about the satellite classifications, particularly in areas of diverse terrain or varying geology. Fire may quickly pass through a rocky area with already sparse vegetation, or grassland, and blacken everything. Or it might burn over a forested ridge, consuming acres of trees and all the understory vegetation. From a satellite, all these areas might look the same—just black—and might be classified as high severity. But the actual severity as far as the impact on the watershed would be very different. In the first case, the post-fire runoff and erosion would probably not be substantially increased over pre-fire conditions, and the vegetation would probably recover in a season. The effects could hardly be called severe. In the second case, the impacts would be much more severe.”

The RSAC has provided satellite-based burn severity maps for BAER teams for two fire seasons: 2001 and 2002. Parsons says that their experience suggests that the remote-sensing-based assessments are most accurate in more forested ecosystems. In that kind of terrain, they can often use the satellite maps from the RSAC without any major modification. In shrubby or rocky ecosystems, they require more fine tuning from ground-truth. Even so, Parsons says, her main criteria for the project’s success is less in how technically accurate the maps are and more in their utility to field crews. “We have produced satellite maps for at least 70 fires in the 2002 fire season, and the word we have gotten back from BEAR field teams is overwhelmingly positive. They may not be 100 percent accurate at fine scale, but they have been very useful in pointing teams to areas of greatest concern.” Using those criteria, the project can already be called a success.

That won’t stop the scientists from continuing to tweak their approach. Over the winter, Forest Service and University of Maryland scientists will look for ways to increase the accuracy of the satellite maps using data collected this past summer at the Missionary Ridge Fire in Colorado, the Rodeo-Chediski Fires in Arizona, the East Fork Fire in northern Utah, and the Biscuit, Winter, Toolbox and Eyerly Fires in Oregon. NASA is supporting that work as part of its Natural Hazards program. The team will also be preparing for another season of data collection in the summer fire season of 2003.

The group also plans to take advantage of its involvement in NASA’s newly created Wildfire Response Team to coordinate the logistics of acquiring imagery from airborne sensors. The team has their eye on the MAS (MODIS Airborne Simulator) on NASA’s ER-2 aircraft and the AIRDAS (Airborne Infrared Disaster Assessment System), developed by NASA’s Ames Research Center and the Forest Service to fly on a variety of aircraft. They also hope to make use of another Terra satellite instrument, called ASTER (Advanced Spaceborne Thermal Emission and Reflection Radiometer). ASTER offers unique capabilities in sensing shortwave infrared radiation, which makes it particularly useful for seeing through smoke. Increasing the number of data sources increases the team’s opportunity to produce useful images and burn severity maps to BAER teams and also increases opportunity for cross-comparisons of all the remote-sensing data, which serves as means of validation in itself.
This partnership is not the first for the RSAC, NASA, and University of Maryland. The three originally teamed up as part of the MODIS Land Rapid Response Project, in which daily imagery and fire detections from MODIS were relayed from NASA’s Goddard Space Flight Center, to the University of Maryland, and on to the RSAC for use by the National Interagency Fire Center as it allocated firefighting personnel and resources across the country. That collaboration ultimately led to the installation of a MODIS Direct Broadcast Receiving Station at the RSAC and paved the way for the current work. With solid validation data, the satellite-based burn severity maps produced in coming seasons will only get better, saving BAER crews precious time as they assess the dangers left behind in the wake of wildfires.
For more information, visit:
Ongoing BAER activities at summer 2002 fire sites:
- Missionary Ridge Fire
- Hayman Fire
- Biscuit Fire
- McNally Fire
NASA Earth Observatory story by Rebecca Lindsey and designed by Robert Simmon