


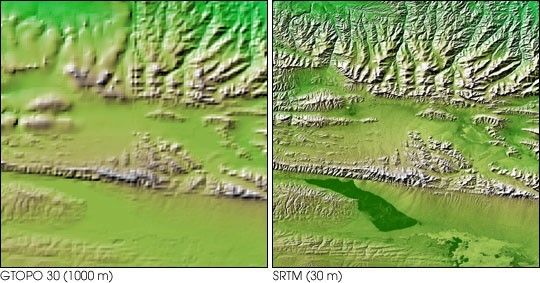
These two images show exactly the same area, part of the Kunlun fault innorthern Tibet. The image on the left was created using the best globaltopographic data set previously available, the U.S. Geological Survey’s GTOPO30.In contrast, the much more detailed image on the right was generated with datafrom the Shuttle Radar Topography Mission (SRTM), which collected enough measurementsto map 80 percent of Earth’s landmass at this level of precision. In a new partnership with the National Imagery and Mapping Agency, data from the SRTM are now being shared with researchers around the world to improve aviation safety, mitigate natural hazards, and contribute to smarter and more sustainable urban development—particularly in underdeveloped countries. (Click to read the press release.)
The area covered in the images above is the western part of the Kunlun fault, at the north edge of east-central Tibet. The sharp line marking the southern edge of themountains, running left to right across the scene represents a strike-slipfault, much like California’s San Andreas Fault, which is more than 1,000kilometers (621 miles) long. The most recent earthquake on the Kunlun faultoccurred on November 14, 2001. At a magnitude of 8.1, it produced a surfacebreak over 350 kilometers (217 miles) long. Preliminary reports indicate amaximum offset of 7 meters (23 feet) in the central section of the break. Thisfive-kilometer- (three-mile-) high area is uninhabited by humans, so there waslittle damage reported, despite the large magnitude. Shuttle Radar TopographyMission maps of active faults in Tibet and other parts of the world providegeologists with a unique tool for determining how active a fault is and theprobability of future large earthquakes on the fault. This is done by bothmeasuring offsets in topographic features and using the SRTM digital map as abaseline for processing data from orbiting satellites using the techniques ofradar interferometry. Based on geologic evidence, the Kunlun fault’s long-termslip rate is believed to be about 11 millimeters per year (0.4 inches per year).The Kunlun fault and the Altyn Tagh fault, 400 kilometers (249 miles) to thenorth, are two major faults that help accommodate the ongoing collision betweenthe Indian and Asian tectonic plates.
In contrast with the wealth of detail visible in the Shuttle Radar TopographyMission topographic map (right), the best data previously available (left)barely discriminate the sharp break caused by the fault. Note also that theupper left quadrant of the GTOPO30 map was created from a lower-resolutionsource than the rest of the GTOPO30 data. Another major advantage of the shuttleradar mission is its consistent coverage, unlike previous topography data.
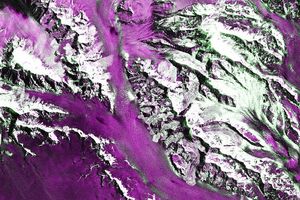
This image combines three visualizations of data from the Shuttle RadarTopography Mission. The image brightness corresponds to the strength of theradar signal reflected from the ground combined with shaded relief derived fromthe mission’s topography measurements, while colors show the mission’s elevationmeasurements. Colors range from blue at the lowest elevations to brown and whiteat the highest elevations.
Size: 111 by 90 kilometers (69 by 56 miles)
Location: 36.0 degrees north latitude, 93.0 degrees east longitude
Orientation: North is at the top
Date Acquired: February 2000 (SRTM)
False-color image of the Kunlun Fault
References & Resources
Image Courtesy NASA/JPL/NIMA