


- Quicktime (.mov) format (576 KB)
- MPEG-1 (.mpg) format (894 KB)
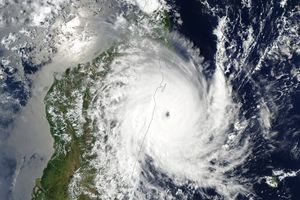
Sudal began as a tropical depression back on the 4th of April 2004 inthe central West Pacific in the central Caroline Islands southwest ofTruk. Over the next two days Sudal slowly gathered strength becominga Category 1 typhoon on the 6th with maximum sustained winds estimatedat 70 knots (81 mph) by the Joint Typhoon Warning Center. The storm atfirst tracked off to the northwest but then headed mainly due westpassing well south of Guam. By April 7th, Sudal had become a Category 2storm with winds increasing to 90 knots (104 mph). The storm was thenwell south of Guam and heading for the Yap Islands and Ulithi Atoll.Sudal continued to intensify becoming a powerful Category 3 storm thenext day with winds up to 110 knots (127 mph) on the 8th as it struck theYap Islands. Sudal then moved northwest into the Philippine Sea and isexpected to intensify further before turning to the northeast.
The Tropical Rainfall Measuring Mission (TRMM) satellite captured theseimages of Typhoon Sudal as it was strengthening into a major typhoon.The top image was taken at 7:35 UTC on 6 April 2004. It shows thehorizontal distribution of rain rates observed by TRMM. Rain rates inthe center swath are from the TRMM Precipitation Radar (PR), the firstand only precipitation radar in space, and rain rates in the outer swathare from the TRMM Microwave Imager (TMI). The rain rates are overlaidon infrared (IR) data from the TRMM Visible Infrared Scanner (VIRS).In this first image, TRMM shows that Sudal is still rather weak anddisorganized with only a limited area of moderate rain (green area) nearthe center of circulation containing an isolated stronger core (red area)and no evidence of a closed eye. At the time, Sudal was a minimalCategory 1 typhoon. The bottom image taken 48 hours later at 7:21 UTC onApril 8 reveals a very different looking storm. Sudal now has a well-defined, closed but still rather large eye according to the rain field.The southwestern part of the eyewall contains an area of intense rainfall(darker reds). This intense rain indicates that heat is being releasedinto the storm's center providing the fuel to drive its circulation andpossibly strengthen the storm. Rainfall rates in this image are overlaidon visible data. The dark area seen in the visible data adjacent to theintense rain area could be due to a subsidence hole whereby airsurrounding strong convection sinks causing clouds to evaporate. At thistime, the storm was now at Category 3 with winds at 110 knots.
TRMM is a joint mission between NASA and the Japanese space agency JAXA.
References & Resources
Images produced by Hal Pierce (SSAI/NASA GSFC) and caption by Steve Lang (SSAI/NASA GSFC).