


Urban Development
Landsat captures patterns of urban growth, enabling city planners to monitor the impacts of land use change and plan future development.
Landsat’s Role in Supporting Urban Planning
Cities are places of light, action, complex social interactions, multi-faceted cultures, and fast-paced living. It’s no wonder cities are growing faster than rural areas. Nearly 60 percent of the world’s human population now lives in areas of contiguous urban development, a new milestone. People are driving landscape-scale changes on our planet.
Considering that people change the land surface, vegetation, water cycle, radiant heat, and other aspects of the landscape, the nature of this milestone has important implications for life. Using Landsat data, people can monitor urban change and also forecast patterns of change in future urban landscapes. Landsat sensors employ a spatial resolution of 30 m, an ideal scale for observing human impacts on the land. The sensors detect urban growth with visible and infrared reflectivity consistently, objectively, and dependably over time.

Landsat and Urban Planning PDF
Landsat Data for Local and Global Decision-making
- Monitoring urban sprawl and land use efficiency
- Measuring impervious surface area
- Observing heat island effects
- Linking urban growth and rainfall pattern change
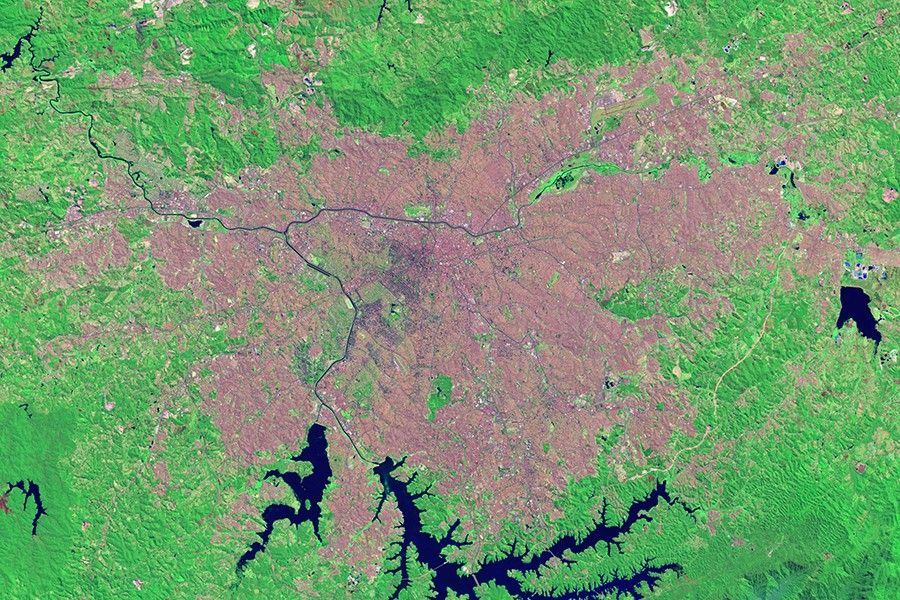
Monitoring urban sprawl and land use efficiency
Using Landsat, researchers create land-use maps that distinguish urban surfaces from vegetation. They use computer models to quantify land use efficiency; assess the impact of urbanized land on energy, water, and carbon balances; and project growth. Landsat helps researchers keep up with the pace of urban change. The Landsat-based Human Built-up and Settlement Extent map provides a global look at urbanization patterns, giving urban planners and decision-makers important insights about urban expansion. Similarly, the World Settlement Footprint dataset relies on Landsat data to understand urbanization changes year-by-year from 1985 to 2015.
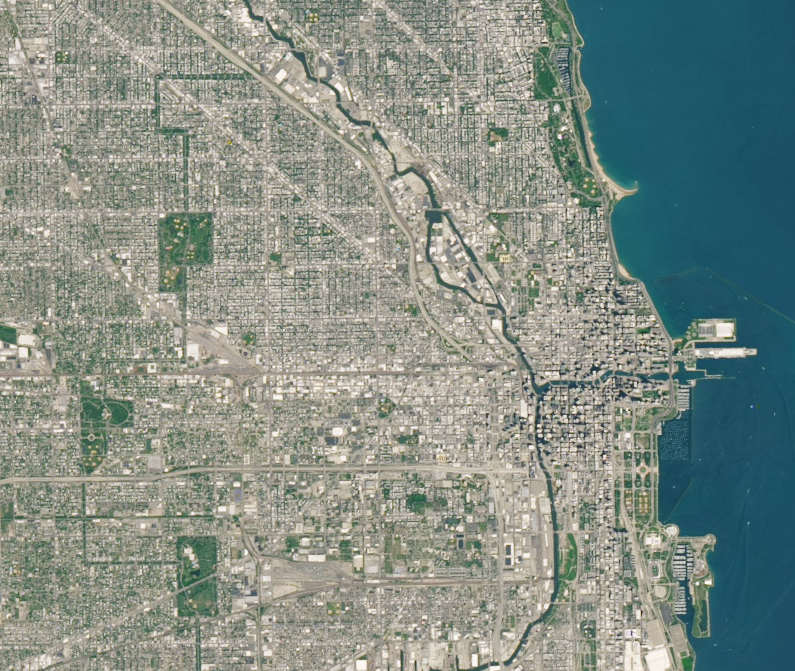
Measuring impervious surface area
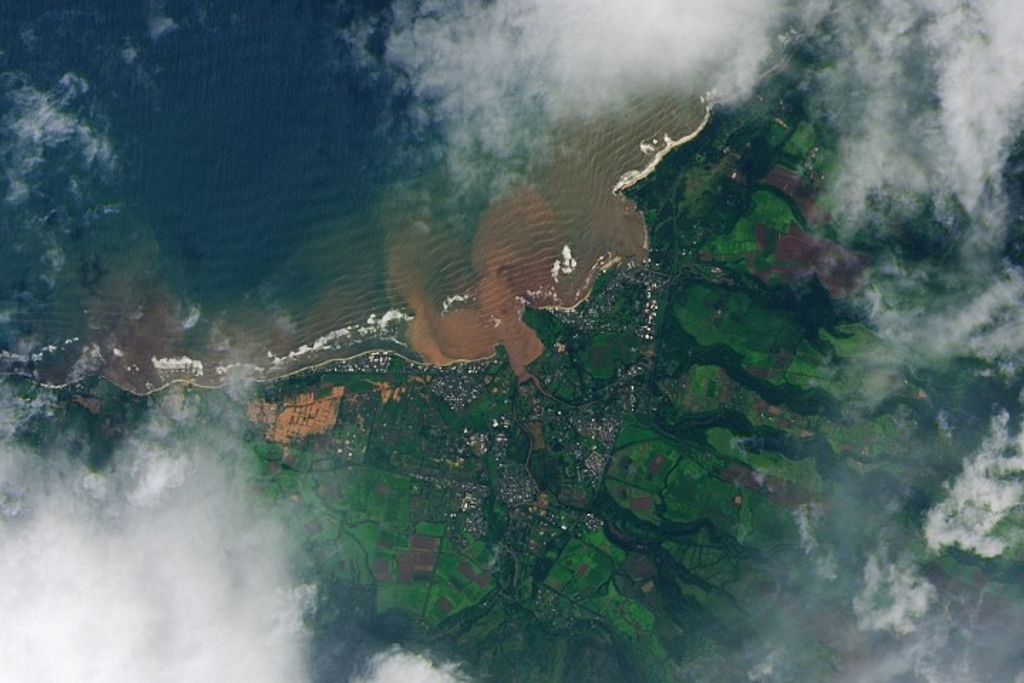
Highly impervious surfaces, such as concrete, asphalt, and rooftops, prevent precipitation from infiltrating soils. Impervious surfaces concentrate pollutants into streams and ultimately into rivers, lakes, bays, and oceans. They alter the hydrological regime and cause soil erosion by inducing faster runoff from land. Landsat observations of visible and infrared reflectivity are highly effective at quantifying changes in land use from pervious to impervious surfaces.
Observing heat island effects
Urban construction materials such as metal, concrete and asphalt absorb, reflect, emit, and store heat differently than tree or grass-covered land. During the day, urban materials absorb heat and hold it long after the sun sets, creating a warm bubble (heat island) over a city that can be as much as 6 degrees Celsius (10 degrees Fahrenheit) higher than temperatures in surrounding rural areas. Landsat’s thermal imaging capacity clearly indicates where temperatures are heightened by urban landscapes.
Linking urban growth and rainfall pattern change
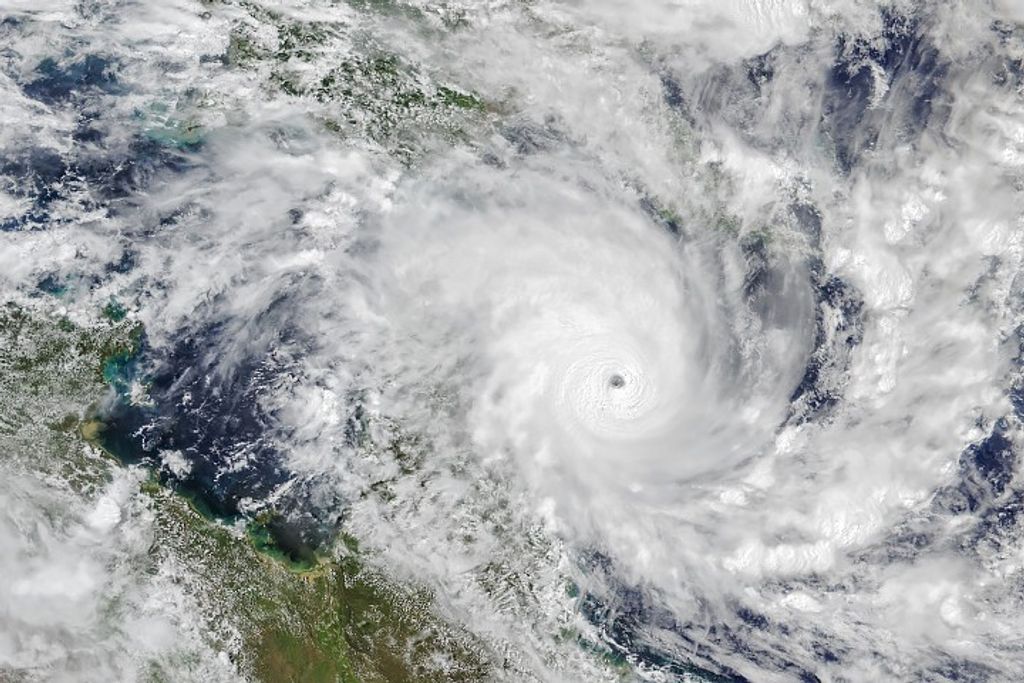
Landsat observations of urban land cover together with weather and other data have helped to show that urban heat islands can influence where and how much it rains. The heating of the surface and the overlying air creates instability in the atmosphere that encourages air to rise. As it rises, it cools, and water vapor condenses into rain that falls downwind of the city. Rainfall downwind of major urban areas can be as much as 20 percent greater than in areas upwind.
Related Resources
- High-Resolution Data Products Help Illuminate Urbanization’s Reach
- Vegetation Essential for Limiting City Warming Effects
- Mapping Chesapeake’s Future From Today’s Land Use
Latest News

The Landsat satellite program, with its unparalleled 53-year historic record, can reveal changes through the Annual National Land Cover Database…
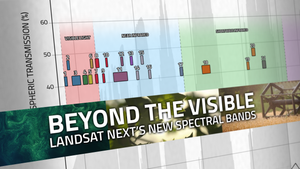
With Landsat Next’s 26 new spectral bands, we’ll be able to see our planet like never before. Landsat Next’s enhanced…
More water is taken from the Colorado River than it has to give. Better water use accounting made possible by…